
New Mobile Improvements!
ANNUAL SUBSCRIPTION PROMO! We’re now offering $300 off of the annual Portfolio Manager! We have overlayed chart indicators and several backtested algos complete with notifications and we anticipate more near-term improvements. Your needs are our focus, and we want the platform to become indispensable for your trading! Enter code MAY2025 at checkout to take advantage of this limited time offering.
We’ve rolled out some major mobile improvements tonight that we hope will make the experience of using the website on your mobile browser more effective for you.
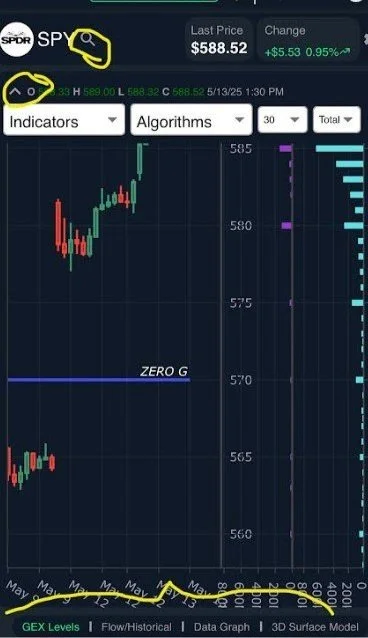
Starting with the magnifying glass next to the ticker symbol (see the screenshot below), this is now what you’ll click to pull up the next ticker you want to see.
The arrow just below that (facing down when not selected, of course) gives you a menu of choices for the indicators, algos, and timeframes you want to select. I personally like to minimize the menu by clicking the arrow again after making my selections, as you’ll notice the wheel cogs that will appear next to each indicator (where you can change the inputs for those indicators) are sometimes overlapped by the menu and therefore hidden. Minimizing the menu also allows the GEX Levels data to cover more of the screen.
Lastly for this section, the bottom of the screen shows the four links that take you to the GEX Flow/Historical, Data Graph, and 3D pages.
The wheel cog at the top right of the screen pulls up an abbreviated menu so you can toggle what you see on the GEX Levels screen.
GEX Flow and Historical GEX are less “clunky” and easier to navigate as well as easier to see the data. Press your finger over the desired blue dot corresponding to each trading day to see the total net GEX from that day’s closing value.

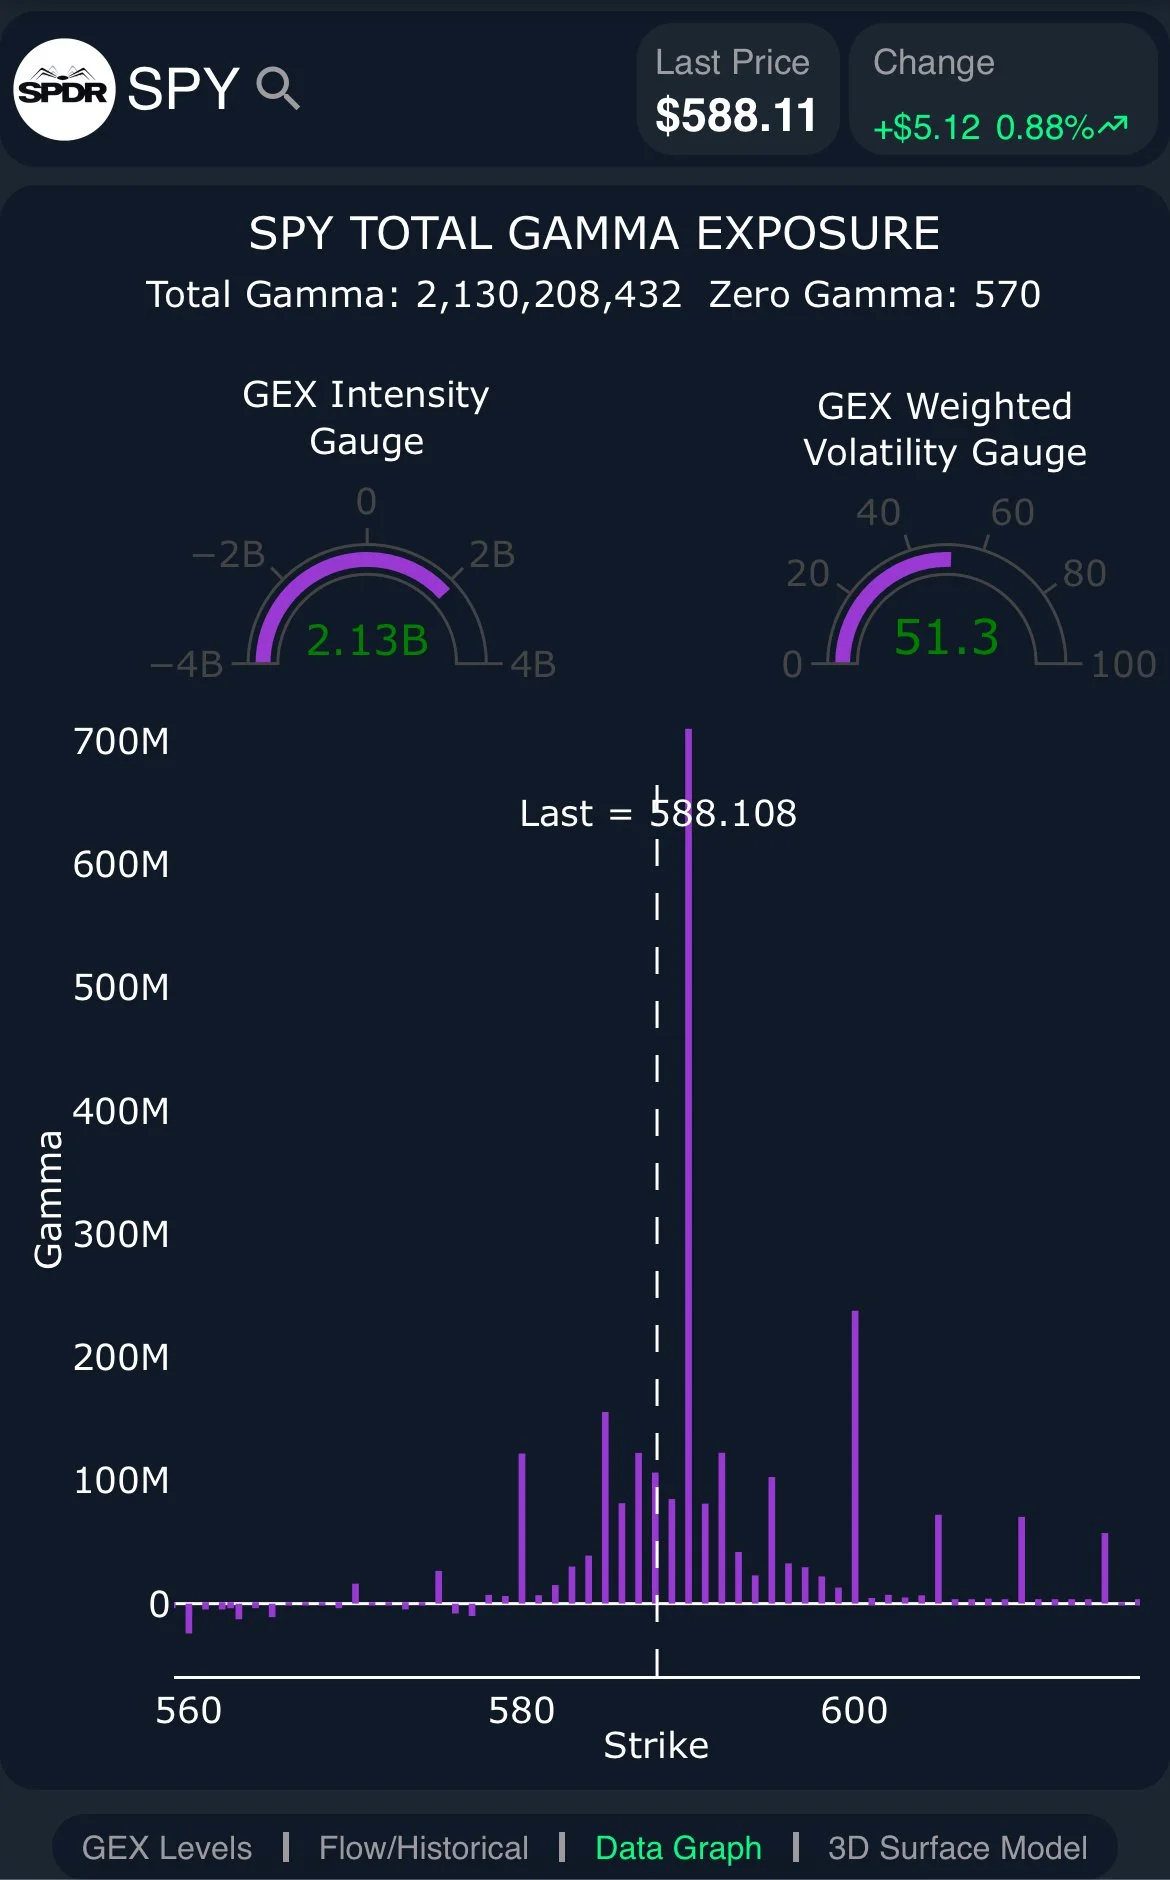
The GEX Data Graph has been improved to make the data more readable on a mobile device.
You can also hold your finger just below the strike line to scroll left/right along the line.
Press on the GEX cluster to see data regarding the size of the cluster. Starting with your fingers together, you can move them apart to zoom in on the graph.
press quickly twice against the screen to reset the GEX data so you see the full picture again.
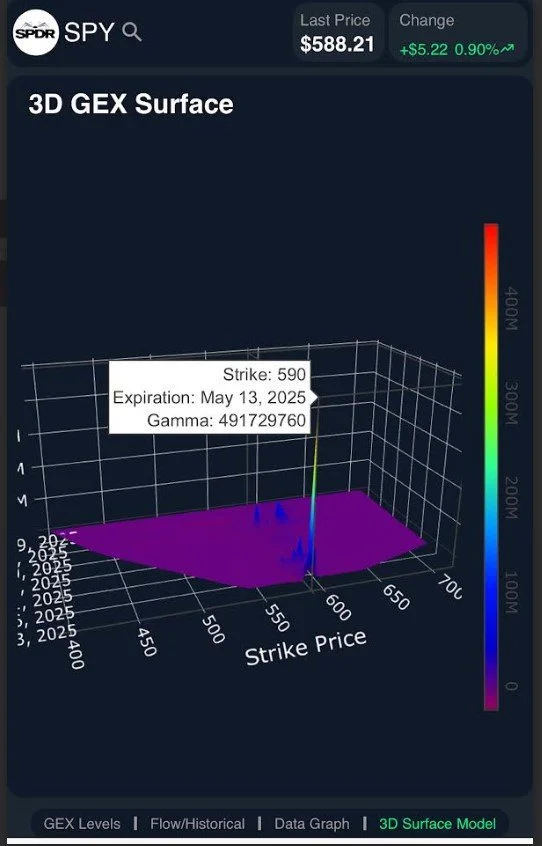
Hold your finger on the screen and move around the 3D Graph to see individual GEX clusters from a different angle. Press specifically on those clusters to reveal the expiration date and size of each cluster.
Have a good remaining week ahead, and don’t hesitate to email us (support@geeksoffinance.com) or post in Discord if you run into any issues or have any suggestions. We appreciate it!
The Geeks Of Finance
The information provided by Geeks of Finance LLC is for educational purposes only and is not intended to be, nor should be construed as, an offer, recommendation or solicitation to buy or sell any security or instrument or to participate in any transaction or activity. Please view our Investment Adviser Disclaimer and Risk Disclosure.