
Extremes & Divergences Approaching FOMC: September 16 Stock Market Preview
PORTFOLIO MANAGER ANNUAL SUBSCRIPTION PROMO- $300 off of the annual Portfolio Manager subscription Enter code SEPTEMBER2025 at checkout! ENDS SOON!
You can watch our latest YouTube video by clicking here. We Take a look at major indices, the VIX, and some other tickers and trades taken, so give it a look if you have a few minutes!
Before we jump into some concerning short-term data points (for bulls), let’s remember the context that the bigger picture for equities still looks bullish. Any dip of substance (which we arguably haven’t seen since April) is likely to be a good buying opportunity in our view.
The VIX had its first daily close above the Hull Moving Average since the end of August/beginning of September, despite a failed attempt to close above it 10 days ago.
I underlined 4 spots just since July where the first daily close above the line marked the beginning of a relatively larger VIX spike towards the 20 area or higher. Will today’s close lead to a different result? It’s always possible, and perhaps hedging as we approach monthly VIX expiration and FOMC on Wednesday is a valid factor.
GEX still shows very few participants anticipating a move below 15 for the VIX. In the event of a spike, we might reach 20.

IWM is really sticking to the Hull closely for the last two days, not really showing its hand in terms of the intended next move.
We do have bullish rising Keltner channels and GEX (denoted by the green and red bars, where green=positive GEX and red=negative GEX) at 245 and 250 that is at least plausible this week.
I would consider it a slight negative that we don’t see GEX increasing at those higher strikes in recent days, though the upper Keltner channel is aligned with the 245 zone, giving us more than one reason to see 245 as a possible upside target.
The volume in light blue between 200-225 today was extremely unusual in that we have consecutive out-of-the-money strikes in 5-point increments that show volume exceeding any in-the-money or higher positive strike. Someone’s eager to bet on the downside with IWM in the near-term?
220-225 seem to be the most logical downside targets given the overall bullish trend, and if we do see those levels, we may have the best buying opportunity since May (may I repeat May one more time? Maybe?) for the next push higher.

Switching gears to QQQ, we actually do see GEX having grown at 600, now less than 2% away. 600 also matches up with the upper edge of the Dealer Cluster zone and the upper Keltner channel.
We’re quite stretched above the rising Hull, and I’ve circled previous spots where QQQ was anywhere from 10-16 points away from the Hull, and such stretches typically lead to reversion back to the line. Given the current spread of roughly 8 points, QQQ can stretch higher toward 600 (with the recent past as our guide), though risk/reward is tilted toward at least modest downside given the factors outlined.

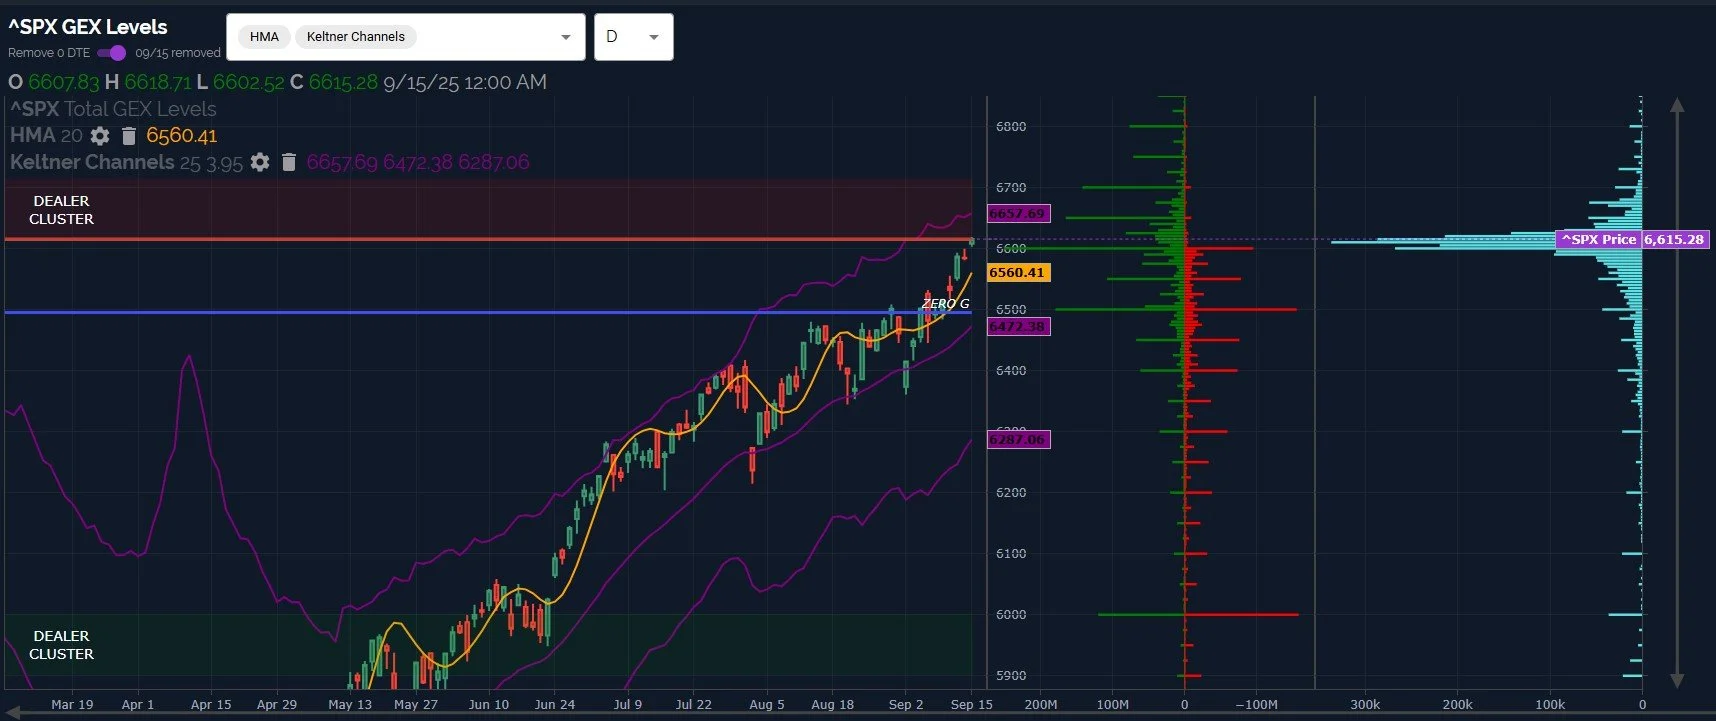
SPX has a similar setup as QQQ, with the stretched distance above the Hull, the favorable odds of a push higher toward the upper Keltner channel (can we get an overshoot of 6657 to 6666 for the 666 2009 low conspiracy crowd?), followed by a pullback of some sort.
A pullback could happen at any time, so let’s not lose focus of the fact that we’re currently in the upper Dealer Cluster zone, but we want to analyze possibilities of what might happen, not what we want to see happen. Our reaction to the unexpected is also important, though that discussion is better had in real time as we have new data to analyze.
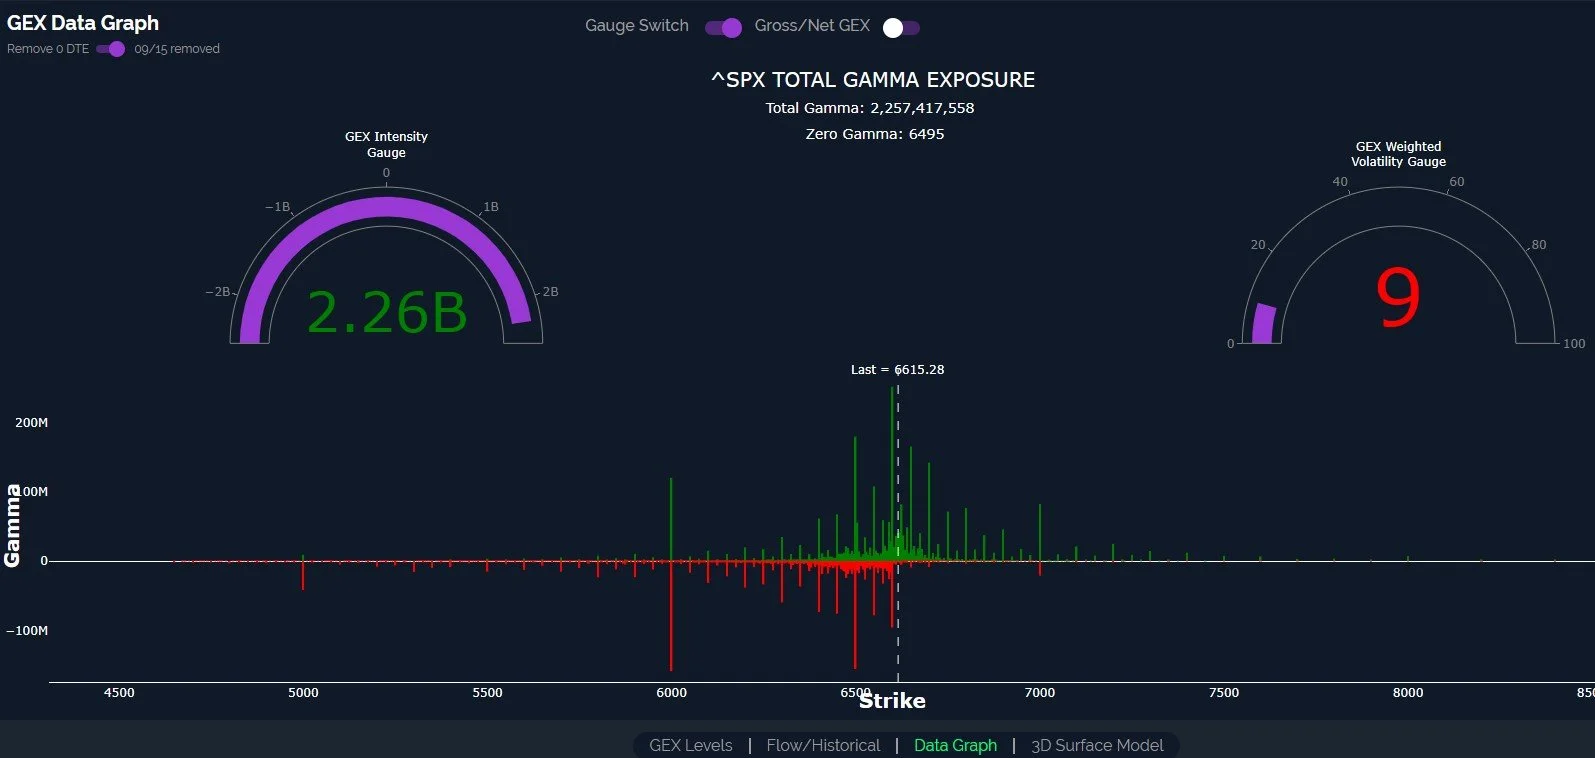
SPX shows the GEX Intensity Gauge to be virtually at an extreme, a fairly uncommon event for SPX that has done a good job of marking short-term tops. Looking at our gross GEX data graph, we see detail that helps us to recognize the importance of 6500 and 6000 in the event of a pullback.
The large positive GEX cluster at 6600 suggests that we need a loss of 6600 to tilt the odds toward those lower strikes. In the meantime, we look toward 6650-6700.
Net GEX remains tilted toward positive strikes, so further incursions into lower strikes may be buying opportunities, a theme we’ve mentioned repeatedly.
We appreciate your involvement in our discussions and we have learned a lot from our experienced traders in Discord, so thank you!
Here’s the link to our Discord server if you haven’t joined us yet! We have an active community of thoughtful and experienced traders who chime in throughout the day, and several channels dedicated to intraday and weekly trading.
You can join our discussion every day when we discuss markets in real-time via our Geeks Live livestream, currently available to all subscribing members!
If you’re interested in accessing our tools and analytics, be sure to check out our website! We have a lot of updates in the works, and we have 2 primary membership tiers that you can read more about by clicking here: All About Our Memberships
If you’re interested in learning more about our strategy and approach, we address all of these topics in our Geek University course which is included in all memberships.
We posted a YouTube video yesterday, as mentioned at the beginning of the newsletter, and we have useful and educational playlists, so give our channel a look if you’re curious about recent market commentary and ideas as well as gamma (GEX) concepts explained.
Thanks for being part of our community and know that we invite your feedback!
The information provided by Geeks of Finance LLC is for educational purposes only and is not intended to be, nor should be construed as, an offer, recommendation or solicitation to buy or sell any security or instrument or to participate in any transaction or activity. Please view our Investment Adviser Disclaimer and Risk Disclosure.