
VIX Divergences (Again): Atypical 9/11 Ahead? September 11 Stock Market Preview
PORTFOLIO MANAGER ANNUAL SUBSCRIPTION PROMO- $300 off of the annual Portfolio Manager subscription Enter code SEPTEMBER2025 at checkout! ENDS SOON!
We skipped the YouTube video tonight in favor of finishing up some web development tasks that our members have been eagerly awaiting, but if you missed yesterday’s video, you can watch it by clicking here. We Take a look at SPX, IWM, XHB, UNH, and more.
We’re approaching the release of CPI data premarket Thursday, and both the VIX and VVIX were positive today.
It’s entirely possible the move higher in the VIX is due to normal hedging leading into an important economic data point, and 9/11 is historically a bullish day for markets, but we need to take heed of some risks as well.
The 2-hour chart for the VIX shows the VIX closing above multiple resistance-turned-support levels: The middle Keltner channel, the 15-EMA, the 9-SMA, and the Hull Moving Average.
Note that the last time we saw an initial move and 2-hour close over all of those lines was the circled area at the end of August, which preceded the early September spike toward 20.
Furthermore, the VIX tested the lower weekly Hull at 14.60 and bounced perfectly, a reaction we noted seemed likely in the event of the market pushing higher (the difference is that SPX only made it just above the weekly Hull, not the big GEX cluster at 6600, leaving questions we’ll address later).
The VIX also tested the weekly 9-period SMA at 15.80, closing with an indecision candle.
Given that the VIX has held the 14-15 area all year long as support, the odds are against the VIX dropping lower. A loss of 14 on a daily closing basis may signal a larger shift occurring back to a lower VIX regime.

tradingview.com
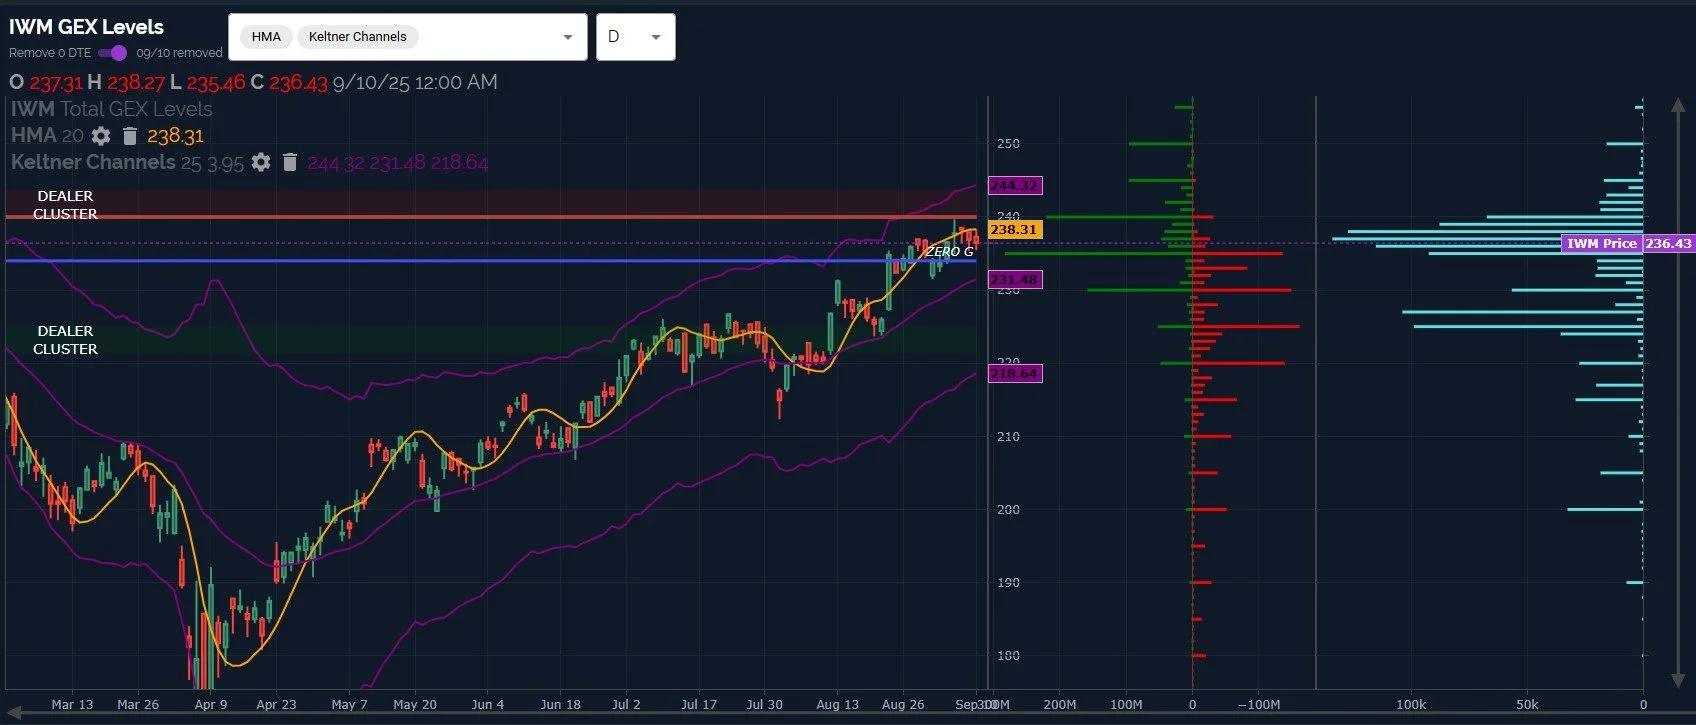
A brief look at IWM’s daily chart shows bullish ascending Keltner channels in purple, a rising Hull in yellow, and price closing below the line (though barely) for the 2nd day in a row.
The close below the line on the daily chart is close enough to be unconvincing, with CPI premarket possibly causing a large move even before the cash session begins.
Recapturing 238.31 opens the door to the positive GEX clusters at 240 and 245.
Remaining below the Hull may have negative implications for other indices as well as signaling a move toward 225-230, so we need to see what happens premarket with CPI.
It’s notable that IWM is still above the weekly Hull for the 5th week in a row..Is IWM signaling that other indices may be near a breakout above the 6-7 week streak of closing below the weekly Hull?
SPX touched weekly Hull resistance at 6552 (exceeding it slightly to 6555) and rejected, closing back below the line.
We show the absolute net GEX on the chart below to illustrate the significance of 6600, which GEX indicates is a high-probability target.
With IWM having closed above the weekly Hull for 5 weeks though showing a bearish break of the Hull on the daily chart, and SPX having closed below the weekly Hull for 7 weeks despite showing a bullish shift on the daily chart, might we see a brief SPX spike to 6600 and then a “catching down” to IWM below the daily Hull again? I know, a completely opposite question to what I asked at the end of the IWM discussion, but both questions are valid.
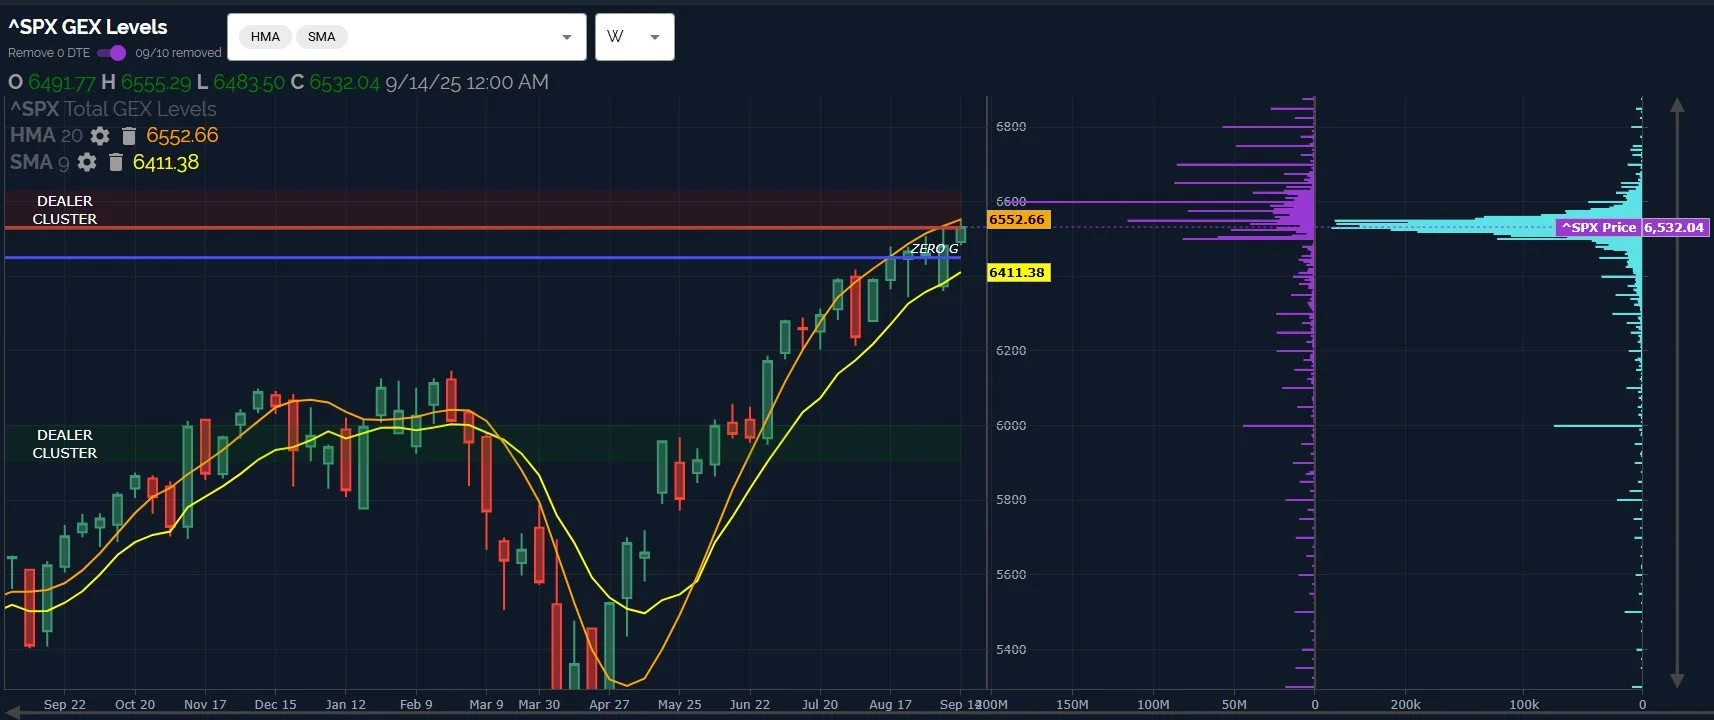
A few more points regarding SPX- the daily chart definitely lends itself toward a test of the 6600 level, also coinciding with the upper Keltner channel at 6639 (close enough).
While we don’t see a lot of net GEX at 6500 anymore, switching our chart to gross GEX reveals an interesting picture at 6500, showing a lot of positive and negative GEX at 6500, in my mind indicating the importance of the level and a possible consolidation point if we see a move to the downside..And 6500 is not too far away, either.

QQQ has many of the same factors in play as SPX, though QQQ didn’t breach the weekly Hull, it came very close and rejected. GEX diminishes after 585-590 considerably.

The bottom line (in my view) is that we need to give credit to the possibility that the test of the weekly Hull on SPX might be “it,” we might see a larger pullback.
That said, we have a daily chart indicating more bullish intentions, and GEX receives priority of assigned odds in signaling the next move, and that move would be higher.
Within the context of the “easy money” having already been made in May and June, I still reconcile the immediate discrepancy by expecting upside initially toward SPX 6600, then a fade either heading into Friday or possibly not until next week, which would be a real “fakeout” scenario..Nothing is easy at this point (in my view) until the market chooses a direction on a weekly basis.
Here’s the link to our Discord server if you haven’t joined us yet! We have an active community of thoughtful and experienced traders who chime in throughout the day, and several channels dedicated to intraday and weekly trading.
You can join our discussion every day when we discuss markets in real-time via our Geeks Live livestream, currently available to all subscribing members!
If you’re interested in accessing our tools and analytics, be sure to check out our website! We have a lot of updates in the works, and we have 2 primary membership tiers that you can read more about by clicking here: All About Our Memberships
If you’re interested in learning more about our strategy and approach, we address all of these topics in our Geek University course which is included in all memberships.
We posted a YouTube video yesterday, as mentioned at the beginning of the newsletter, and we have useful and educational playlists, so give our channel a look if you’re curious about recent market commentary and ideas as well as gamma (GEX) concepts explained.
Thanks for being part of our community and know that we invite your feedback!
The information provided by Geeks of Finance LLC is for educational purposes only and is not intended to be, nor should be construed as, an offer, recommendation or solicitation to buy or sell any security or instrument or to participate in any transaction or activity. Please view our Investment Adviser Disclaimer and Risk Disclosure.