
Signs Of Weakness..Leading Into NVDA Earnings? August 26 Market Preview
PORTFOLIO MANAGER ANNUAL SUBSCRIPTION PROMO- $300 off of the annual Portfolio Manager subscription Enter code SUMMER2025 at checkout! ENDS SOON!
Tonight’s YouTube video can be viewed by clicking here. We discuss the big picture with major indices as well as a few individual names, so check it out!
Indices are generally rejecting from the daily Hull Moving Average, which isn’t unexpected, though some skepticism of sustained downside is in order given NVDA’s earnings after the market closes on Wednesday the 27th.
Alright, so we see uncertainty this week. Let’s zoom out a bit further to see where we are overall with the VIX:
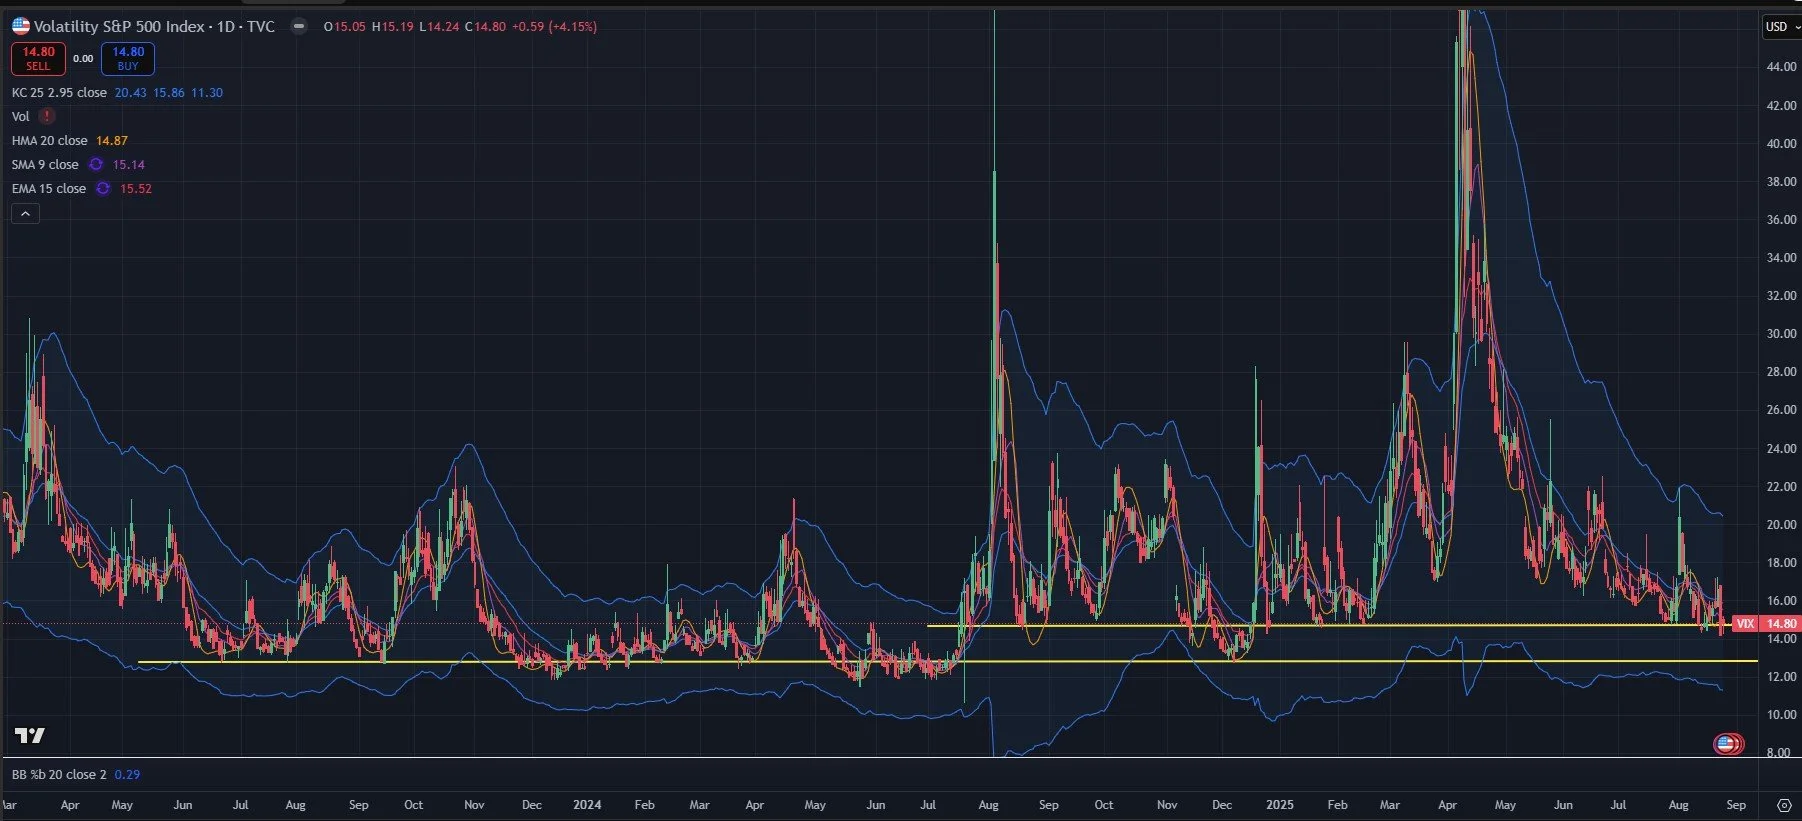
tradingview.com
The VIX chart above shows the timeframe following the post-2022 VIX lows of the Summer of 2023 until now.
Two lines denote the definitive shift in higher lows, with 12.5 and the surrounding area marking support from 2023-July 2024, then 13+ acting supportive since July 2024.
The VIX is currently testing the area that has served as support since July 2024 (note the generally more volatile nature of the VIX since then as well, as the market makes new highs).
The conservative approach going back over a year is to recognize the increased odds of the VIX rebounding from these levels, or at least consolidating here for some time before the next move, which is likely higher.
The more aggressive view would be to expect a regime shift back down toward the 12-12.5 range.
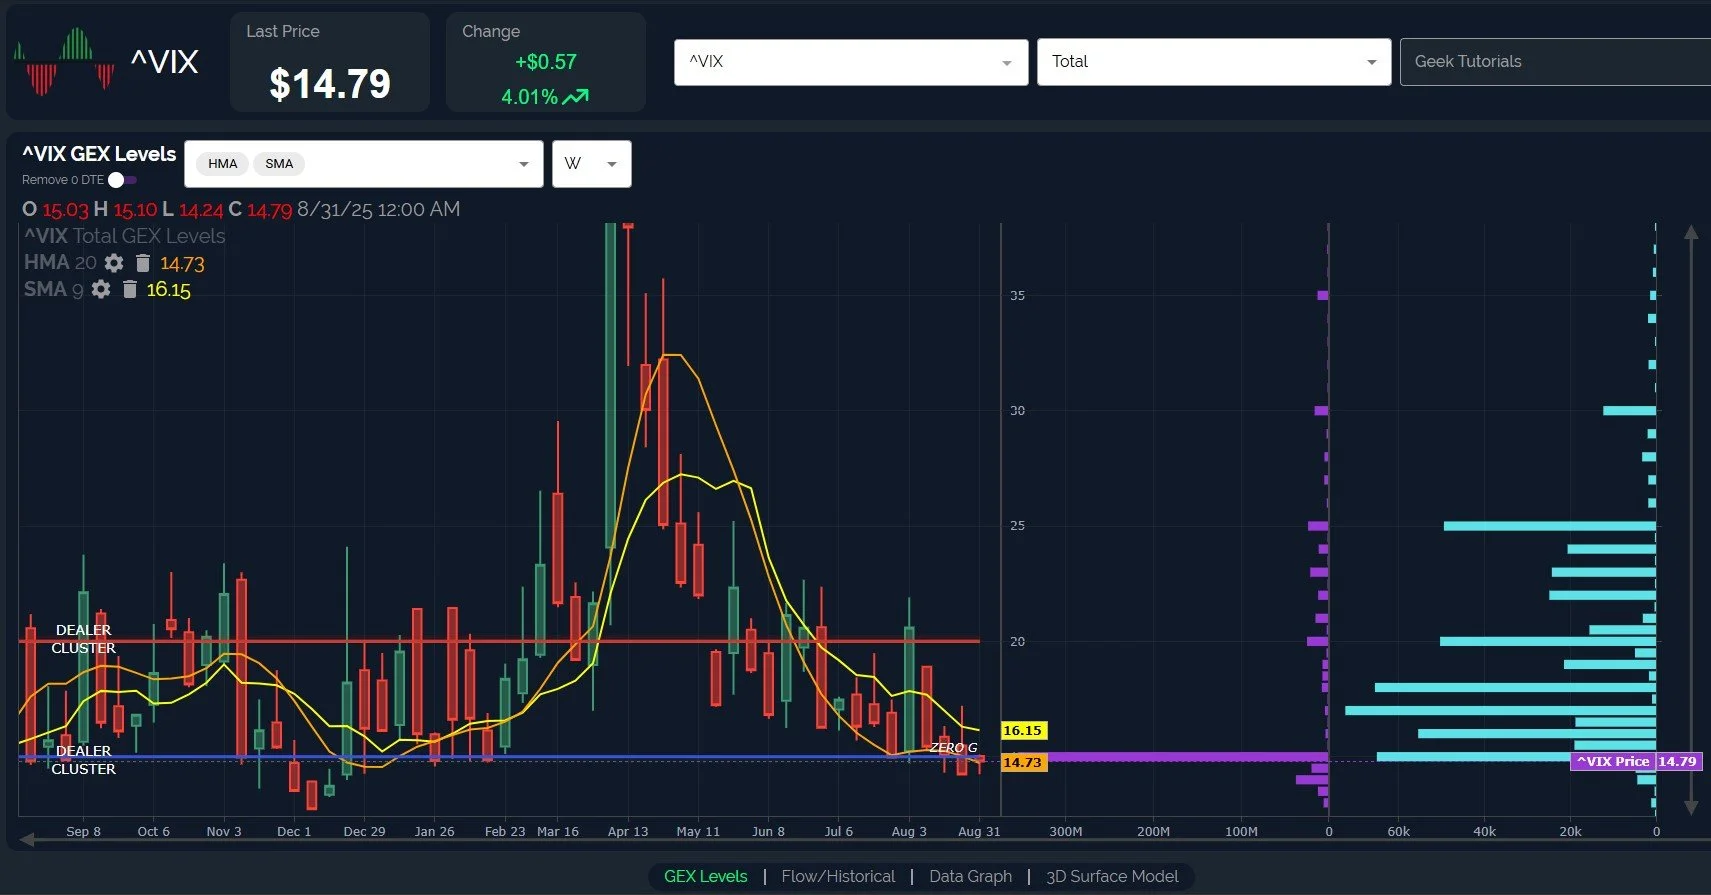
The VIX weekly chart below shows a microscopic level of GEX down to 13, but nothing below 13. Most volume today was traded at higher VIX strikes, with almost nothing traded below 14.
Technically, the VIX closed higher than the weekly Hull, reviving the long volatility signal lost with Friday’s close. closing above 16.15 may trigger a move toward 20-25, though 16.15 needs to be watched for signs of resistance.
QQQ failed at the Hull and the declining 9-period SMA, and both the Hull and the 9-SMA are several days into a shift in trend on the daily chart.
GEX gives us a mixed picture: Yes, most GEX is clustered between 550-600, but why is 550 the 2nd highest individual GEX cluster? Seems a little bearish to me, but I’ll let bulls explain this one.

That darn GEX further confusing matters- With such a big and exciting green candle Friday, while has QQQ GEX already dropped back into negative GEX territory?
Bulls are increasingly left with the obligation to become contrarian in the face of declining GEX. Don’t get me wrong, I am contrarian by nature, but the overall context of the rise since April and the lack of more than the most minor pullback needs to be taken into consideration.
Perhaps the most bullish thing between now and year-end would be a “real” correction of closer to 10% to set the stage for another blistering 3-month rally. Hey, kill it in September, that still leaves 3 months to accomplish what markets achieved from May-July, right? I’m not being sarcastic here, I’m encouraging an open-minded approach to wild markets where voting Fed members are being fired at all-time highs.

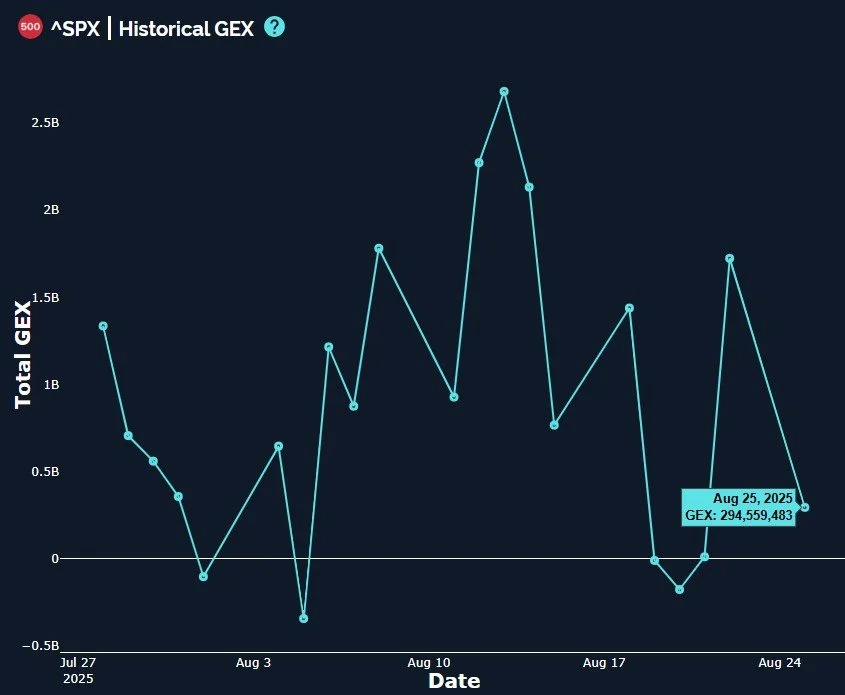
SPX still looks more bullish than QQQ as far as the net GEX position, but SPX tactically lost the daily Hull today, similar to QQQ. This doesn’t guarantee downside, but it’s a mark in favor of the bearish near-term case.

Sometimes we see divergent days where SPX sees increasing GEX as QQQ (or even SPY) GEX decreases, but today was not that day.
SPX GEX declined substantially, almost back to the zero line, well within our “neutral” range.
SPX can hold below 6450, I’ll be watching 6356 (the 9-period SMA) as a larger timeframe support area that might mark a bull/bear line going forward.
With NVDA reporting Wednesday, I’ll be treating any drop Tuesday as a possible contrarian buying opportunity, depending upon how deep a drop might go.
Daily closes lately have typically been right at key inflection points, leaving buyers and sellers wondering where the next day’s gap occurs. While today was fairly boring during the cash session, we typically get good signals from our 0 DTE GEX data, and we’ll be sure to share this data in Discord (link below). Thanks for reading and we hope this is helpful in some way!

Here’s the link to our Discord server if you haven’t joined us yet! Discord is our most active social media setting. Access is free for some channels, and new members have a 7-day trial within Discord to see how we operate. We have an active community of thoughtful and experienced traders who chime in throughout the day, and several channels dedicated to intraday and weekly trading.
You can join our discussion every day when we discuss markets in real-time via our Geeks Live livestream, currently available to all subscribing members!
If you’re interested in accessing our tools and analytics, be sure to check out our website! We have a lot of updates in the works, and we just rolled out the ability to toggle 0 DTE GEX on/off!
If you’re interested in learning more about our strategy and approach, we address all of these topics in our Geek University course which is included in all memberships.
We posted a YouTube video today, as mentioned at the beginning of the newsletter, and we have useful and educational playlists, so give our channel a look if you’re curious about recent market commentary and ideas as well as gamma (GEX) concepts explained.
Thanks for being part of our community and know that we invite your feedback!
The information provided by Geeks of Finance LLC is for educational purposes only and is not intended to be, nor should be construed as, an offer, recommendation or solicitation to buy or sell any security or instrument or to participate in any transaction or activity. Please view our Investment Adviser Disclaimer and Risk Disclosure.