
Weekly resistance Still Holding
SUMMER PORTFOLIO MANAGER ANNUAL SUBSCRIPTION PROMO- We decided to extend our offering of $300 off of the annual Portfolio Manager subscription, which includes access to our full GEX dashboard, a 5-hour Geek University course, full Discord access including trade ideas, and our daily livestream. Enter code SUMMER2025 at checkout to lock in this deal in the last remaining days!
Tonight’s YouTube video can be viewed by clicking here. You’ll notice our assessment of the major indices references different indicators than I reference in the newsletter, though these differences (combined with gamma exposure, or GEX) still lead to similar conclusions oftentimes.
Fortunately for me, the market appears to have taken a vacation at about the same time I took a vacation last Wednesday, accomplishing nothing since then (but resting…For what comes next?).
SPX’s daily chart initially shows nothing too concerning: the purple Keltner channels look bullish and pointing higher toward the 6550 upper boundary, the Hull is pointing higher with price holding above 6430, and GEX generally clustered around higher strikes, signaling the possibility that market participants are expecting higher prices.

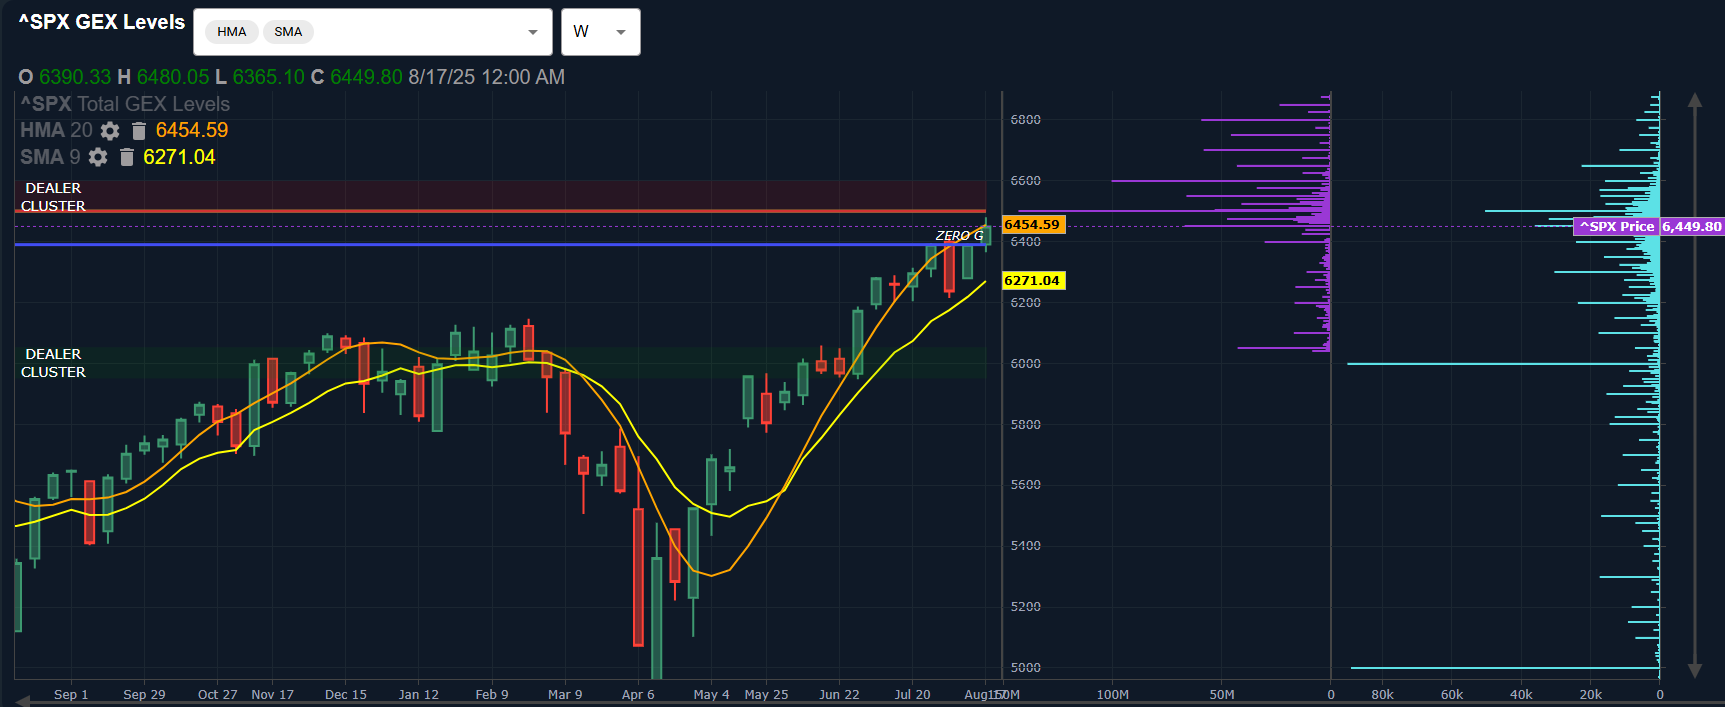
Expecting higher prices…But over what timeframe? Zooming out to the weekly chart, we see several factors that point to near-term concern.
In addition to the chart, we have GEX, which took a sharp turn lower as of Friday’s close, though still positive for SPX.
The light blue horizontal bars reflect volume from Friday, showing elevated volume at the 5000 and 6000 strikes. Participants could be active at those levels due to hedging or other factors, so I don’t view this volume as actionable, but it’s worth noting.
More pertinent is the continued failure to stay above the weekly Hull, closing just below the line Friday.
We’re still close enough to the upper Dealer Cluster zone at 6500 to see an attempt or even exceeding 6500, which would bring the upper Keltner channel on the daily chart at 6550 into focus as a possible target.
QQQ shows a possible move up to the increasingly noticeable GEX at 600, though GEX drops sharply beyond 600.
The immediate concern as we enter the first post-OpEx week and the beginning of the next OpEx cycle is the sharp drop in GEX for QQQ and the failure of QQQ at the weekly Hull.
We also see 580 remaining as the largest overhead GEX cluster, reinforcing the importance of the failure at the 577.87 Hull, given their proximity to each other.
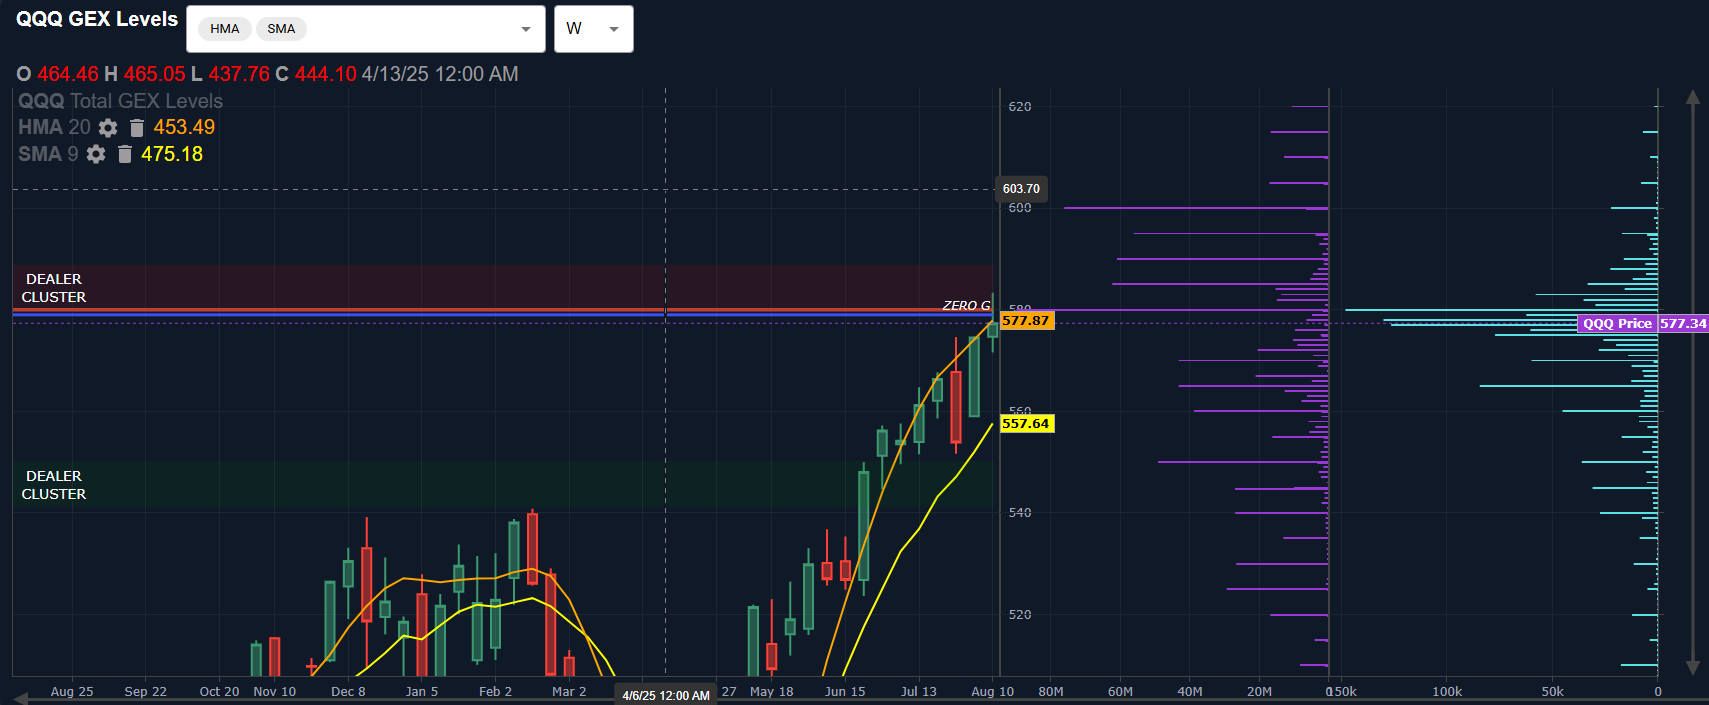
One negative divergence from SPX is the daily chart, showing QQQ closing below the daily Hull as well as the weekly Hull for the first time since August 6.
A possible drop to the lower Dealer Cluster zone at 550 would imply a retest of the early August pullback, which may end up being a good buying point for a “final” year-end rally, depending on whether or not we actually follow through to the downside in the near-term.

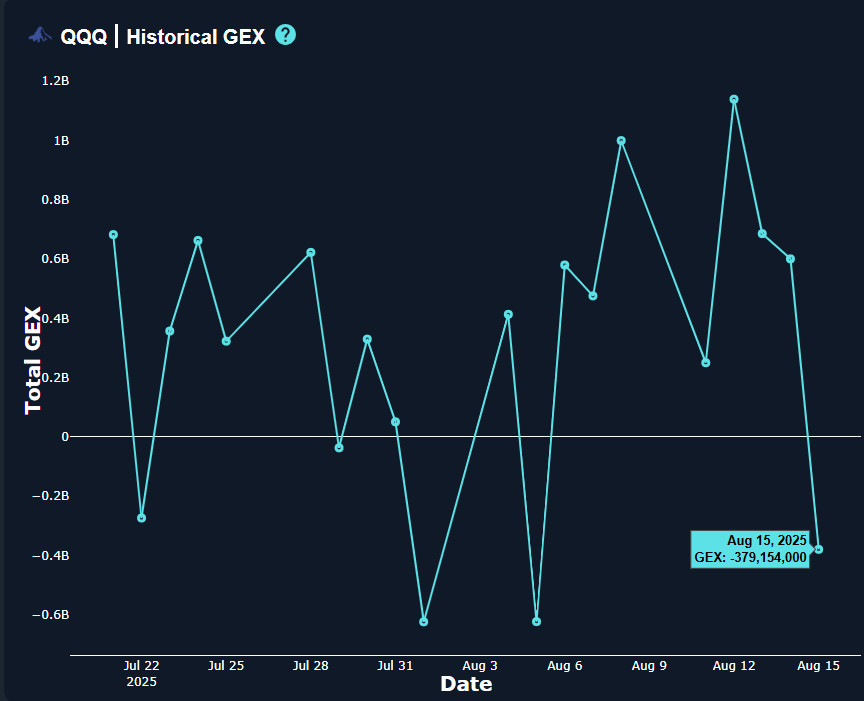
Friday’s close showed a somewhat surprising large drop in GEX, swinging from positive to negative for QQQ.
Perhaps even more surprising is the distribution along the GEX Data graph, which doesn’t show the typical huge 0 DTE GEX cluster near the closing price skewing the entire picture, but rather a relatively spread-out distribution of GEX from 500-570.
This contrasting picture to SPX may pertain to a difference between retail traders being more involved with QQQ, or it could be a canary in the coal mine given QQQ’s leading role in the bull market.
With uncertainty surrounding the current picture, and breakout or breakdown both being possible, we will continue to monitor the action around these key technical levels combined with shifts in the GEX picture,

Lastly, a quick look at the VIX shows the daily VIX is almost back on a buy signal thanks to the rapidly declining Hull Moving Average, with 15.24 being the line of demarcation. The 4-hour chart shows the VIX already on a buy signal, with important support in the 14.6 area to keep the VIX spike/market pullback scenario alive.

Indices took an overall turn toward the negative Friday in terms of GEX, so stay tuned as we watch for initial changes Monday. We’ll seek to react to data with 0 DTE and weekly trades as quickly as we see actionable data tomorrow, so we hope you’ll join our conversation in Discord.
Here’s the link to our Discord server if you haven’t joined us yet! Discord is our most active social media setting. Access is free for some channels, and new members have a 7-day trial within Discord to see how we operate. We have an active community of thoughtful and experienced traders who chime in throughout the day, and several channels dedicated to intraday and weekly trading.
If you’re interested in accessing our tools and analytics, be sure to check out our website! Mobile updates are now live for a better mobile experience and both subscription tiers have access to our full list of tickers!
If you’re interested in learning more about our strategy and approach, we address all of these topics in our Geek University course which is included in all memberships.
We posted a YouTube video today, as mentioned at the beginning of the newsletter, and we have useful and educational playlists, so give our channel a look if you’re curious about recent market commentary and ideas as well as gamma (GEX) concepts explained.
Thanks for being part of our community and know that we invite your feedback!
The information provided by Geeks of Finance LLC is for educational purposes only and is not intended to be, nor should be construed as, an offer, recommendation or solicitation to buy or sell any security or instrument or to participate in any transaction or activity. Please view our Investment Adviser Disclaimer and Risk Disclosure.