
VIX On The Verge: Fakeout Or Breakout?
Indices started OpEx week red, though none of the U.S. indices have broken any levels that we would consider pivotal in flipping to a more bearish stance. The VIX did close right at the key level that I believe could trigger a quick move up to 19-20, but SPX GEX is still pointing toward favorable odds of a retest of highs, as long as the 7477 area holds. With monthly OpEx happening Friday, it’s hard to have confidence in sustained downside, but we’re tactically flexible in the event that we see daily closes below 700 QQQ and 7450 SPX, with the VIX holding above 17. We await more information Tuesday morning as the 0 DTE picture unfolds.
Members save $300 on the annual Portfolio Manager plan with code SUMMER26 at checkout, which will run a few more days.
The VIX Is On The Precipice Of A Move Toward 20, Barring Immediate Rejection
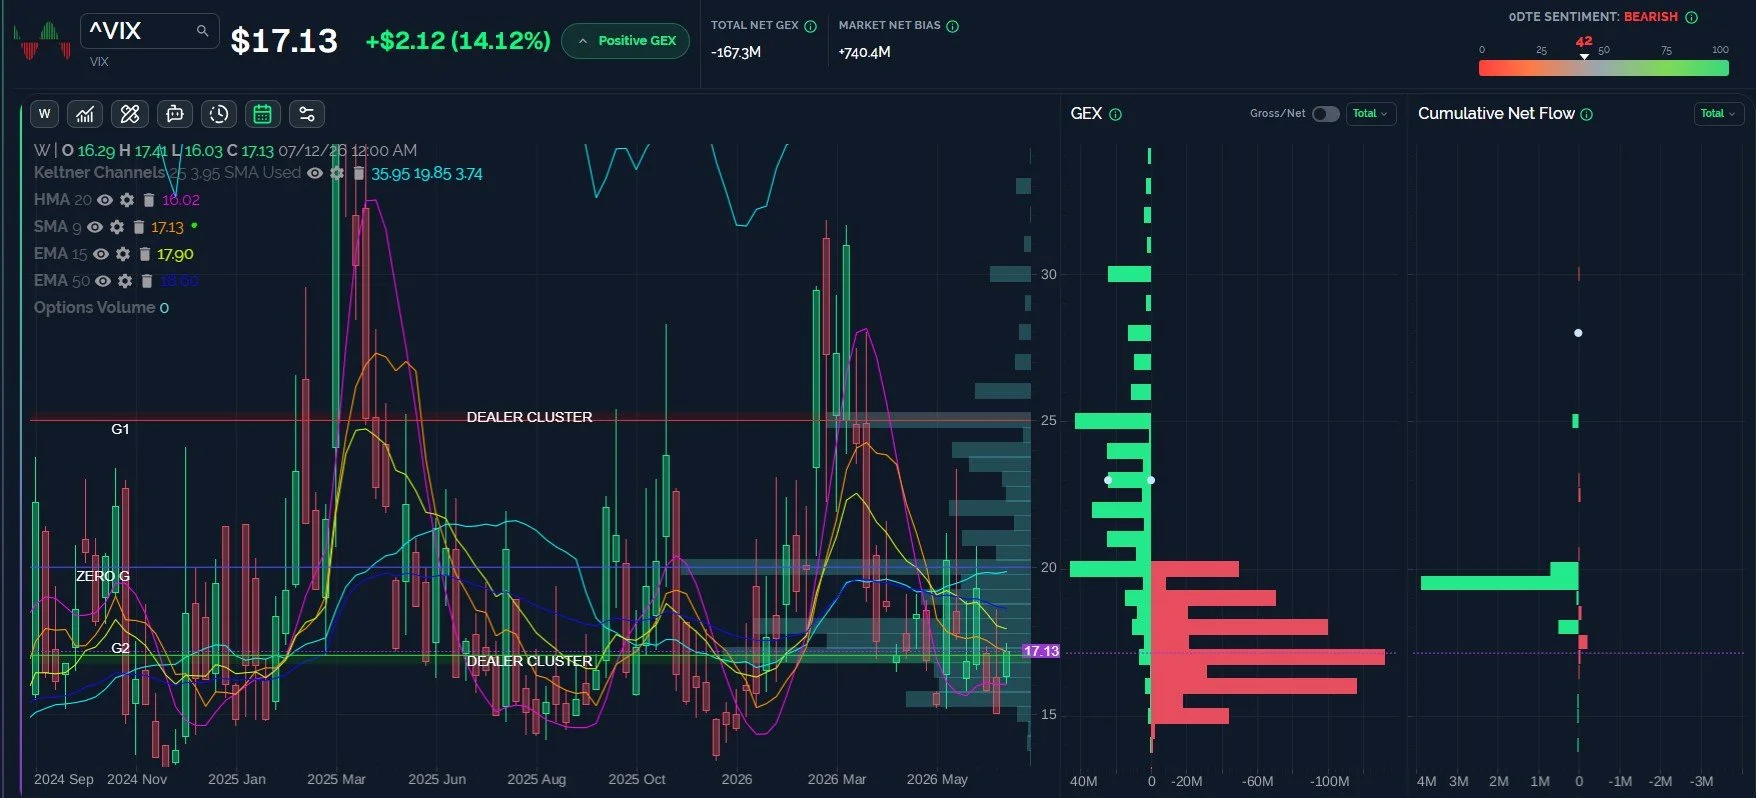
VIX monthly options expire Wednesday, July 22nd, and we see the largest net negative GEX clusters with that expiry at the 16 and 16.5 strikes, while the largest positive clusters are at 20 and 25. The potential range is quite large, but we expect this range to narrow as we approach the 22nd. Technically, we see the VIX closed at the weekly 9 SMA, so a setup exists in coming days to approach the 20 strike if we see the VIX maintain above 17. Our Cumulative Net Flow indicator shows notable positive net option activity at the 19.5 strike today as well. With 15 being tested Friday, it isn’t surprising to see a test of upside resistance, but the burden is still with volatility bulls to prove that a test of 20 is anything more than another buying opportunity for SPX before heading toward 7600. We’ll see.
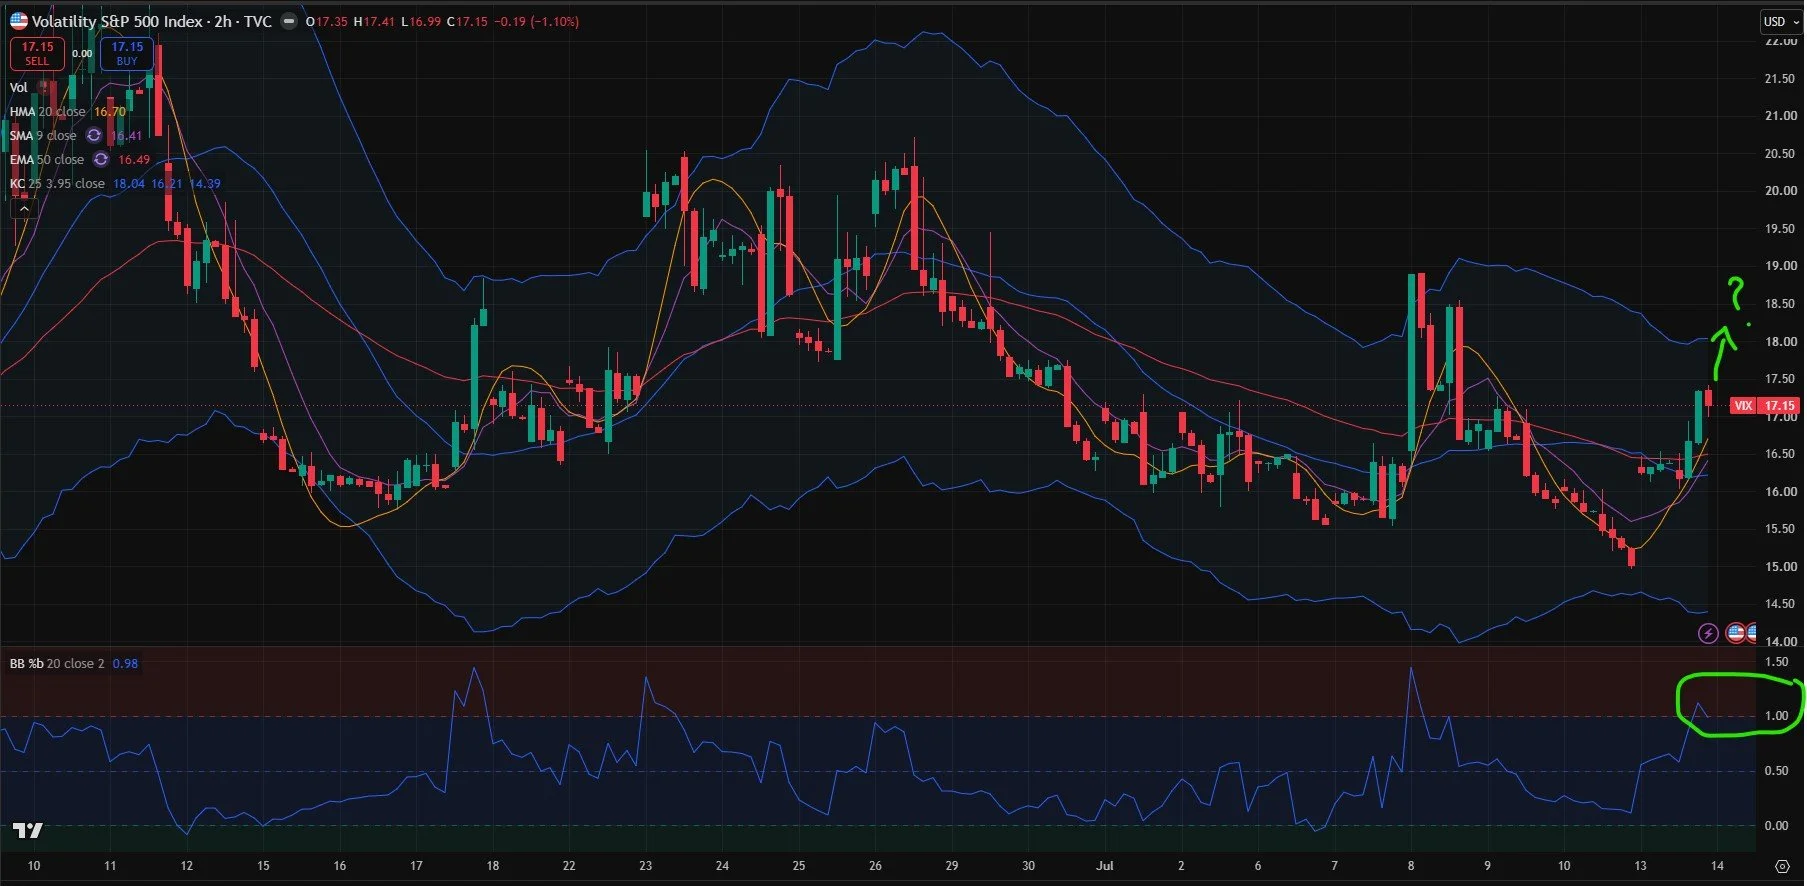
Shorter Term VIX Signals May Be Encouraging For SPX Bulls
Two indicator readings may be helpful to bulls: The %b (20,2) indicator is over 1.00 on the 2-hour chart, which isn’t an exact measurement in time of a top, but generally marks tops within a few bars. Secondly, the Keltners still look neutral as the HMA careens toward the top channel, potentially adding to the overbought %b reading. One positive potential implication is that the VIX could reverse lower after reaching the 18-20 area, though uncertainty exists considering the tendency of VIX spikes to be brief in time, yet potentially reaching much higher strikes than what appears justified by logic.
Key Levels: Bullish (for volatility) above 17 targeting 18.5-20. Bearish below 16.7 targeting 14.5-15.
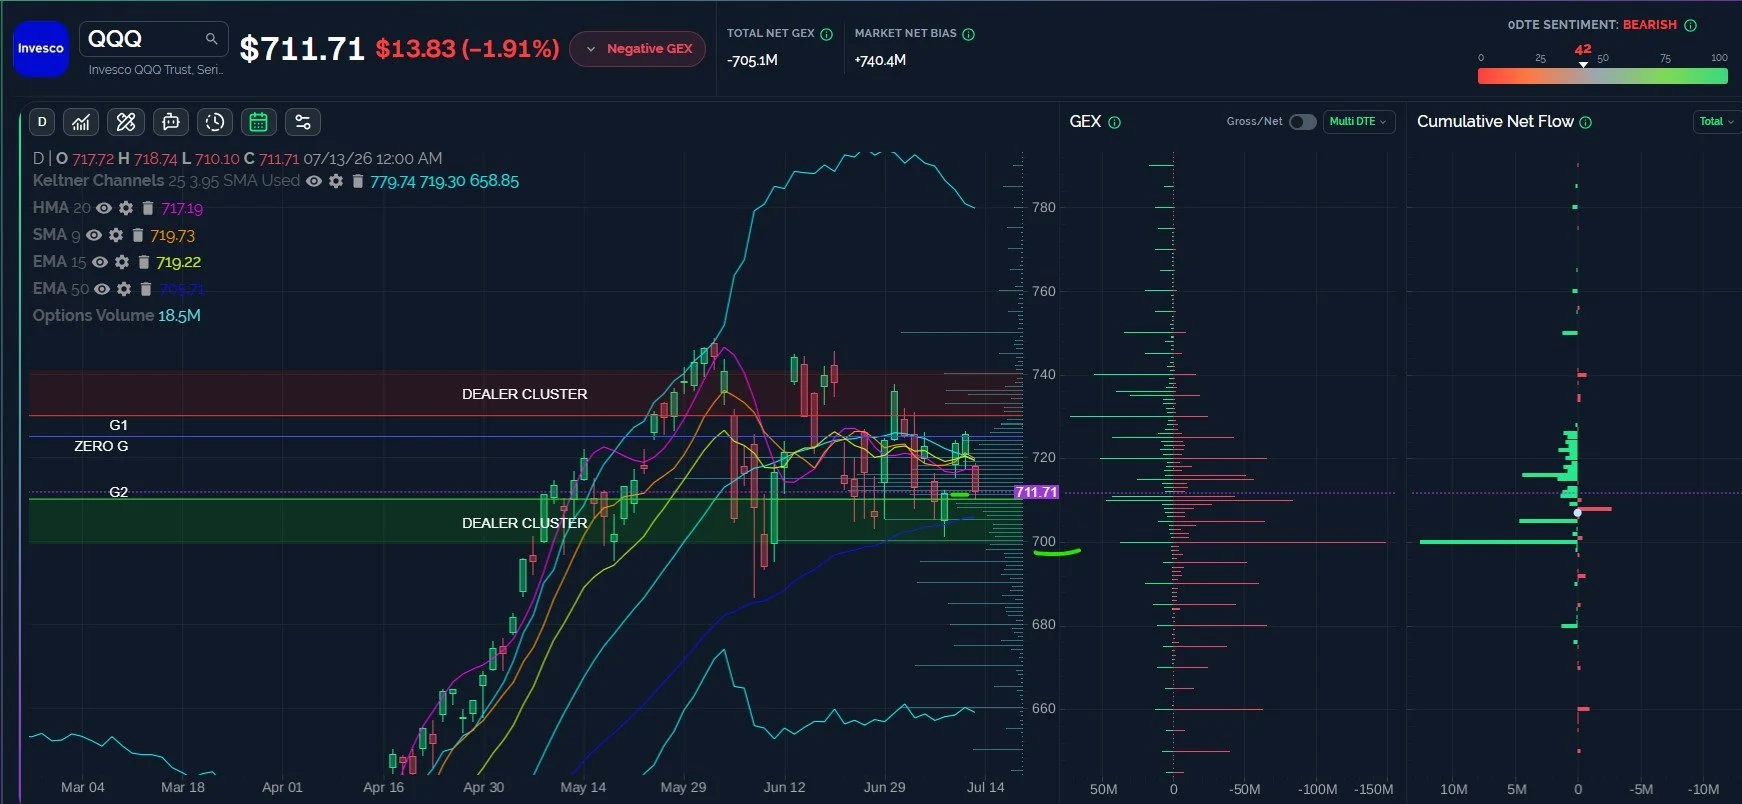
QQQ Fills July 9 Gap, Risk Still Exists Back To 700
QQQ shows a lot of GEX betweent 700 and 720, and this “congestion” may end up being bullish, as long as QQQ can remain above 700. The large net negative cluster at 700 represents the lower Dealer Cluster, where we believe dealers may flip to buying, and you can see the big positive Cumulative Net Flow at that strike, potentially indicating eagerness by participants to sell puts and/or buy calls at that strike. Note that Friday the CNF showed a big negative reading at 730 (highlighted in Monday morning’s newsletter) and Monday was down. Does that mean Tuesday is positive? Last I checked, a sample size of one doesn’t present a strong argument, but we can try to make those with confirmation bias feel better until a larger sample size appears (kidding but not kidding?). The OCD (Obsessive-Compulsive Disorder, or as I call it, OCA for Advantage) traders may appreciate the gap fill back to July 9. Check that box off of your list, and watch out for that crack in the sidewalk tomorrow.
Key Levels: Bullish above 720 potentially targeting 730, then 740. A loss of 710 may see 700 revisited, bearish below 700.
SPX Still May See 7600-7620 Soon
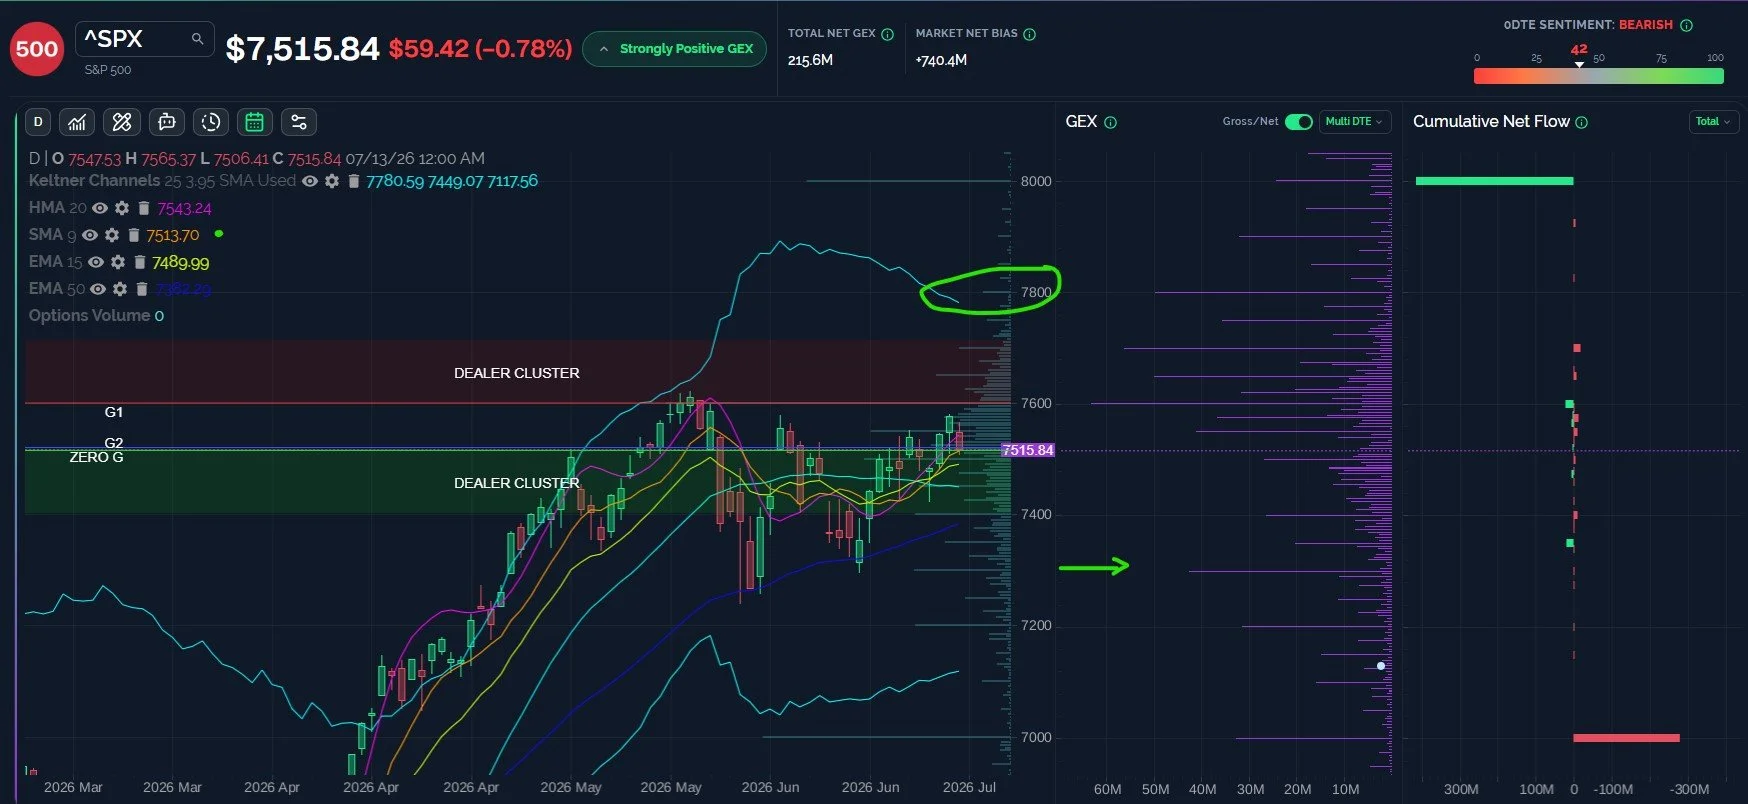
SPX has been holding up relative to the same indicators on the weekly chart quite well, holding above the 9 SMA at 7477. While GEX at 7500 warrants attention as a potential pivot given its sheer relative size to every strike except 7000 and 8000, I view the 9 SMA as the next important area below 7500, giving us a range of 7477-7500 that may be a battleground. A weekly close below 7477 may target 7300. Let’s look at the daily chart with net GEX shown before outlining some key levels.
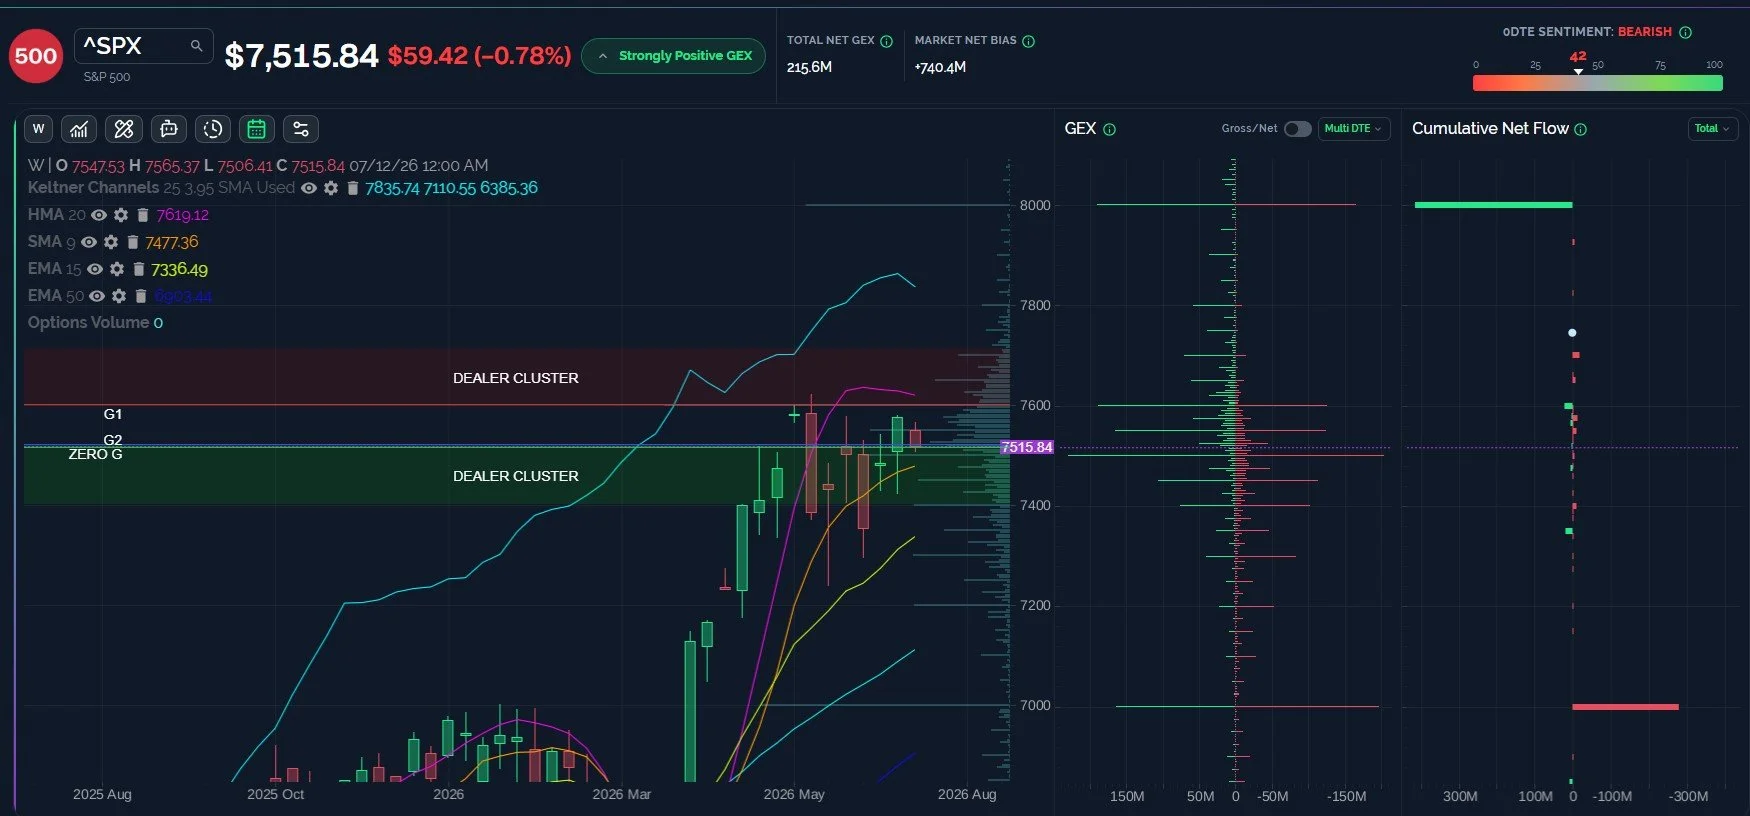
SPX GEX Is Still Skewed Positively Toward 7800
While I am not expecting 7800 anytime soon, the GEX picture does indicate a large net positive GEX cluster at that level, aligning fairly closely with the top Keltner channel on both the daily and weekly charts. The confluence of those two timeframes does raise my interest in 7800 as the year goes on, but the first big resistance area to contend with is at the previous high near 7600. The weekly HMA at 7619 may be another target to watch, but as of now, I am not certain regarding the most immediate destination. With the VIX barely above 17 and defensive stocks in the dumps, SPX may be due for rotation and a pullback to 7300, then tackling 7600. Can all of this happen in a week? Sure, it’s OpEx week, and the market has traded like a leveraged casino since 2020 especially. But in the end, we will take our cues from the intraday action and shifts that occur during that time, starting with Tuesday.
Key Levels: Bullish above 7541 targeting 7600. Bearish below 7477 targeting 7300-7330.
Join The discussion
We hope you will join us in Discord this week, where we share at least some observations every day for free.
Our YouTube video tonight covers SPX, the VIX, PANW, GLD, and SHOP, so check it out! Tonight’s video and prior videos can be viewed by clicking Community at the top of our homepage to find our YouTube channel link.
Non-subscribers can join through Community on our homepage. First-time guests get a free 7-day trial of the premium Discord channels, where we talk through what is happening in real time.
Join our livestream by clicking the link on our homepage every day around 10:30am ET, and you can replay the most recent one any time before the next one begins.
Thanks for being part of our community and know that we invite and appreciate your feedback!
The information provided by Geeks of Finance LLC is for educational purposes only and is not intended to be, nor should be construed as, an offer, recommendation or solicitation to buy or sell any security or instrument or to participate in any transaction or activity. Please view our Investment Adviser Disclaimer and Risk Disclosure.
