
SPX Targeting All-Time Highs
Friday saw a mixed bag in terms of where and how indices closed, with SPX looking the most bullish, appearing to be near a point of making a new high, while QQQ is still toward the middle of its consolidation range. IWM was lower Friday, a divergent negative worth noting, though IWM still maintains above the key 290 support area. The VIX is approaching a contrarian low at 15, warranting attention in case we see a quick reversal after incremental further downside in volatility.
Members save a special $375 on the annual Portfolio Manager plan with code FREEDOM26 at checkout, which will run a few more days.
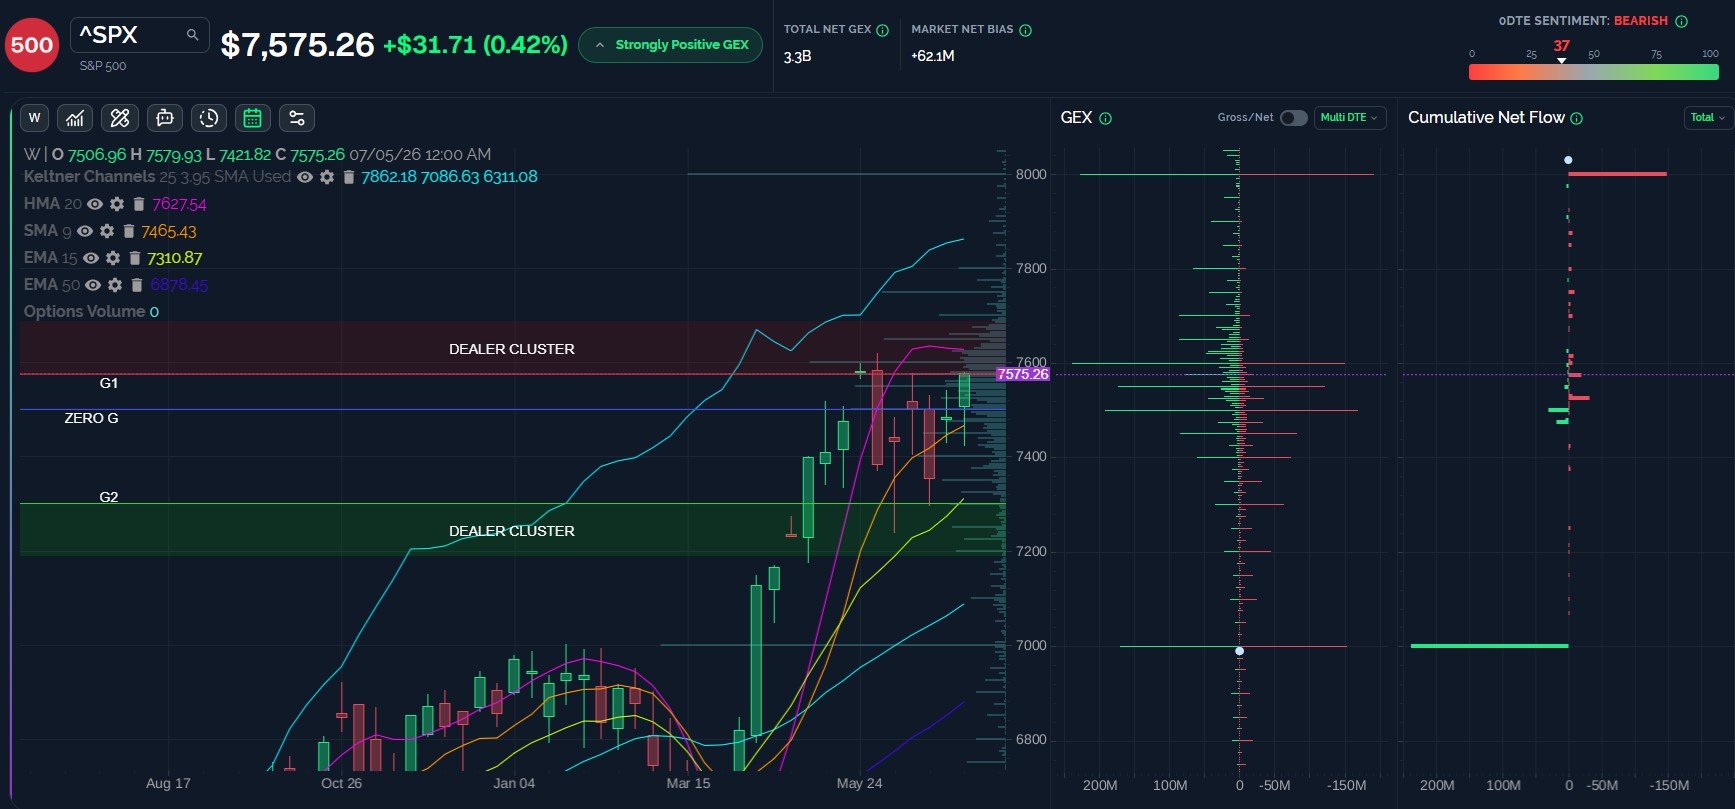
SPX GEX And Momentum Suggest 7600-7630 As A Target
Let’s start with the big picture: Net GEX shows the largest clusters at 7600, 7700, and 7800, so GEX is skewed toward further upside. Within that context, the market rarely arrives at a destination in a straight line (well, I guess March through May fits the “rare” category), so we’re dealing with navigating potential zigs and zags along the pathway to a higher target at some point in the future. Looking at SPX now, we may see the first of those 3 levels reached in the short term, but coinciding factors are stacking that may indicate some downside is in store after a tag of 7600-7630.
The gross GEX picture shows a huge amount of GEX at 7600 relative to all strikes except 7000 and 8000, and the declining weekly HMA at 7627.54 represents another target in proximity to 7600 that may signal a reversal between 7600-7630. On a net basis, GEX indicates capturing 7600 with a daily close above 7630 raises the odds of a tag of 7700-7800. Failure may occur if we see a daily close below 7521, targeting 7465.
Key Levels: Bullish above 7550 targeting 7600-7630. Bearish below 7545 targeting 7521, then 7465.
QQQ Isn’t As Close TO All-Time Highs, Opportunity Or Warning?
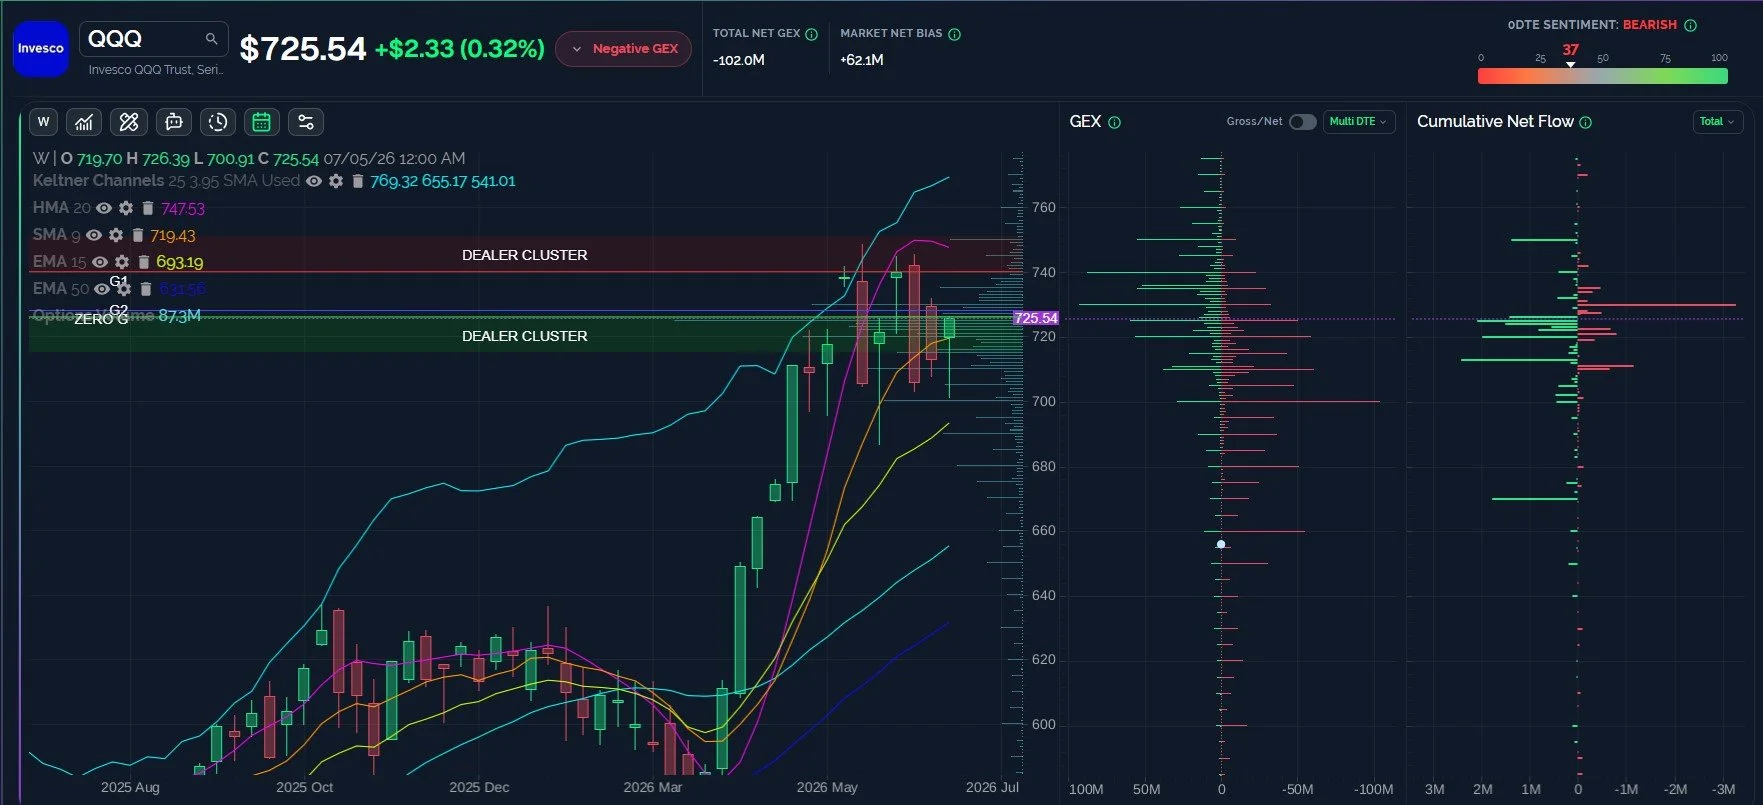
QQQ printed a nice weekly candle last week, with a long tail and a close above the 9 SMA. Semiconductors have certainly been a drag as of late, but the Magnificent Seven (alongside software) have helped to steady the ship. Will Mag 7 continue to rebound, maybe even alongside semiconductors? A bullish possibility certainly exists that would see broad participation to new highs. More conservatively, even if semis fail to regain prior glory, perhaps other tech names can allow QQQ to follow SPX to new highs. We’re still dealing with the question of timing, and the negative Cumulative Net Flow shown on our chart to the far right suggests selling at the 730 strike as of Friday. We might need to wait for a bounce toward 730 to confirm whether or not 730 will be a big resistance area or if QQQ can continue toward the upper Dealer Cluster zone at 740. With futures showing weakness at the moment, it’s possible that Friday’s bearish action at 730 is already being fulfilled.
Key Levels: Bullish above 730 targeting 740, bearish below 720 targeting 700.
META Might Reach 700-750, Unless The Future Looks Like The Past
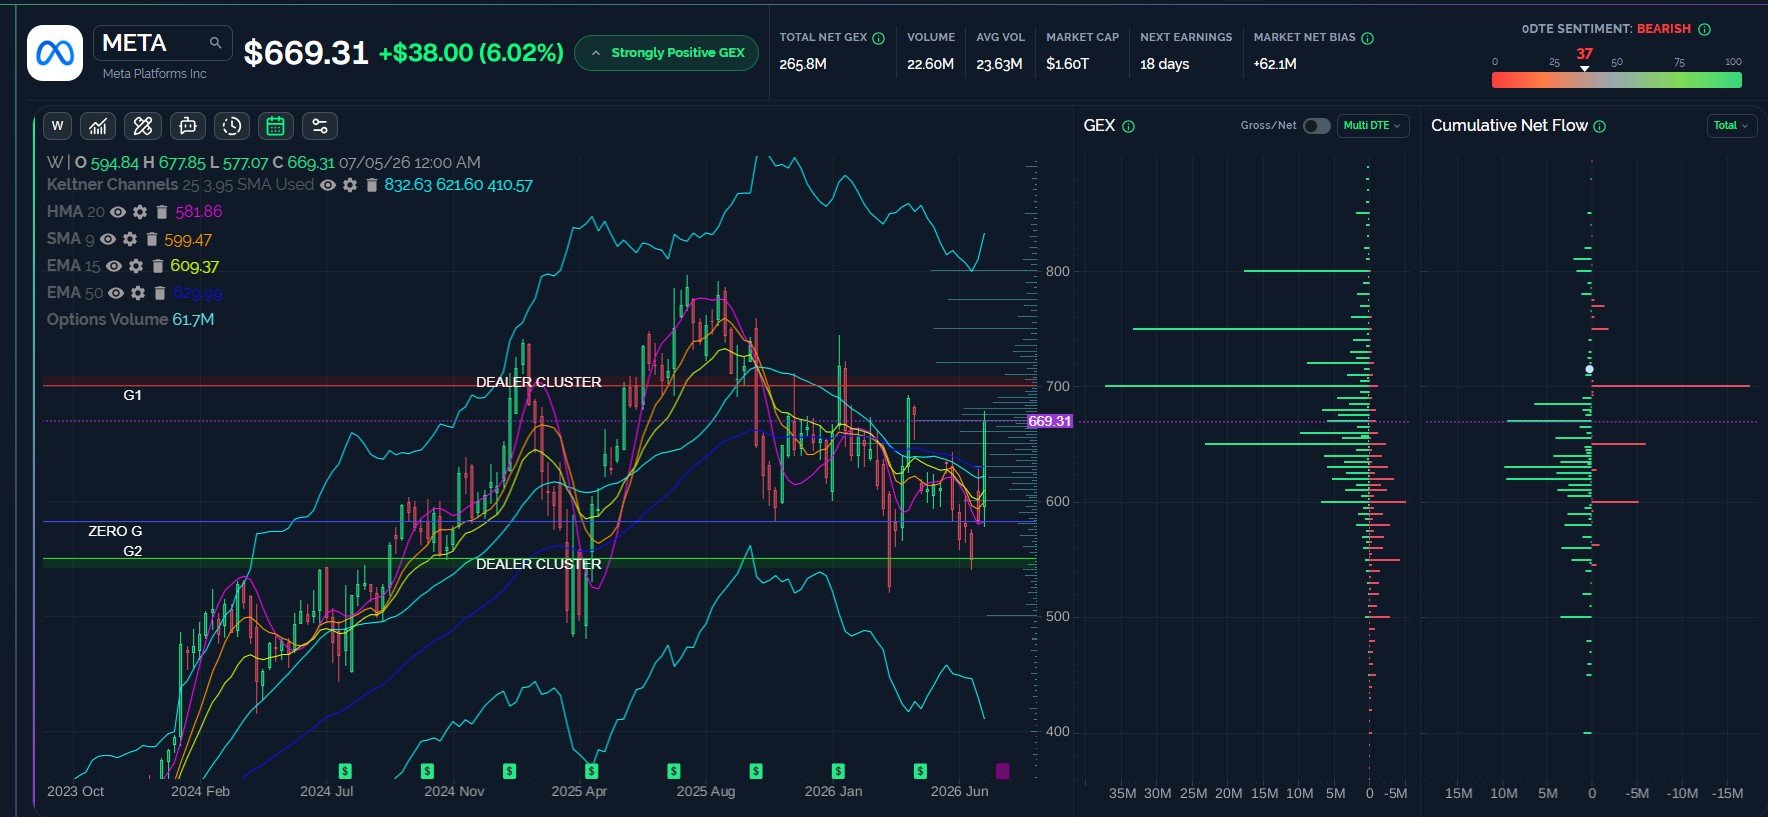
Looking at the last 3 weekly candles that were big and green, you see that META has marked tops with such action. META technically cleared the downtrend line with Friday’s close, but not by much, just enough to leave breakout bulls second-guessing themselves. Big negative Cumulative Net Flow at 700 shows options activity from Friday biased against a move beyond that strike. But the situation is not that clean, with GEX clearly biased toward higher levels, in fact, all the way up to the 800 strike. Capturing 700 and closing above the line with a daily close raises the odds of 750 in our view, then 800. We may see retracement to 650 first, representing an important test of a key GEX level, with 600 below that. META doesn’t look bearish until a loss of 580, so traders likely need to be prepared for big volatility in both directions regardless of whether “this rally is different” or not.
Key Levels: Bullish above 700 potentially targeting 750, then 800. A loss of 650 may see 600 revisited. Bearish below 580.
The VIX Is Getting Too Low For COmfort (From A Contrarian Perspective)
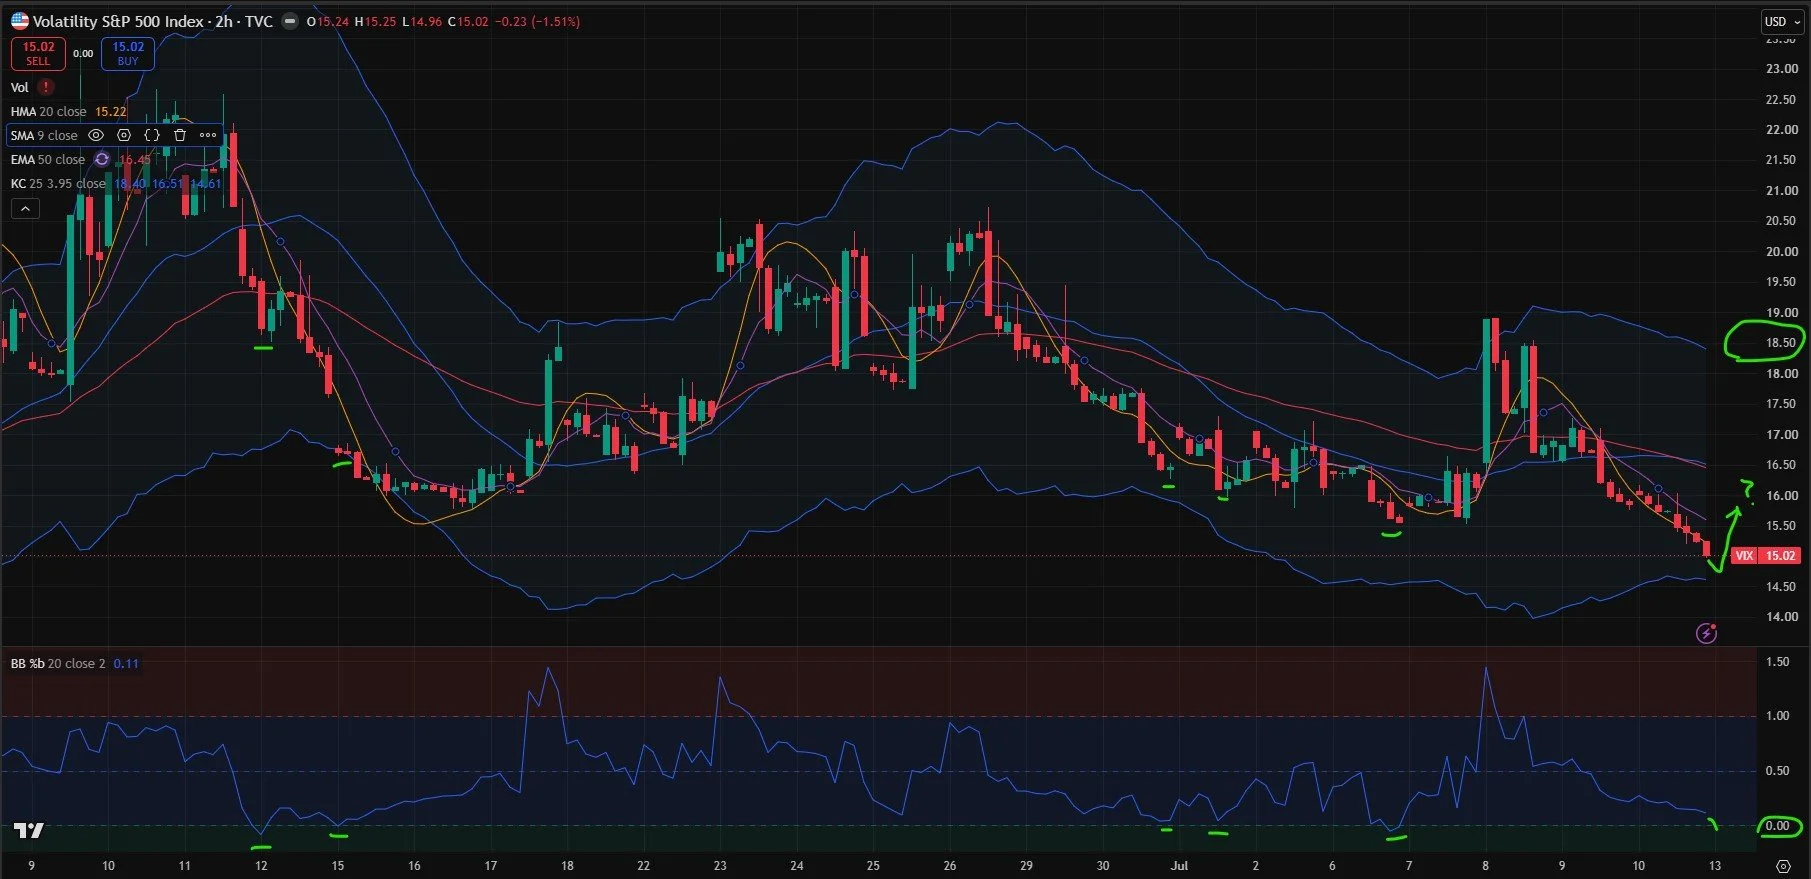
The VIX is now approaching the lower Keltner on the 2-hour chart, with the HMA almost to the same lower Keltner, and the %b (20,2) is almost to zero. This combination is likely a headwind for market bulls as the VIX typically bounces from such conditions, as evident by prior underlined readings. Some exceptions exist, though VIX downside was still limited in such occasions and VIX rebounds still occurred within several 2-hour bars (typically within 1-2 days). I’m watching the upper Keltner channel at 18.50 for resistance, matching fairly well with the daily chart and the GEX picture, too. Any move beyond 18.5 is likely a momentum move that could reach 20-25, but even considering 18.5 requires the VIX to overtake 17.
Key Levels: Bullish above 17 targeting 20. Bearish below 15 with downside to 14.3.
Join The discussion
We hope you will join us in Discord this week, where we share at least some observations every day for free.
Our YouTube video tonight covers SPX, the VIX, AMD, MU, and META, so check it out! Tonight’s video and prior videos can be viewed by clicking Community at the top of our homepage to find our YouTube channel link.
Non-subscribers can join through Community on our homepage. First-time guests get a free 7-day trial of the premium Discord channels, where we talk through what is happening in real time.
Join our livestream by clicking the link on our homepage every day around 10:30am ET, and you can replay the most recent one any time before the next one begins.
Thanks for being part of our community and know that we invite and appreciate your feedback!
The information provided by Geeks of Finance LLC is for educational purposes only and is not intended to be, nor should be construed as, an offer, recommendation or solicitation to buy or sell any security or instrument or to participate in any transaction or activity. Please view our Investment Adviser Disclaimer and Risk Disclosure.
