
QQQ Wearing Down Both Sides
The back and forth continues for indices, with “Turnaround Tuesday” living up to its reputation as indices rallied. SPX, QQQ, and IWM are still within the consolidation range we’ve been watching for over a month, but QQQ did close above daily indicators that lean bullish. The VIX has rejected the first test of 17, and today’s drop in volatility brough the VIX to an important decision point that may determine whether or not we see 15.5 or 18 next for the VIX. Resolution toward 15.5 may accompany SPX achieving a new high.
Members save $300 on the annual Portfolio Manager plan with code SUMMER26 at checkout, which will run a few more days.
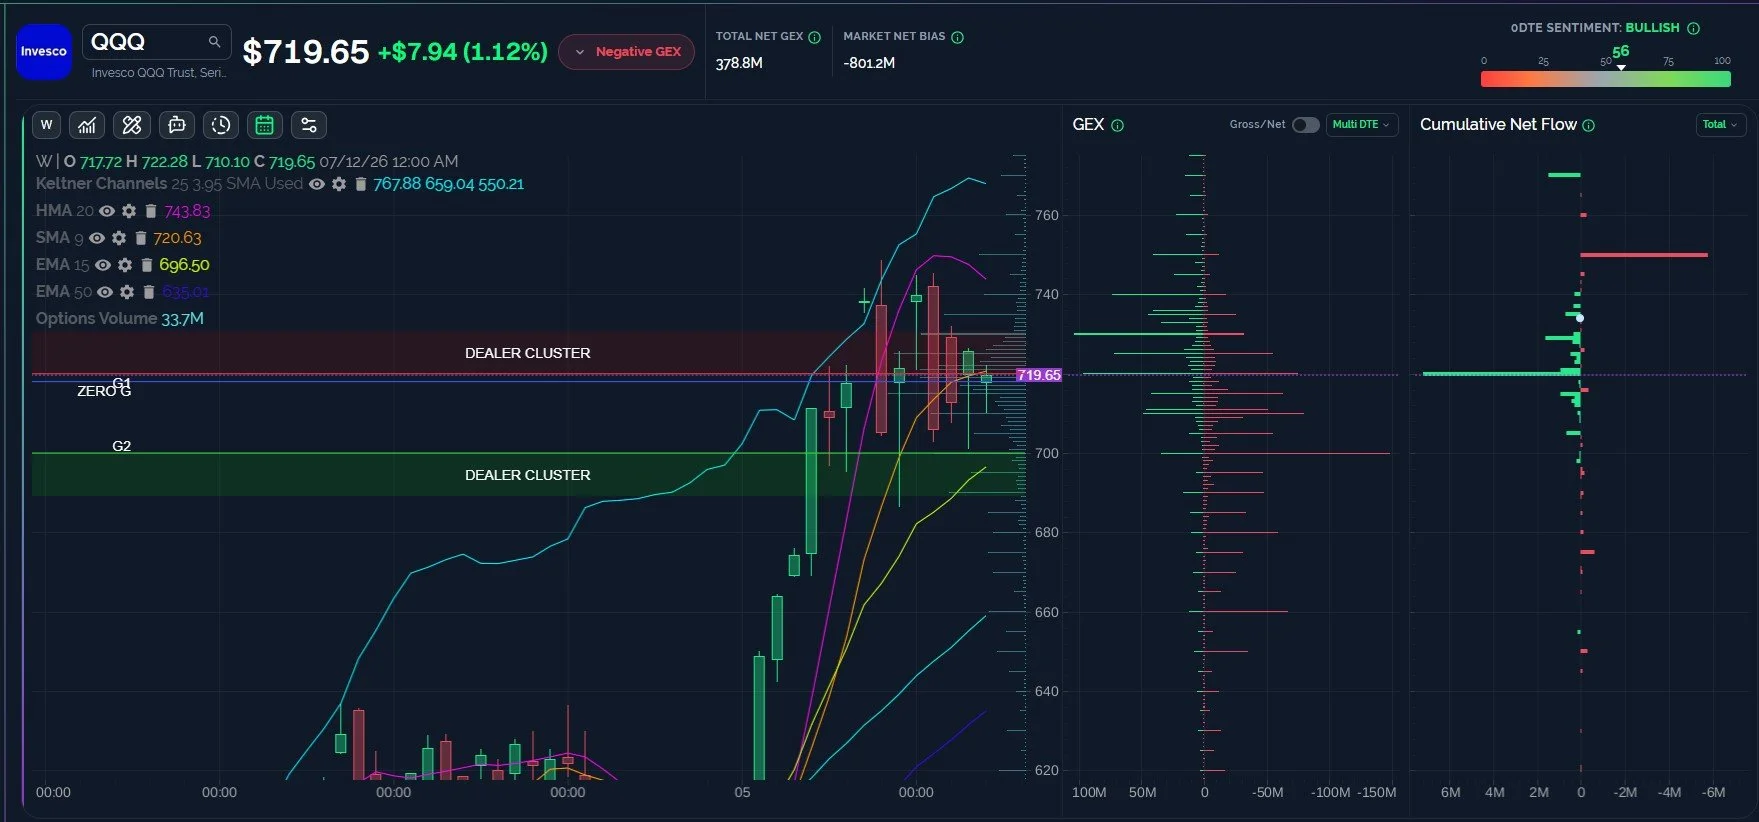
QQQ Still Under The Weekly 9 SMA
QQQ’s weekly chart shows QQQ closing today just below the 9 SMA at 720.63, also at the doorstep of the important GEX cluster we see at 720. On the surface, being below the 9 SMA appears cautionary, but QQQ continues to hold above the key 700 strike with a bullish weekly candle last week. Let’s look at the daily chart for potential additional clues as to whether or not QQQ might be ready to attempt further upside.
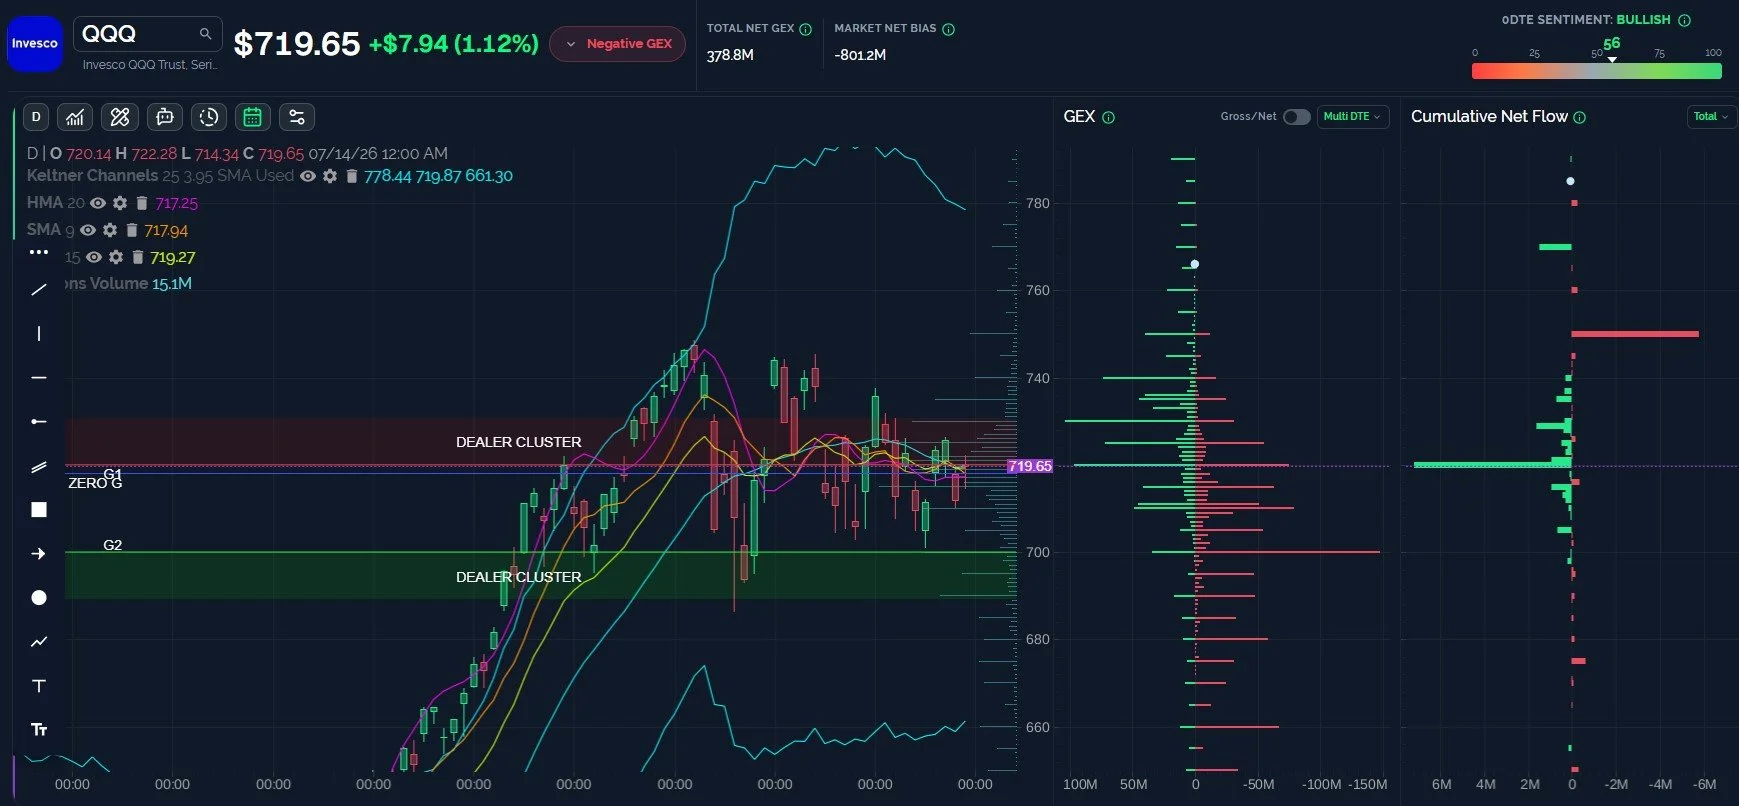
QQQ Daily Chart Suggests Potential For A Rally
While QQQ remains below weekly resistance, the daily chart shows at least speculative potential for a turn higher from here, based on today’s close above the 15 EMA, the 9 SMA, and the HMA. While QQQ closed just under 720, our new Cumulative Net Flow feature shows the greatest option activity today at the 720 strike, and it was positive flow at that (call buying and/or put selling, to share a couple of examples). We see negative flow at 750, but based on the declining weekly HMA at 743, I would preliminarily expect a rally to reach 730-740 to make a lower high, even as SPX makes a new high (blame SMH, I guess).
Key Levels: Bullish above 720 targeting 730, 740. Bearish below 715 targeting 700, then 690.
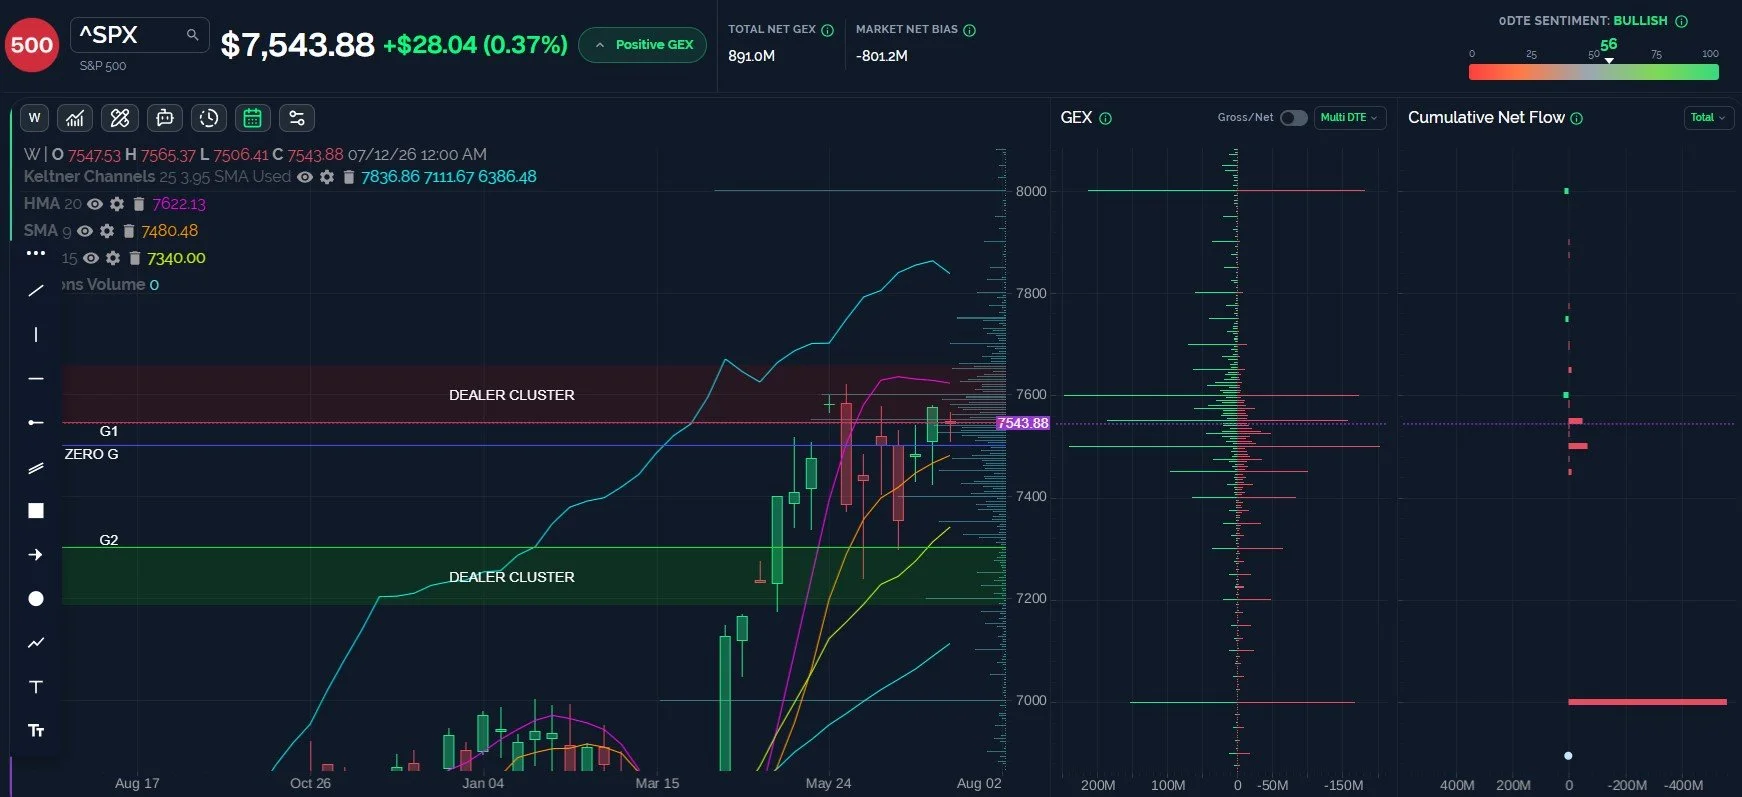
SPX: Broken Record Say 7600 Might Come soon
SPX has one of the tightest consolidations going on, with this week’s candle looking like a doji so far. The tight range may be close to breaking out in one direction or another, and what better week than OpEx, right? The risk I am wary of is the risk of a marginally higher high (perhaps the weekly HMA at 7622 or just above?) followed by a move toward 7300. This isn’t the only potential pathway, but it’s one that I have on my list of possibilities, particularly with the VIX not far off of 15-16. Ultimately, until SPX loses 7480, 7300 is off the table, so we continue navigating what’s in front of us.
Key Levels: Bullish above 7550 targeting 7600, 7622. Bearish below 7500 (especially 7480) targeting 7400, 7300.
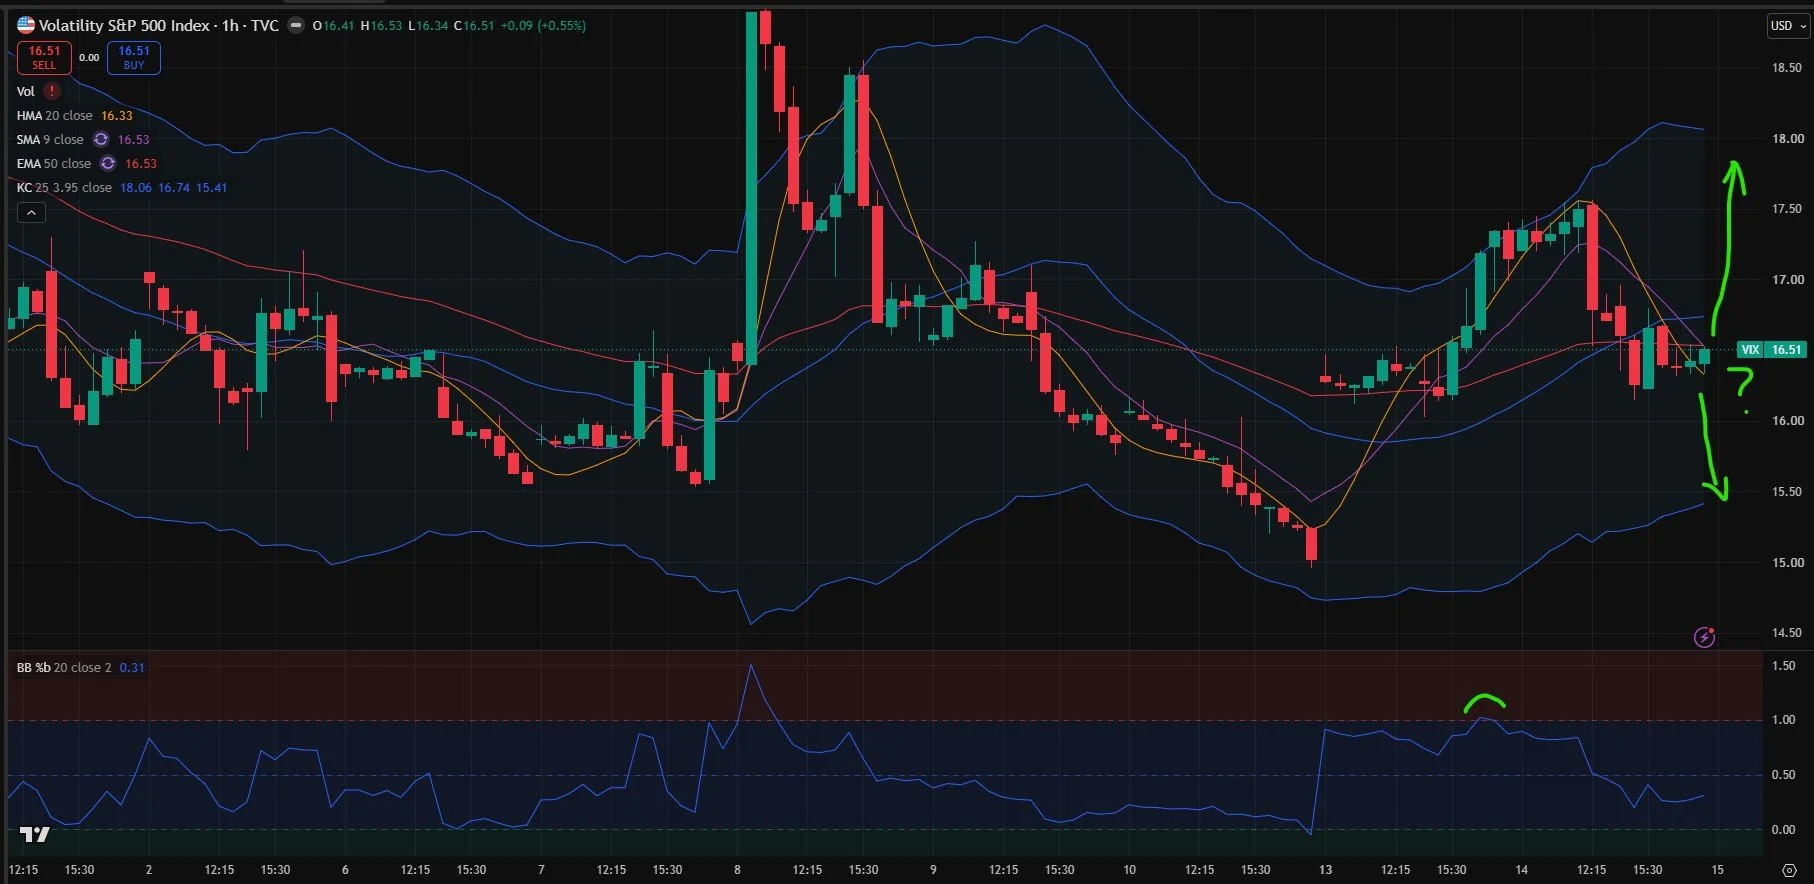
VIX 1-Hour Chart Leans Toward A Spike- Other Timeframes Unclear
The VIX remains below the HMA on the 2-hour and 4-hour timeframes, showing potential to dip toward the 15-15.5 strike area. The 1-hour chart is showing early signs of at least potentially being near a rebound as the VIX crossed over the HMA. The HMA is declining, and the trajectory could take the HMA closer to 16 Wednesday. We’re left with a question of whether or not the VIX can spike to 18 from this point. Given the weaker appearance of the 2- and 4-hour charts, the VIX may not make it very far to the upside until more time has passed.
VIX Daily Chart Could Go EIther Way
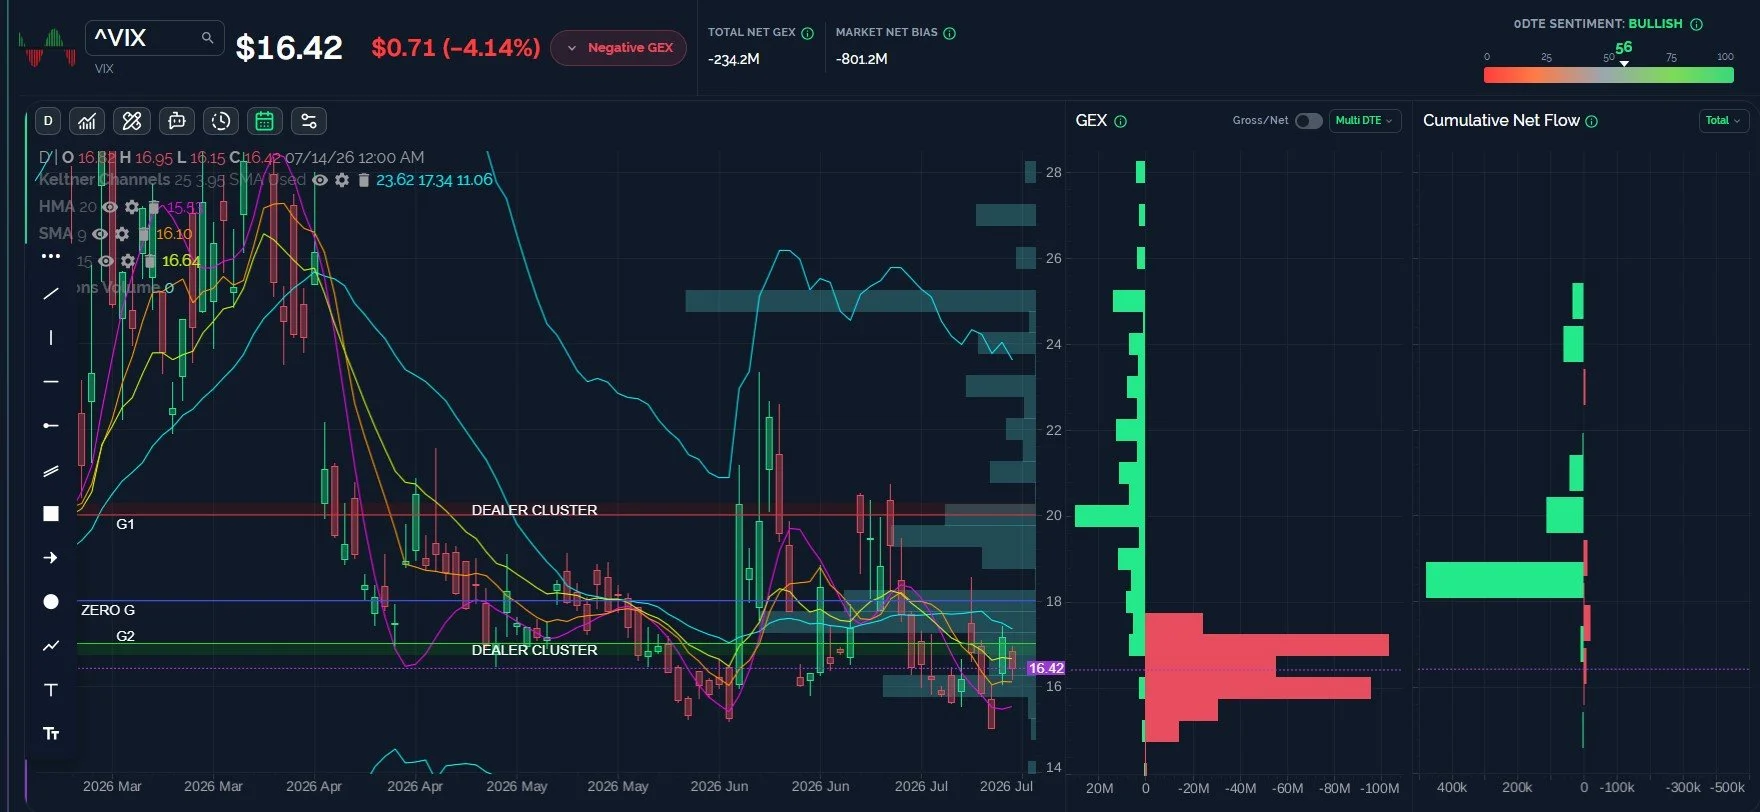
We also see the VIX consolidating above the HMA and 9 SMA on the daily chart, which is usually what I like to see leading up to a VIX spike. The HMA is in the early stages of turning higher, and this is the 2nd day we’ve seen positive option flow (as shown under “Cumulative Net Flow”) at the 19-19.5 strikes. That said, the VIX has quite a bit of room between itself and the HMA at 15.53, so the VIX could drop all the way to 15.53 and still maintain overall constructive volatility potential, in my view. If we combine the 2-hour, 4-hour, and daily views, we’re left with a picture that somewhat leans toward the VIX heading lower before it goes higher. Such a move may coincide with the market doing better for a day or two as we proceed through OpEx week. Can the low VIX last through VIX expiration the 22nd?
Key Levels: Bullish (for the VIX) above 17 targeting 18, then 20. Bearish below 16.10 targeting 15.5.
Join The discussion
We hope you will join us in Discord this week, where we share at least some observations every day for free.
Our YouTube video tonight covers SPX, IWM, BTC, STX, and DELL, so check it out! Tonight’s video and prior videos can be viewed by clicking Community at the top of our homepage to find our YouTube channel link.
Non-subscribers can join through Community on our homepage. First-time guests get a free 7-day trial of the premium Discord channels, where we talk through what is happening in real time.
Join our livestream by clicking the link on our homepage every day around 10:30am ET, and you can replay the most recent one any time before the next one begins.
Thanks for being part of our community and know that we invite and appreciate your feedback!
The information provided by Geeks of Finance LLC is for educational purposes only and is not intended to be, nor should be construed as, an offer, recommendation or solicitation to buy or sell any security or instrument or to participate in any transaction or activity. Please view our Investment Adviser Disclaimer and Risk Disclosure.
