
Sloth Speed To The Target
Someone has to be happy with the choppy and slow trajectory to SPX 6000, a target we’ve been eyeing for at least 2-3 weeks. I’m guessing the premium kill crowd (option sellers) are likely the happiest. The good news for directional traders (other than those preferring the sideways direction) and momentum traders is that we are likely near a turning point for at least a short term move that might have some gusto, given the month-long consolidation sideways (with a brief 3-day fall from the wagon mid-May). Before we dig into this a bit deeper, don’t forget to check out this evenings YouTube recording that complements our newsletter with some additional thoughts by clicking here.
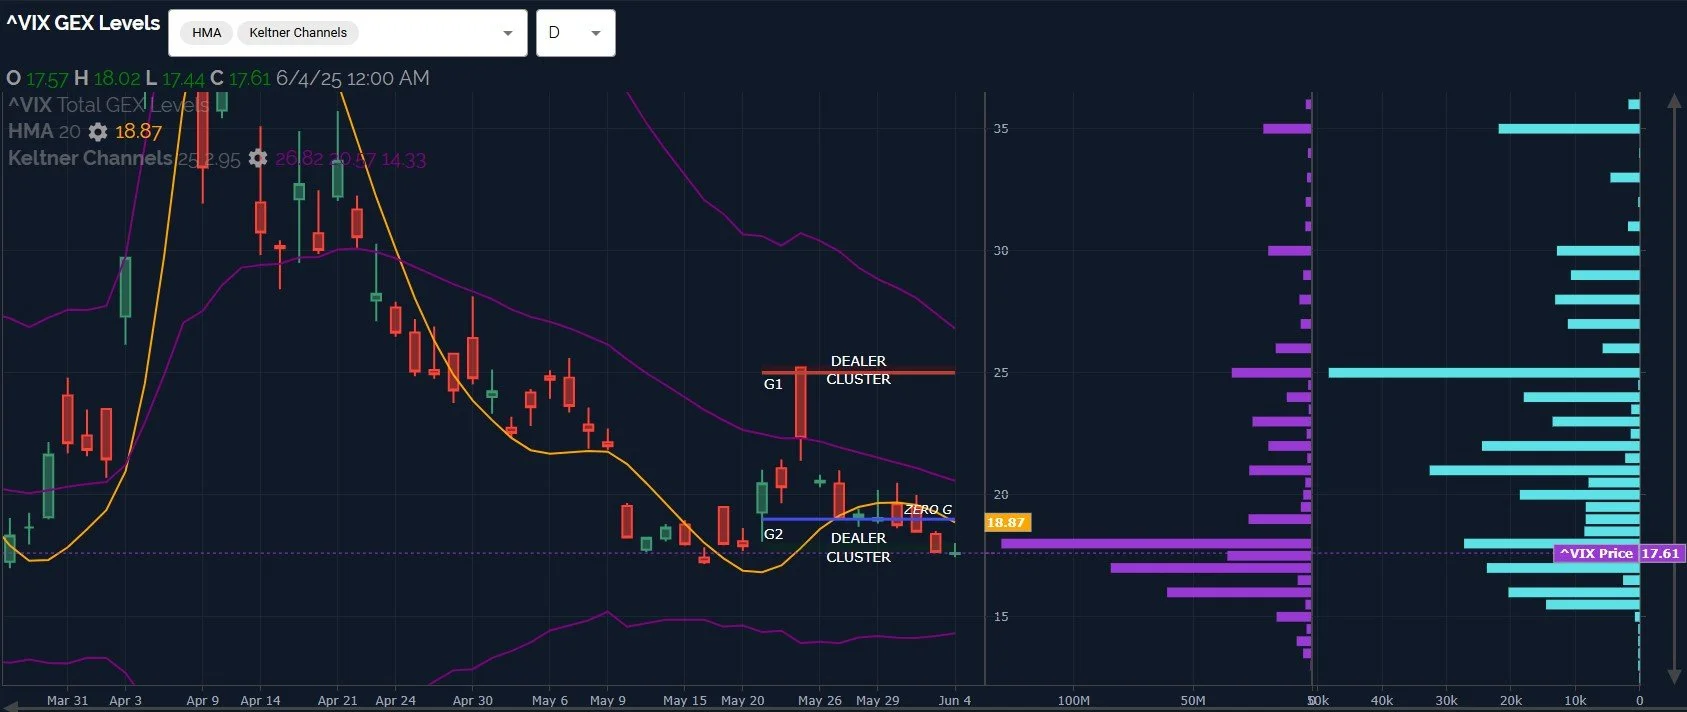
We’ll skip SPX today, because I try to steer away from microscopic activity, but let’s start with the VIX, which did see a change of character. The VIX continues to see volume at higher strikes on an intraday basis consistently, which isn’t surprising given the lower cost of adding protection while the market has been wooed into a hypnotic short-term slumber. Yet we’re still below the largest GEX cluster at VIX 18, which hasn’t shifted, suggesting we might tag the next largest strike at 17 before reversing. Another potential contender is the VIX strike at 16, though I would assign higher odds that 17 stops the volatility collapse.
So where’s the change in character? Well, intraday, the VIX went on a buy signal intraday based on the 2-hour Hull moving average. For context, let’s consider the daily chart shown below, which reflects the VIX below the Hull (the yellow line, 18.87) and testing the lower edge of the lower Dealer Cluster zone. I give higher value to larger time frames, so my initial conclusion is that the VIX might rebound to 18-19, but we can’t assume the market decline has legs until the VIX exceeds and holds (on a daily timeframe) 18.87. To summarize using even fewer mathematical terms, the VIX might rebound, and thus the market might decline, but the move lower won’t be meaningful (subjectively using my analysis) unless we see the VIX close with a value over 18.87.
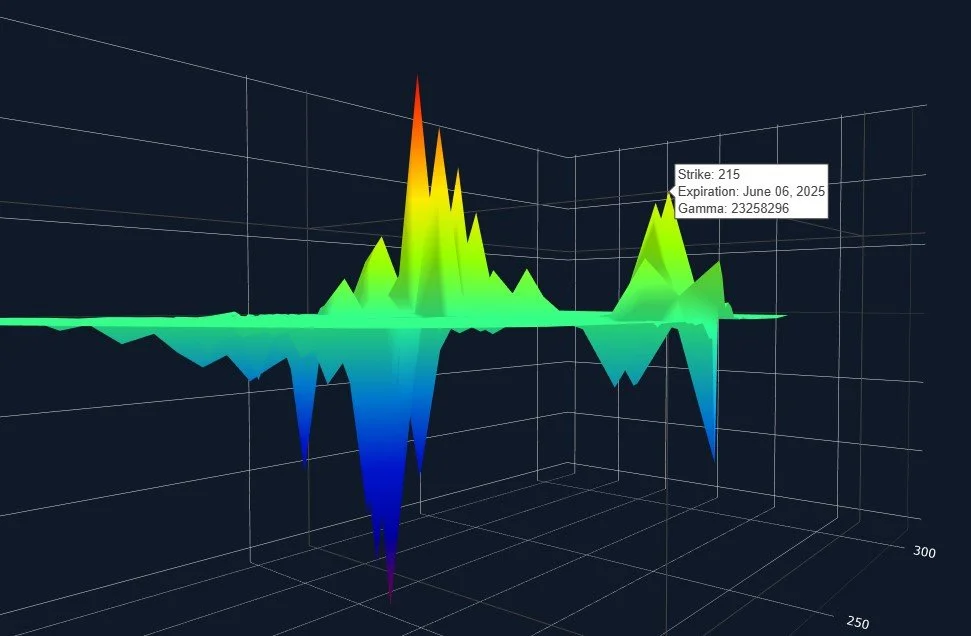
Alright, so we aren’t going to look at SPX because it was a boring today, so what experienced a more consequential shift? How about IWM seeing its upper Dealer Cluster zone rise by about 2.5%, that’s at least more noteworthy than any of the other shifts we saw. Luckily for us, we noticed a spiky GEX cluster at 215 expiring Friday early this week, so the shift of the entire upper Dealer Cluster zone to 215 from 210 for IWM isn’t entirely surprising, but it does warrant a few additional comments. IWM (and QQQ, discussed next) are supportive of the notion that indices push a little higher before we see a meaningful correction. This may be more impactful for DIA and IWM than anything else, since they have the greatest distance to their upper Dealer Clusters, but it adds to conviction that QQQ and SPX do in fact achieve the anticipated targets.

With IWM’s upper Dealer Cluster shifting to 215, what happened to the 3D view, which doesn’t show net GEX, but instead shows positive and negative strikes independently? 215 remains the largest positive cluster, and therefore 215 remains in focus as a high probability target, given the later (or intraday, which will disappear by tomorrow) expiration dates for other clusters that are larger.
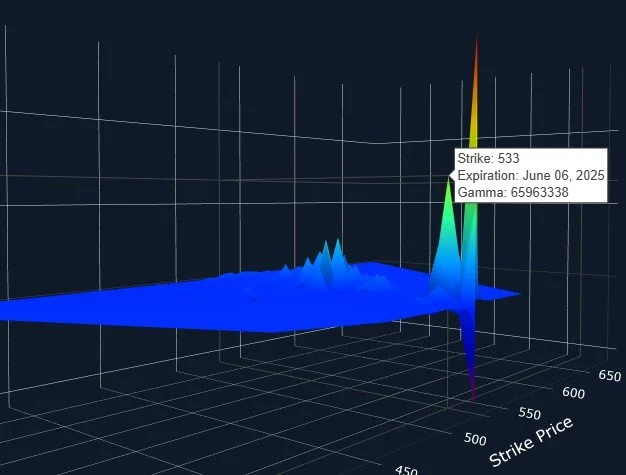
QQQ has seen higher GEX clusters grow, particularly at 535 and 540, raising the odds of those strikes being reached. The upper Keltner channel is currently at 533.75, very close to the largest expiration at 533 that we see for Friday. An initial reaction to this data is that we are likely to reject the 533 test initially, but after a pullback (possibly a painful one?), we reverse and head toward 540.

A cautionary sign for QQQ is that net GEX increased today to 736M, not far from the 5/13 GEX high at 781.5M, which had fairly good correlation with the market top at that time. SPX and SPY saw net GEX slightly decline today, by the way, a negative divergence relative to QQQ.

533 is still the largest GEX cluster we see expiring Friday, so 533 remains the “favorite” target prior to a more meaningful pullback. Momentum traders may want to wait for the initial drop to exceed the Hull to the downside (523.46-525 depending on changes in the Hull) before counting on a deeper correction, because until then, the odds are to the upside.
Here’s the link to our Discord server if you haven’t joined us yet! Discord is our most active social media setting. Access is free for some channels, and new members have a 7-day trial within Discord to see how we operate. We have an active community of thoughtful and experienced traders who chime in throughout the day, sharing ideas and opportunities as we see them.
If you’re interested in accessing our tools and analytics, be sure to check out our website! Mobile updates are now live for a better mobile experience and both subscription tiers have access to our full list of tickers!
If you’re interested in learning more about our strategy and approach, we address all of these topics in our Geek University course which is included in all memberships.
We recently posted a YouTube video today, and we have many other short videos, so give our channel a look if you’re curious about recent market commentary and ideas as well as gamma (GEX) concepts explained.
Thanks for being part of our community and know that we invite your feedback!
The information provided by Geeks of Finance LLC is for educational purposes only and is not intended to be, nor should be construed as, an offer, recommendation or solicitation to buy or sell any security or instrument or to participate in any transaction or activity. Please view our Investment Adviser Disclaimer and Risk Disclosure.