
End of Q2: Performance Chase?
THE ANNUAL SUBSCRIPTION PROMO ENDS SOON- We’re currently offering $300 off of the annual Portfolio Manager subscription. We recently released new mobile interface improvements, and we’re working on more, as well as our recently started daily livestream. Enter code MAY2025 at checkout to lock in a great annualized cost for access to our highest-level subscription! This promotion will last for a few more days.
First off, we encourage you to check out our daily YouTube videos, which you can view by clicking here. Today’s video takes a slightly different look at the larger indices as well as a few individual ideas, so I think it’s complementary to some of the points brought up in the newsletter.
We’re entering the last month of Q2, with the full quarter so far presenting an impressive rally off of the lows, and presumably some sweaty hedge fund managers who are lagging the indices after becoming macro doomsday tariff experts, possibly regretting their deviation from following price action. Will these well-connected marketers serve as catalysts for an end of quarter performance chase, or will other factors cause a decline into the end of June? Let’s take a look at a few possibilities presented by the current GEX picture.
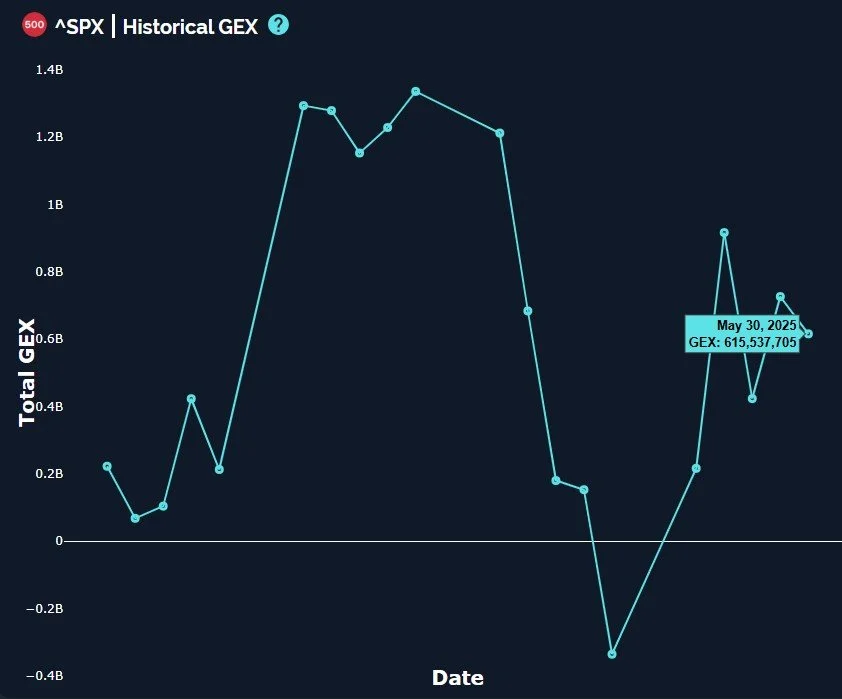
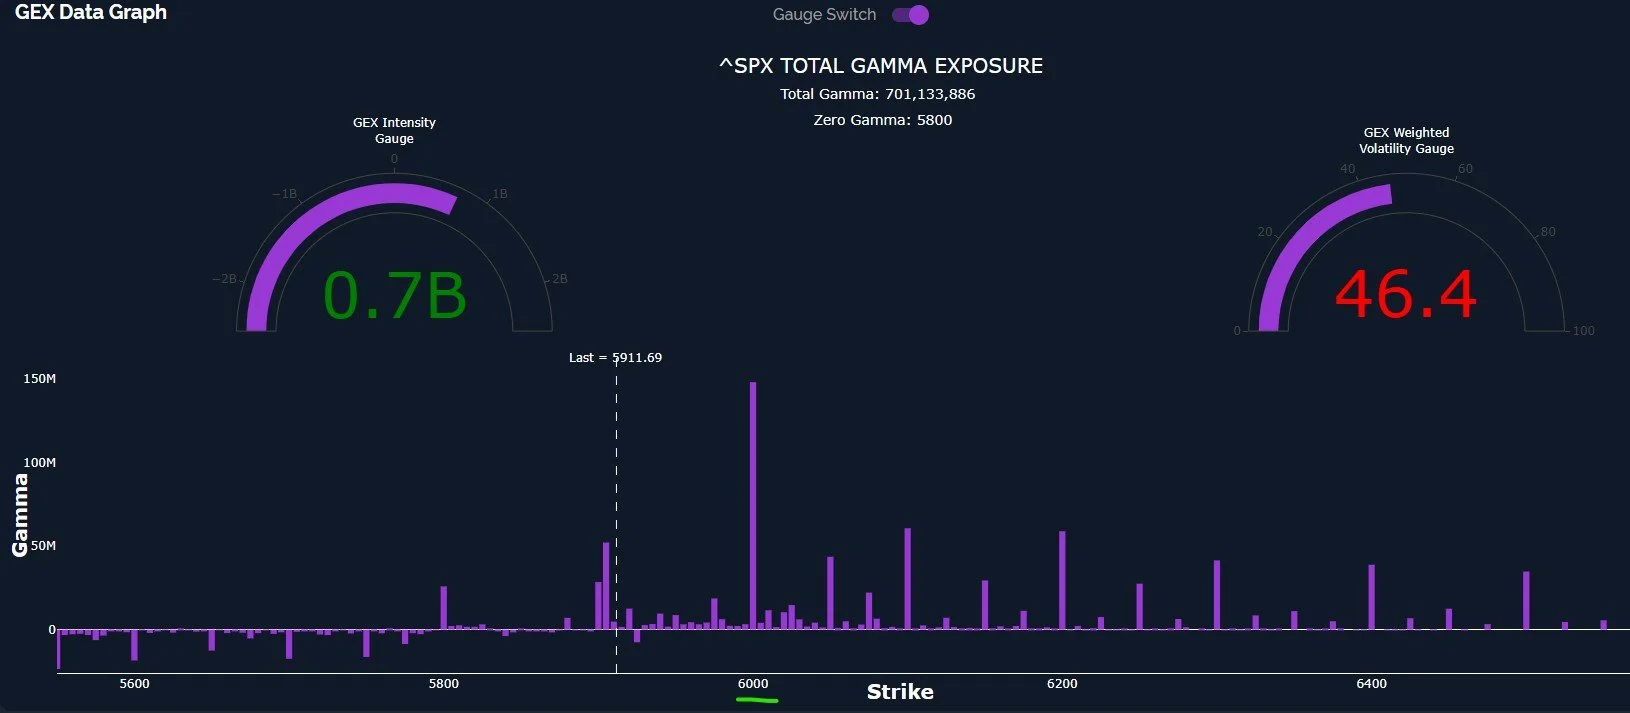
SPX has seen slight increases and decreases in GEX over the last several trading sessions, with the overall net total reading remaining in positive territory. We can see on the data graph below that 6000 remains the largest GEX cluster, thus remaining as a target that we think it very likely to be reached. We look to the cash session as our primary guide, but as a few astute viewers have commented, we technically reached this level in the overnight session a few sessions ago, including QQQ reaching and exceeding the 525 level we’ve highlighted. While we still look for 6000, we have to be aware of the risk that the rallies fails (yet again) just shy of the target.
I view the daily SPX chart with some encouragement for bulls in that I see multiple potential areas of support between 5760-5800, with the green line representing the 15 EMA and the blue line representing the middle Keltner channel. If this area holds, the implication would be a 2-3% drop and then a resumed climb back to 6000+. Being below the daily Hull (the pink line), which I do consider a short-term bearish sign, perhaps a shallow drop could happen early in June before a climb into month-end.
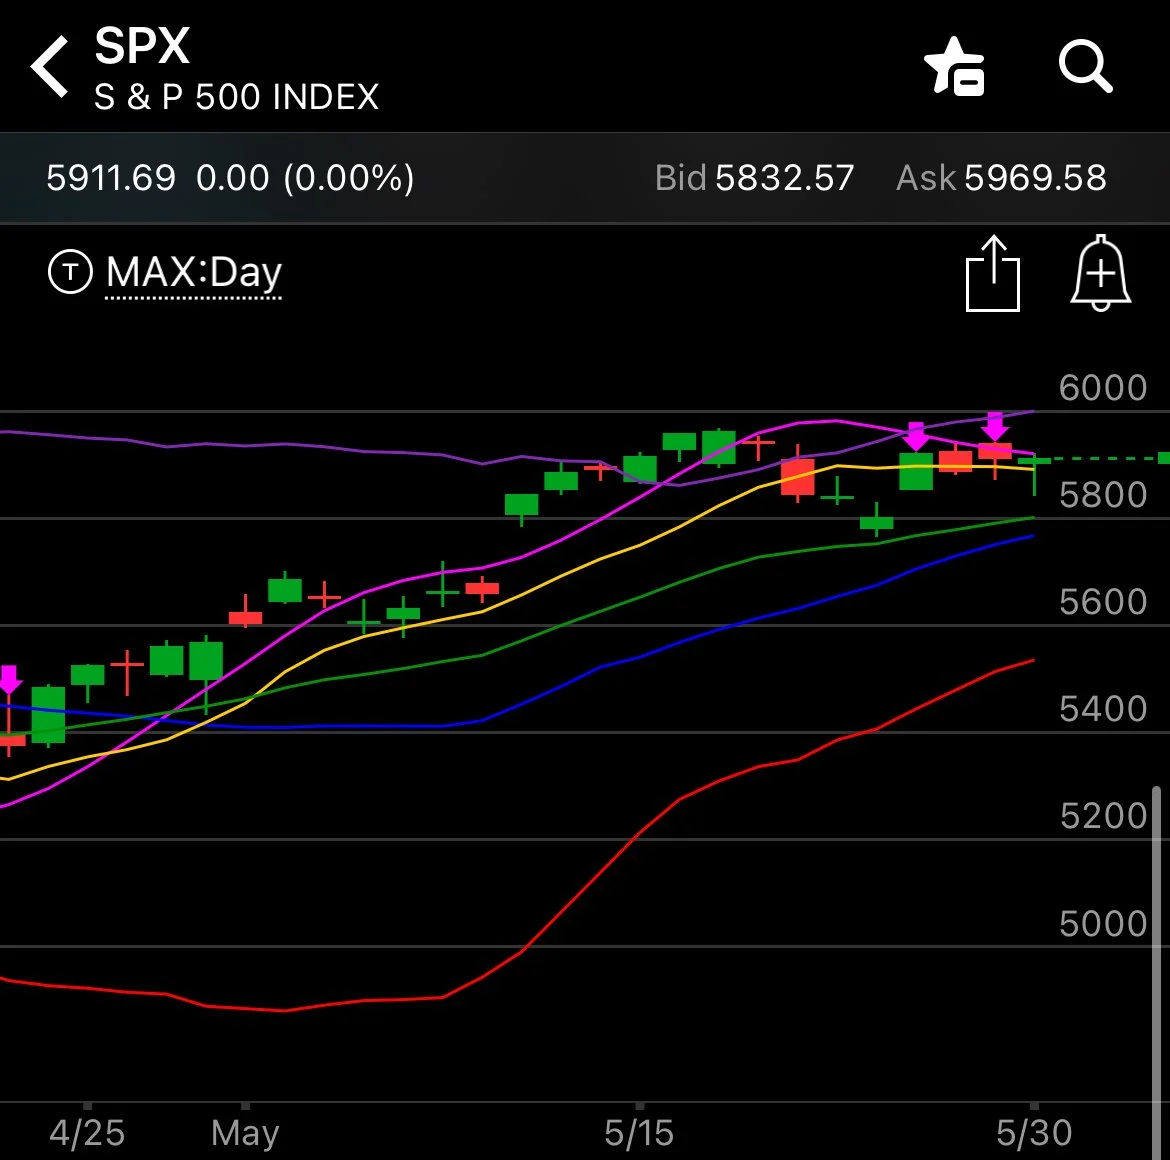
Thinkorswim Mobile
Those same indicators on the weekly chart reveal more “wiggle room” down to the 5600 area and just below, which would definitely spark some queasy indigestion amongst some early dip buyers. Friday saw volume at the 5000 strike (again) exceeding option volume on all but two other strikes, which I find a bit perplexing, and maybe even cautionary. That said, the bottom line from a GEX+selected indicators (including the 9-period SMA) view is that we have a positive bias and any dip to 5600-5800 is likely an opportunity to add longs, if such a dip even happens. The Keltner channels give overhead room to exceed 6000 even now, and we’ll soon look at some conflicting data from the VIX that market bulls will like, so the deeper dip is not a primary scenario at the current moment.
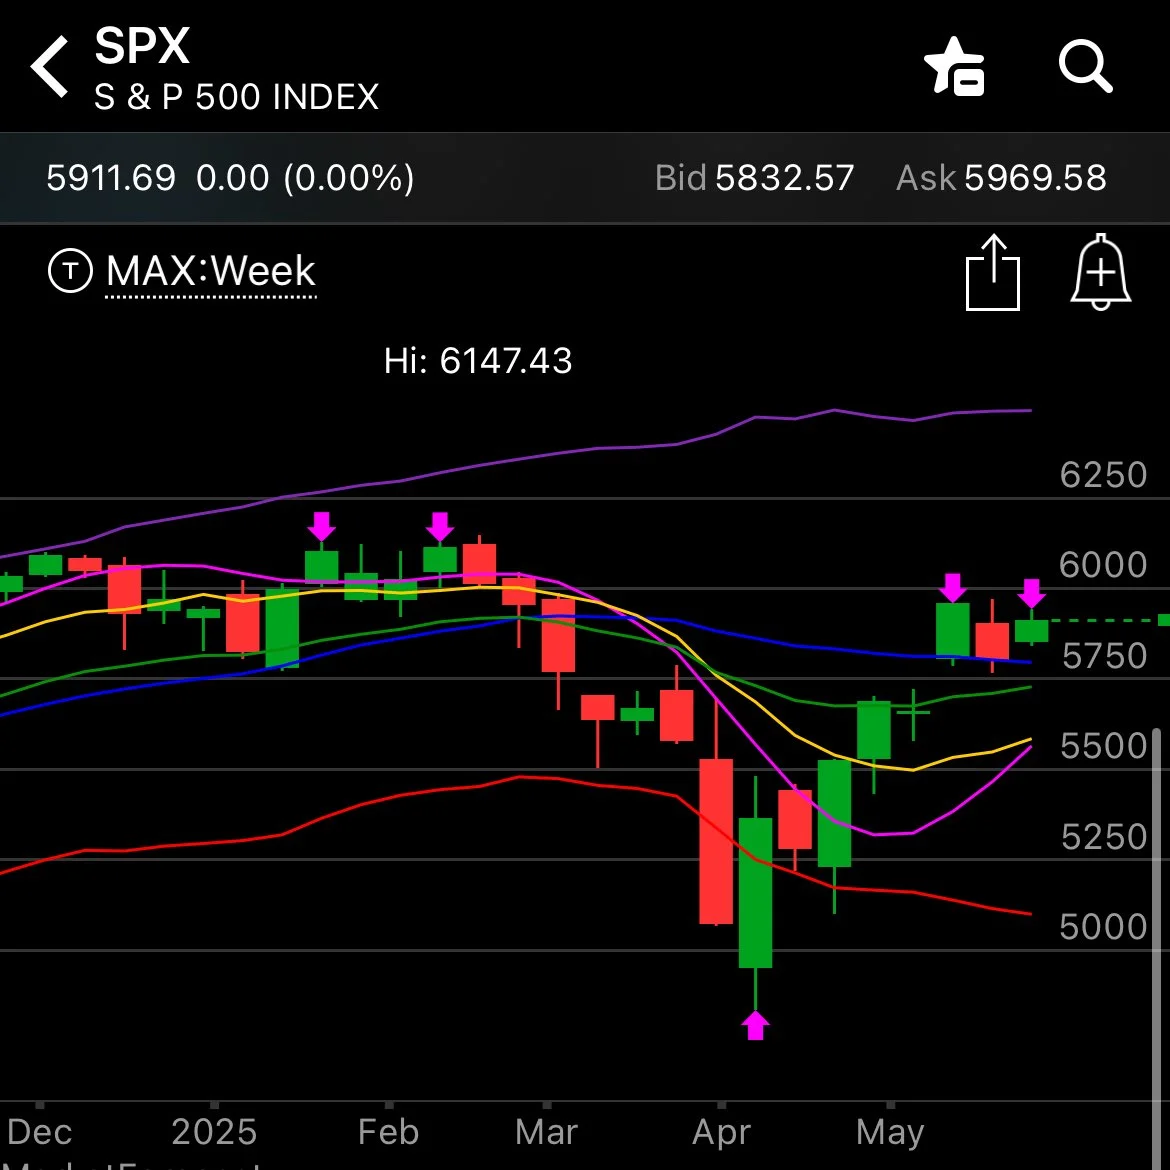
Thinkorswim mobile
IWM continues to be one-sided toward the negative side, with huge negative GEX remaining at 190,195, and 200. Friday saw elevated volume at 194-195. I do see IWM as a stronger indication that we may retest and briefly even exceed 200 to the downside, but the weekly Hull and 9-period SMA at 193-195 combined with the daily volume we’ve seen for days on end makes me think we see IWM hold the 190s for now.
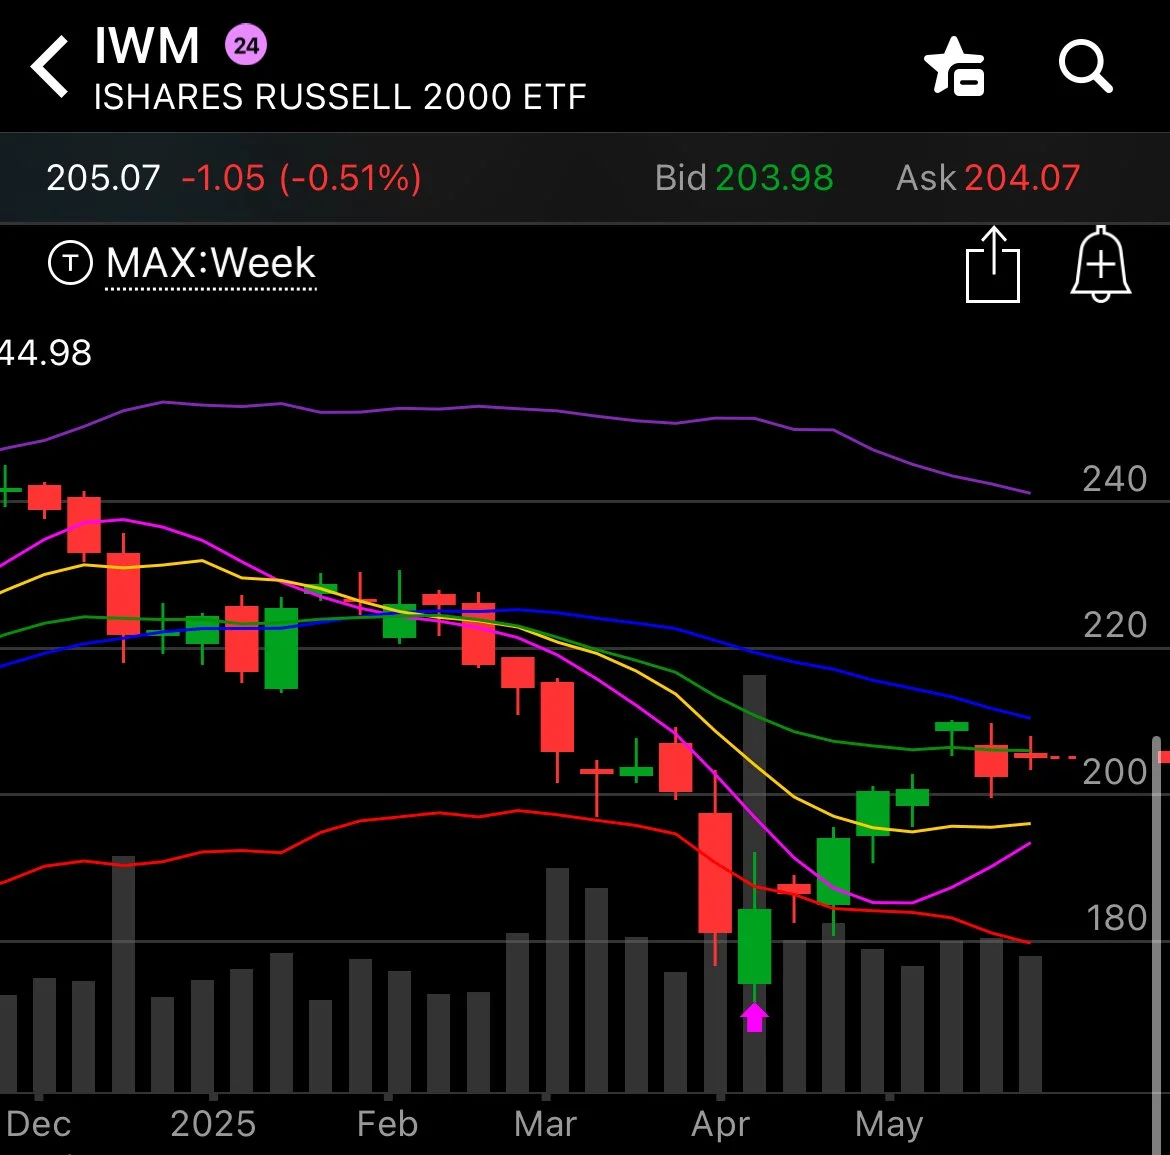
Thinkorswim Mobile
Looking at the GEX data graph, I find the general concentration of the negative GEX to raise interesting possibilities. While the bias is clearly negative, we see the largest cluster at 200, with diminishing clusters as we look down the chain, particularly past the 190 strike. If lower strikes see an increase in negative GEX relative to higher strikes, this may imply we work our way lower, but if the concentration stays the same, we may see a lack of interest in lower prices and in fact a possible squeeze over a short period of time to higher prices. We have no clarity yet, but we know what we’ll look for if and when we test the 190-200 zone again.

Lastly, the VIX is on a 2-hour and 4-hour sell signal, as well as daily, at least based on the VIX being below the Hull on each of those timeframes. The implied drop for the VIX would be to somewhere in the 17-18 area, also justified by a large series of GEX clusters at the 16-18 area. While this condition exists, volume has mostly been at higher strikes, so we do see conflicting signals and an overall picture of limited downside for volatility while upside could be toward the 45-50 mark.

Our bottom line as we head into June is that we want to see 6000 SPX hit, but we may take an adventurous path to reach that level, so we hope we will see additional helpful signals early this week that will help us to form our bias into the next couple of weeks and ultimately into month end. Will we see a pullback first, and then a rally? Sideways chop, then a move into month end? Regardless, we’ll continue finding opportunity using GEX whether it’s the larger index or its components, and we’ll share what we’re seeing along the way.
Here’s the link to our Discord server if you haven’t joined us yet! Discord is our most active social media setting. Access is free for some channels, and new members have a 7-day trial within Discord to see how we operate. We have an active community of thoughtful and experienced traders who chime in throughout the day, sharing ideas and opportunities as we see them.
If you’re interested in accessing our tools and analytics, be sure to check out our website! Mobile updates are now live for a better mobile experience and both subscription tiers have access to our full list of tickers!
If you’re interested in learning more about our strategy and approach, we address all of these topics in our Geek University course which is included in all memberships.
We recently posted a YouTube video today, and we have many other short videos, so give our channel a look if you’re curious about recent market commentary and ideas as well as gamma (GEX) concepts explained.
Thanks for being part of our community and know that we invite your feedback!
The information provided by Geeks of Finance LLC is for educational purposes only and is not intended to be, nor should be construed as, an offer, recommendation or solicitation to buy or sell any security or instrument or to participate in any transaction or activity. Please view our Investment Adviser Disclaimer and Risk Disclosure.