
Support Becomes Resistance
Today’s YouTube video can be viewed by clicking here. We make different points regarding the indices and cover some individual tickers not covered in tonight’s newsletter, so check it out.
Today was significant in that it was the first day since April 21 that SPX closed below the Hull moving average. The difference this time around is that the market hasn’t declined 4 days and 300 points to reach this point, marking the bottom of the drop and the entry to the next leg in the rally. This time, it’s merely the 2nd day with a lower close and a mere 79 points (and an even lesser percentage) drop from a much higher starting point. In other words, this looks more like the beginning of a drop instead of the end.
Yesterday we said “Given that we have various contradictory signals we’ve been highlighting, such as (though not limited to) the VIX regaining the Hull with positive GEX, we very well could start a larger pullback from right here,” and it seems that we have seen exactly that (alright, “larger” is a relative term). Could there be a different interpretation? Unfortunately for those who hate uncertainty, there is. The price action itself with daily candles bordering indecision candles might be marking the launch point for a VIX crush to 18-20 and a market spike to 5800+. I’m giving the Hull the “edge” here in terms of chart indicators (already a flawed premise in terms of any theoretical indicator), which tilts the odds toward lower first, but you can bet I’ll have that scenario in the back of my mind tomorrow.
Glancing at the daily GEX Levels chart below for SPX, we see that the gap down placed SPX well below the Hull moving average, and today’s close was also below the Hull, 3 days after the VIX gave an early indication by closing above the Hull. The VIX still hasn’t really spiked though, so will we get a VIX spike, or will Uncle Jerome knock us back below the Hull for the VIX and above the Hull for the indices when he approaches the FOMC podium tomorrow?

Let’s zoom out and look at SPX’s weekly chart, which gives further potential significance to the area marking the Hull resistance on the daily chart (5673 SPX). The middle Keltner channel on the weekly chart is at 5679, so a mere 6 points from the 5673 Hull on the daily. The next big GEX cluster below 5600? 5300, just below the 5319 weekly Hull. Close enough to send a small tingle up my leg…Nevermind, that was caused by something else.
In the event that Jerome ignites a big short squeeze, or maybe a concurrent “trade talks are going great!” headline (strictly to identify the known catalysts that may exist tomorrow), we have 5800 and 6000 to the upside. I lean more toward continued negativity, and any positive surprise resulting in a retest of support-turned-resistance at higher levels.

SPX net total GEX is almost back to zero, and other indices are back in negative GEX territory. I think the number is less significant (at least in the recent range) than the fact that we’re seeing multiple days of declining GEX, not a one-off drop before GEX rises again. The trend is at least something to watch, though I won’t be basing any trades strictly on a decrease within an already neutral GEX range.

Looking at QQQ, which has the same dynamics impacting the confluence of its daily and weekly charts, we still see meaningful GEX at the 500 strike above, and the largest cluster at 480 marking the importance of today’s close. The weekly chart better matches the GEX picture, with the next largest GEX cluster at 450 getting very close to the weekly Hull at 447.73. I know, 32 points is a big drop for QQQ, but as the optimist in the room, I have to focus on the benefit of saving up for the shopping spree that I know might lay ahead. There’s an old saying- “stocks are the only assets that people love to buy at higher prices instead of at lower prices,” to paraphrase. Well, I like an old-fashioned going out of business sale, what can I say.
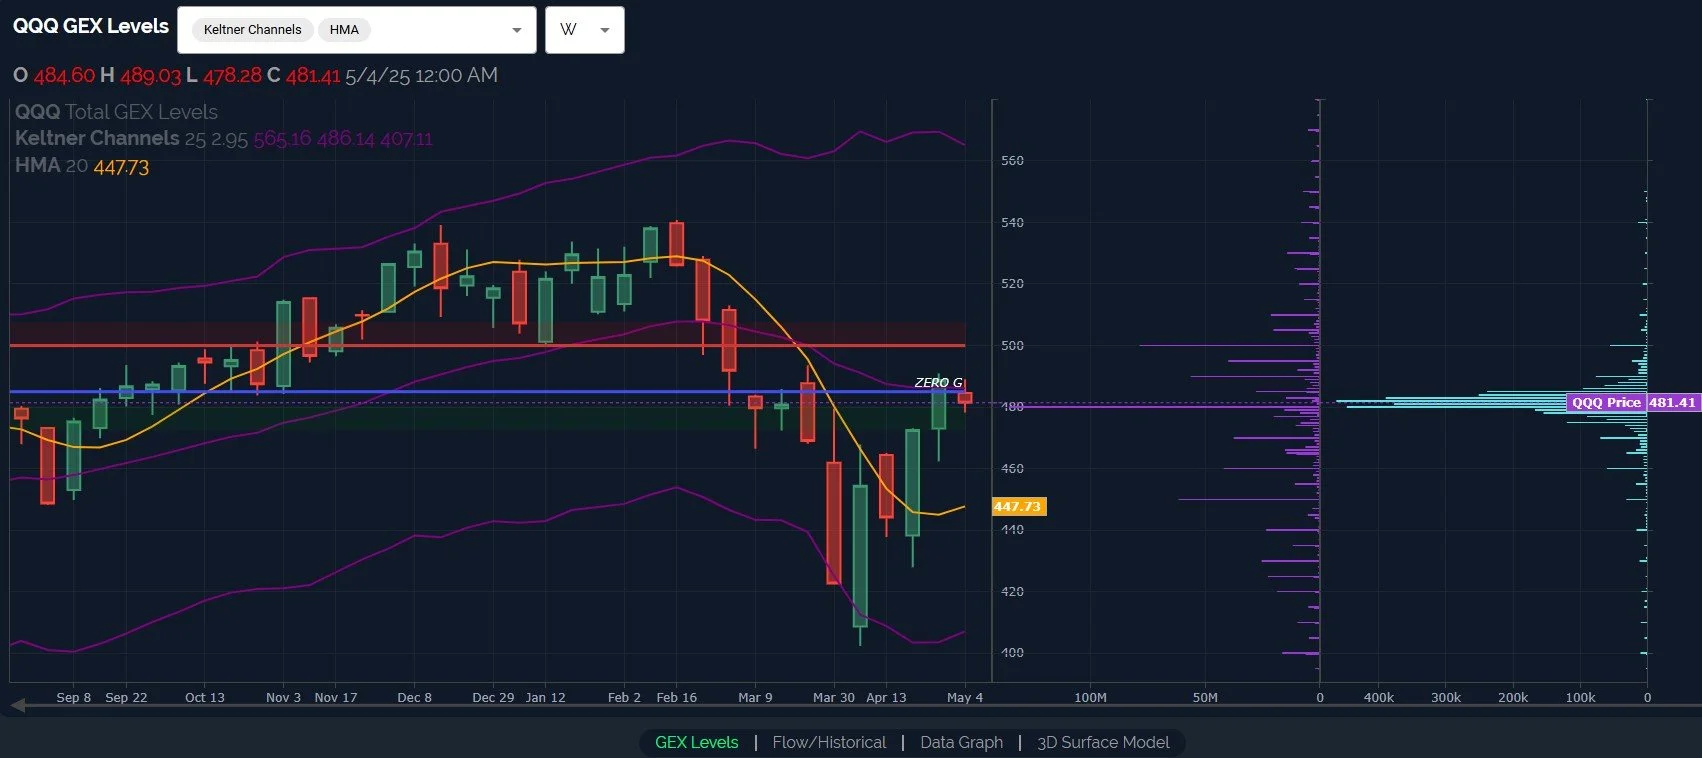
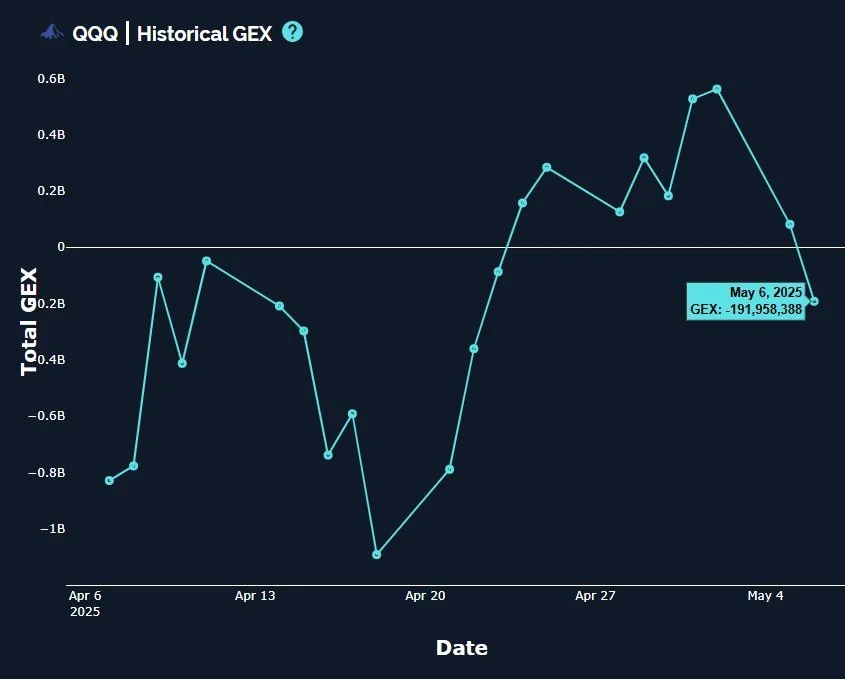
QQQ dipped back into negative GEX territory, dropping back to late April levels in slightly more dramatic fashion than the shift we’ve seen in SPX. You can see that GEX doesn’t move in a straight line, but I think we have enough of a multi-day drop in GEX to warrant caution and consideration that GEX may be signaling a small red flag that the market may be ready to see a larger pullback.
The free calendar at Econoday gave me a few calendar items for tomorrow and Thursday to highlight as potential catalysts for market movement, including FOMC tomorrow and also the 30-year auction on Thursday. Not highlighted, but still possibly impactful, are the conga line of Fed speakers lined up for Friday. Can they just not talk all the time? I remember a time pre-2008 when Fed speakers were not as prevalent or frequent in their attempts to “soothe” markets. Now we have 7 in a day and some speaking twice. What a clown show! Join us in Discord where we clown around, but not with the data..We’ll aim to share some solid GEX data in our free channel since it’s a day that many find challenging, with FOMC and all. Looking forward to seeing you there!

Econoday.com
Here’s the link to our Discord server if you haven’t joined us yet! Discord is our most active social media setting. Access is free for some channels, and new members have a 7-day trial within Discord to see how we operate. We have an active community of thoughtful and experienced traders who chime in throughout the day, sharing ideas and opportunities as we see them.
If you’re interested in accessing our tools and analytics, be sure to check out our website! We rolled out back tested algos and chart indicators and we just increased our ANALYST tier subscription to include 600+ tickers, including individual stocks!
If you’re interested in learning more about our strategy and approach, we address all of these topics in our Geek University course which is included in all memberships.
We recently posted a YouTube video today, and we have many other short videos, so give our channel a look if you’re curious about recent market commentary and ideas as well as gamma (GEX) concepts explained.
Thanks for being part of our community and know that we invite your feedback!
The information provided by Geeks of Finance LLC is for educational purposes only and is not intended to be, nor should be construed as, an offer, recommendation or solicitation to buy or sell any security or instrument or to participate in any transaction or activity. Please view our Investment Adviser Disclaimer and Risk Disclosure.