
SPX 6000 Looking Solid. But When?
Today’s YouTube video can be viewed by clicking here. We take a look at SPY, the VIX, and some major stocks that many of you trade, so check it out!
The S&P completed 9 days of higher closes, a win streak record since 2004. Why not a 10th, 11th, 12th…But seriously, while momentum has been strong to the upside, rarified air in terms of rallies probably means we are closer to the inevitable pullback, since markets do still experience ups and downs, last I checked. Let’s take a look at the gamma exposure (GEX) picture:

SPX (above) shows a solid rally above the yellow Hull moving average, and most of the larger GEX clusters we see are at higher levels. We saw the 6000 GEX cluster emerge some time ago, and it has grown to an even larger target recently. This level coincides with an area just above the upper Keltner channel on the daily chart.
We’ll come back to SPX, but to provide immediate contrast and comparison, let’s look at SPY, which shows a slightly different GEX profile than SPX. Both have positive net total GEX, but SPY shows a lower overall range for the upper Dealer Cluster zone in its current form, with 575 and 580 making up the most noteworthy GEX clusters within that upper zone. 600 is meaningful, but not as significant in comparison to 575-580. The greater distance between SPX’s current price and 6000 compared to the distance from SPY’s current price and 575 will play into my conclusion of near-term probabilities, which we’ll revisit at the end of today’s newsletter.

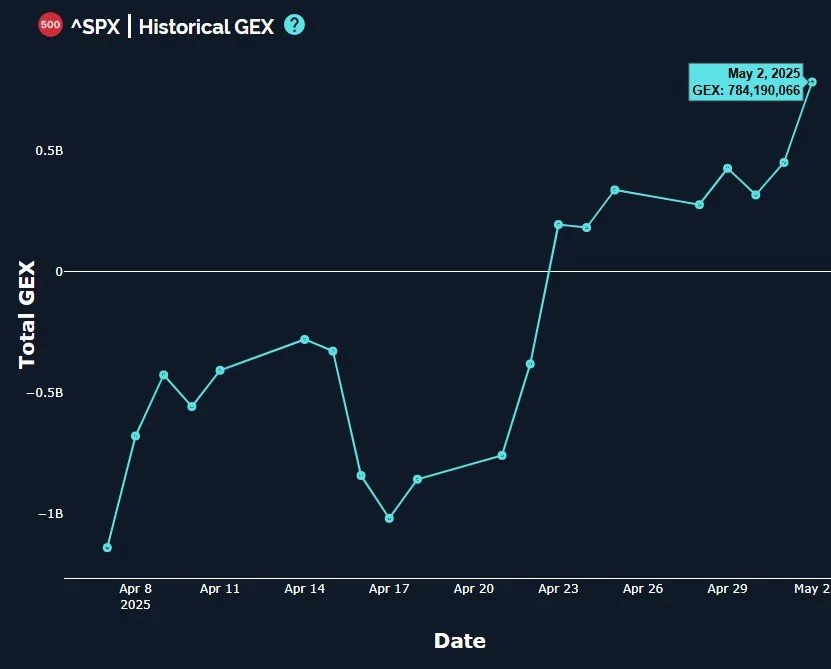
SPX and SPY both have seen an impressive increase in net total GEX, with SPX now at a positive 784M. This undeniable shift likely means that any near-term drops will likely be buying opportunities along the pathway to those ultimate upside targets, though we share the usual caveat that we’ll ultimately rely upon what GEX is telling us as the next pullback unfolds. A drop will undoubtedly lead to GEX appearing at lower strikes, but we will want to see continued interest to some extent at those higher strikes, meaning notable GEX clusters remaining at those levels.
QQQ is more akin to SPY, with 500 representing the largest GEX cluster. QQQ shows very little GEX above 500 though, so QQQ seems to currently suggest that the 2.5% move to get to that upper Dealer Cluster zone at 500 may be about “it” at the moment. This lines up with the upper Keltner channel as well. Still impressive, especially given that this move has been without interruption since April 21. The lower Dealer Cluster zones can be viewed as potential targets in the event of a pullback, in this case representing the 450 area, which may result in a higher low and a closing of the gap left behind 8-9 days ago.

The VIX may also be signaling that a correction is just ahead, with 3 days now of closing above the Hull moving average. The GEX at 42.5 doesn’t seem to want to disappear, and it’s currently the largest GEX cluster. VIX 30 also represents a large GEX cluster. We did see the GEX at the 20 strike disappear Friday, and it seems to have repositioned at 18, which could be perceived as a possible target or spike low for volatility before the next VIX rally, or possibly an ultimate target after a VIX spike, we’ll have to see. Volume (in light blue to the right of the chart) was mostly at higher strikes Friday. The immediate concern (in my opinion) is that the VIX is now above the Hull, which I view as a long signal for volatility.

As we enter the new week, let’s look for consolidation in the SPY and QQQ upper Dealer Cluster zones, and we’ll also keep an eye on the VIX for an early warning that a pullback may be due. We often see the VIX climbing intraday for a short time before a reversal, though not always.
We’ll view a pullback constructively, even if it’s 5-7%, as long as the data justifies such a view. At that time, I will focus more on IWM, which has not seen a shift at all toward the bullish side, with lots of negative GEX remaining. I’d like to see that negative GEX result in a sort of capitulation and possible short squeeze before all is said and done. We hope to see you in Discord where we’ll share some of the important changes we’re seeing throughout the day. Thanks for joining us!
Here’s the link to our Discord server if you haven’t joined us yet! Discord is our most active social media setting. Access is free for some channels, and new members have a 7-day trial within Discord to see how we operate. We have an active community of thoughtful and experienced traders who chime in throughout the day, sharing ideas and opportunities as we see them.
If you’re interested in accessing our tools and analytics, be sure to check out our website! We rolled out back tested algos and chart indicators and we just increased our ANALYST tier subscription to include 600+ tickers, including individual stocks!
If you’re interested in learning more about our strategy and approach, we address all of these topics in our Geek University course which is included in all memberships.
We recently posted a YouTube video today, and we have many other short videos, so give our channel a look if you’re curious about recent market commentary and ideas as well as gamma (GEX) concepts explained.
Thanks for being part of our community and know that we invite your feedback!
The information provided by Geeks of Finance LLC is for educational purposes only and is not intended to be, nor should be construed as, an offer, recommendation or solicitation to buy or sell any security or instrument or to participate in any transaction or activity. Please view our Investment Adviser Disclaimer and Risk Disclosure.