
Quickly Approaching The Next Target…
ANNUAL SUBSCRIPTION PROMO- ENDS TONIGHT! We’re offering $300 off of the annual Portfolio Manager! We’ve made a lot of recent improvements to the platform recently, and we anticipate more near-term improvements, particularly for our mobile users. Enter code EASTER2025 at checkout to take advantage of this limited time offering!
Today’s YouTube video can be viewed by clicking here. It’s relatively short and we cover a few ideas like SMCI as well as an overview of major indices, with info that is sometimes complementary to what we share in the newsletter, so check it out if you have a few minutes.
In yesterday’s newsletter, I said “I’d like to see 5300-5447 hold any decline for a shorter term possibility of continuing higher,” and sure enough, today’s low was 5434, very close to my upper target for a pullback. I know, amazing what can happen with a 147 point range, but at least we had the right idea of a modest pullback, right? This allowed the VIX to spike to the middle daily Keltner channel and SPX filled the gap from April 2nd as well (this happened yesterday, I forgot to mention it). “Beautiful symmetry,” to quote my proctologist (he was talking about markets, fyi). SPX closed 5 points higher than yesterday, though with a lot of effort.
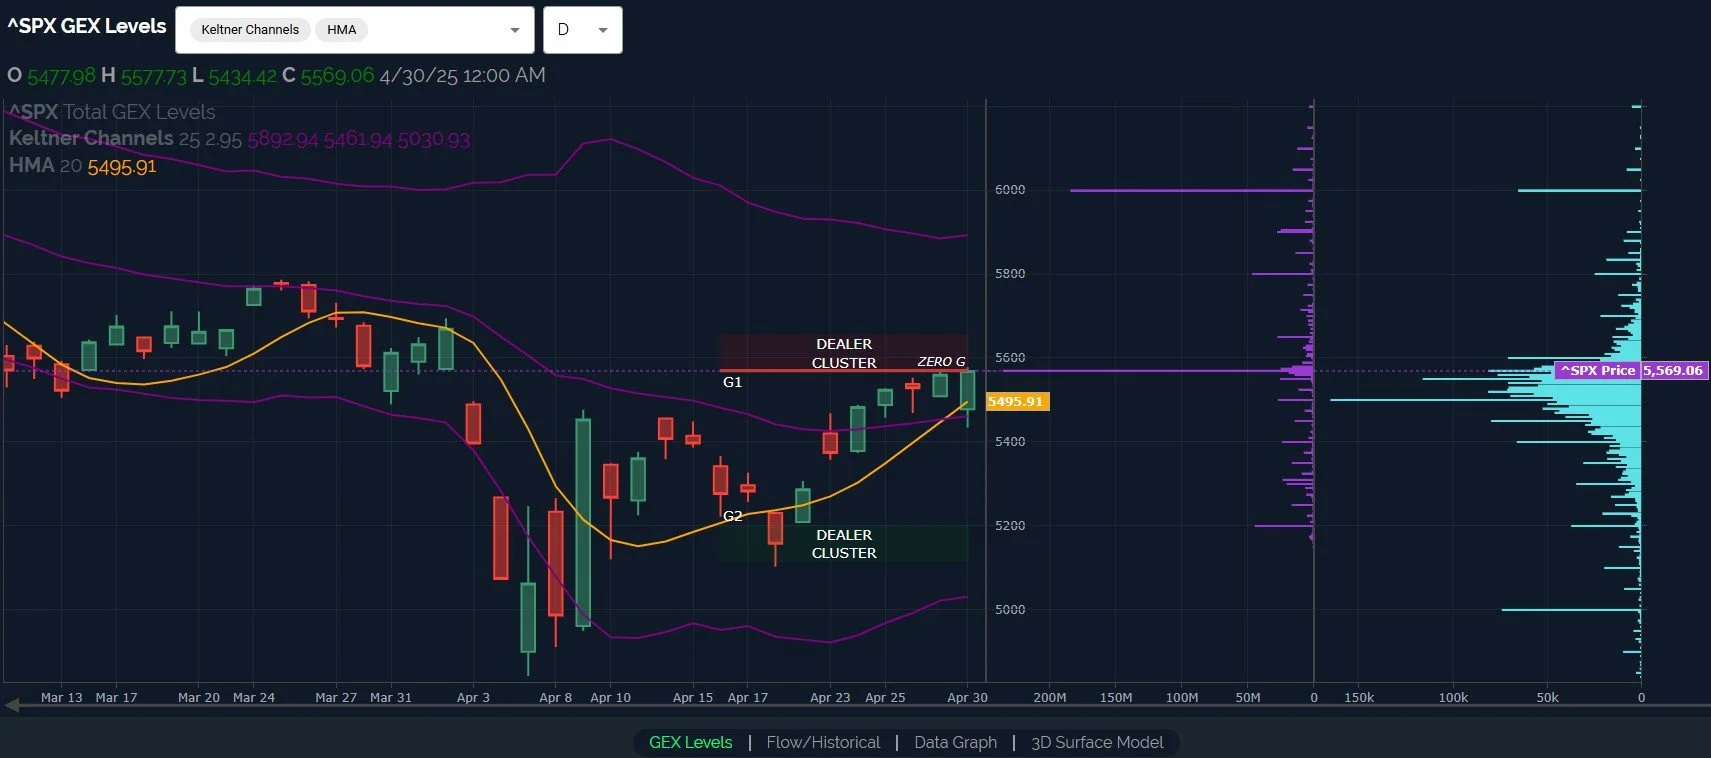
The chart above shows SPX to be right at the upper Dealer Cluster zone, but look at the large GEX still remaining at 6000. Most of that is concentrated at expirations a couple of months out or more, so it’s definitely possible that we see a larger pullback here (maybe to the lower Dealer Cluster at 5200 again?) and we can still have 6000 as a possible target, in theory.
The net total GEX picture for SPX ever so slightly decreased today, which I still see as an interesting divergence given that price rocketed in the last few minutes. I guess if I’m close to exhaustion in a race, I’ll gun it for the last few seconds as well, that way I can beat the guy on crutches next to me before I collapse.

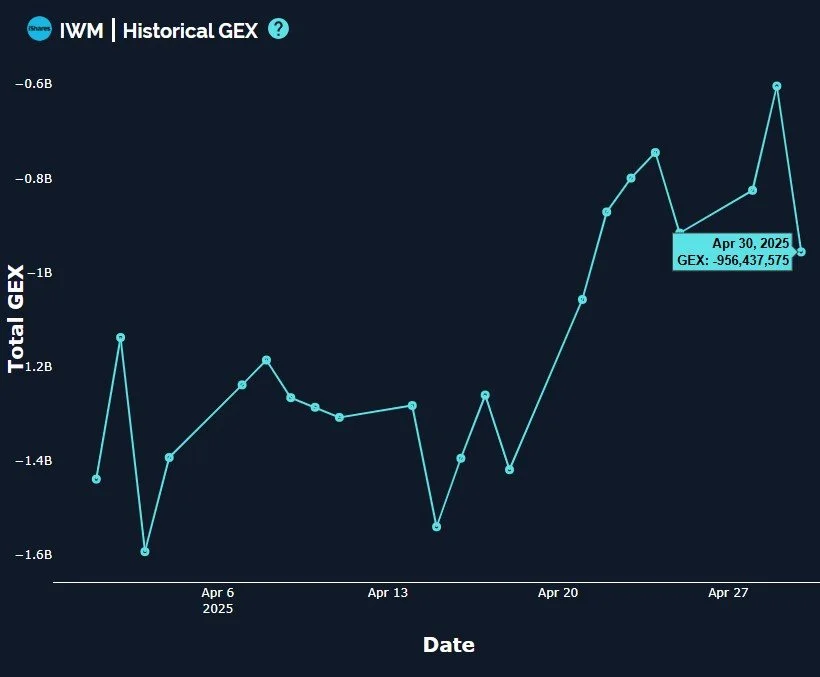
While SPX barely closed higher, IWM failed to do so, making a lower intraday high and also closing lower. Not a good look, Smalls! The yellow Hull is rising at a fairly steep angle, almost surpassing IWM’s price, which will trigger a short signal for me unless IWM closes above the line tomorrow. In other words, IWM needs to continue closing above the Hull for the higher targets to have potential. Unfortunately, we can see that the GEX picture is not cooperating with a desire for higher prices, with today’s highest volume (the light blue bars) closer to 180 than 200, and a lack of GEX clusters at higher prices at the moment. The one thing IWM has going for it right now is the large 190 Dealer Cluster that should (in theory) represent solid support or at least a meaningful barrier for sellers to eat through to open up those lower prices. Given recent volatility, this is entirely possible though, so we’ll stay on our toes.

IWM saw a sharp turn toward the negative as far as GEX, with negative GEX increasing to the worst position in 7 trading sessions. IWM never made it to Positive Land like the other major indices, sadly. It remains to be seen as to whether or not IWM is simply going to sit out a monster rally, or if it’s trying to tell the bulls something about this move up across the board.
We saw a VIX/VVIX divergence today, with the VIX maintaining a green candle at the close, while VVIX closed red. One instance is not the greatest indicator, but if we string several in a row of divergent candles for the two, we have a greatly increased chance of seeing a larger VIX spike thereafter. It is worth noting that VVIX is above the daily Hull and it has been for 3 sessions as of today, despite the red candle.

The VIX is perhaps even more interesting in that it closed above the Hull today for the first time since April 8. Volatility was a good short trade within 2 sessions of closing below the Hull, will closing above it be similar to prior occasions as well, with a good long trade for the VIX? We still see higher volume and large GEX at 42.5 and 50. Caution is warranted!

Here’s the link to our Discord server if you haven’t joined us yet! Discord is our most active social media setting. Access is free for some channels, and new members have a 7-day trial within Discord to see how we operate. We have an active community of thoughtful and experienced traders who chime in throughout the day, sharing ideas and opportunities as we see them.
If you’re interested in accessing our tools and analytics, be sure to check out our website! We rolled out back tested algos and chart indicators and we just increased our ANALYST tier subscription to include 600+ tickers, including individual stocks!
If you’re interested in learning more about our strategy and approach, we address all of these topics in our Geek University course which is included in all memberships.
We recently posted a YouTube video today, and we have many other short videos, so give our channel a look if you’re curious about recent market commentary and ideas as well as gamma (GEX) concepts explained.
Thanks for being part of our community and know that we invite your feedback!
The information provided by Geeks of Finance LLC is for educational purposes only and is not intended to be, nor should be construed as, an offer, recommendation or solicitation to buy or sell any security or instrument or to participate in any transaction or activity. Please view our Investment Adviser Disclaimer and Risk Disclosure.