
SPX 6000 Again?
ANNUAL SUBSCRIPTION PROMO! We’re now offering $300 off of the annual Portfolio Manager! We’ve made a lot of recent improvements to the platform recently, and we anticipate more near-term improvements, particularly for our mobile users. Your needs are our focus, and we want the platform to become indispensable for your trading! Enter code EASTER2025 at checkout to take advantage of this limited time offering. This promo ends soon!
We already posted Today’s YouTube video, which can be viewed by clicking here.
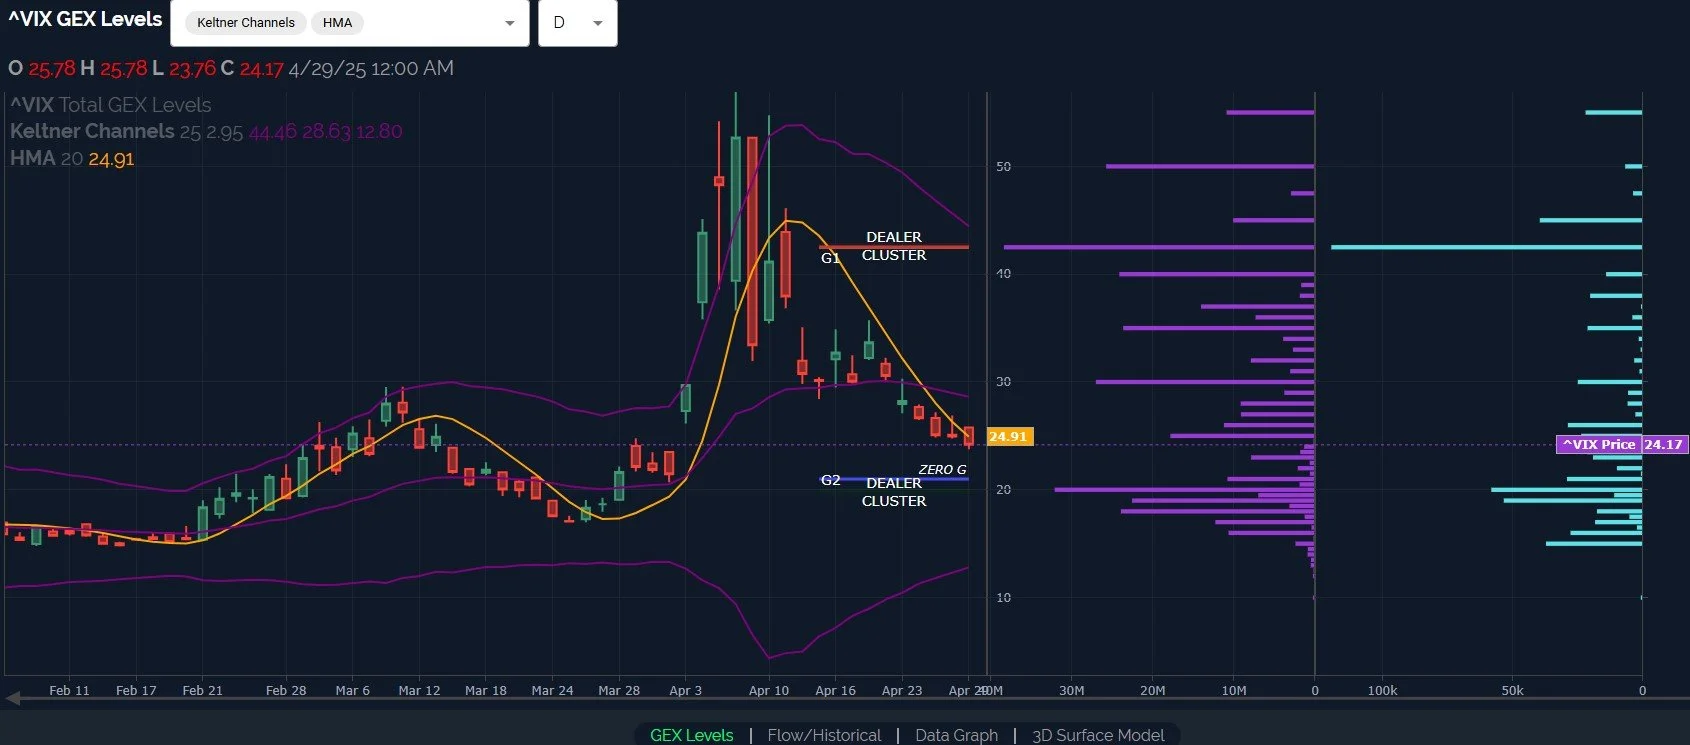
Markets have taken on a more bullish look recently, but the VIX is sending mixed signals that we feel warrant attention. The yellow line represents the Hull moving average, which served as a good marker for having a short bias toward volatility as the VIX dropped below the line in early April. Once we had a day where most of the action was below the line, it was all downhill, bringing us to the current level just over 24. We have a large GEX cluster at 20, but it’s still not as large as the big cluster at 42.5, which continues to get a lot of daily attention in the form of volume (the light blue horizontal bar). I am also watching VIX 23, a strike that coincides with multiple indicator support levels on various timeframes.
With VIX expiration not happening until May 21, we may still see some back and forth for the VIX, implying potential market volatility back down, even if temporary. The steady climb higher for indices doesn’t necessarily signal we’re “out of the woods.”
In contrast to the more cautious picture painted by the VIX, DIA now shows various higher strikes with outsized GEX clusters relative to those at lower prices. 410 and 416 in particular catch my attention. A decline to the Hull around 397 may be a good buying opportunity if the current setup remains. That said, participants aren’t aggressively betting on moving much higher than 425 currently, so upside from here might be about 5% tops.

SPX has now taken on perhaps the most bullish view, and I tend to give SPX more weight given past examples of divergent GEX pictures eventually working out in SPX’s favor since 2023. 6000 shows large GEX, just over the upper Keltner channel. While our lower Dealer Cluster zone shows 5200 as an area that might be good to flip toward the long side, I’d like to see 5300-5447 hold any decline for a shorter term possibility of continuing higher. Other technical resistance areas not shown on my chart below include a variety of targets between 5650-5750 to the upside. The next few days might be quite interesting as we conclude April tomorrow and begin the month of May. Will this year be a good year for “sell in May and go away?”

SPX continues showing overall improvement in the GEX picture, which is still neutral but leaning more positive as we approach the 1B mark. While predicting the next day or several days hasn’t been easy given the indecisive area in which we’ve been trading, we’re still getting great intraday signals that have allowed us to continue making forward progress, so we hope you’ll join us in Discord where we’re most active during the day.

Here’s the link to our Discord server if you haven’t joined us yet! Discord is our most active social media setting. Access is free for some channels, and new members have a 7-day trial within Discord to see how we operate. We have an active community of thoughtful and experienced traders who chime in throughout the day, sharing ideas and opportunities as we see them.
If you’re interested in accessing our tools and analytics, be sure to check out our website! We rolled out back tested algos and chart indicators and we just increased our ANALYST tier subscription to include 600+ tickers, including individual stocks!
If you’re interested in learning more about our strategy and approach, we address all of these topics in our Geek University course which is included in all memberships.
We recently posted a YouTube video today, and we have many other short videos, so give our channel a look if you’re curious about recent market commentary and ideas as well as gamma (GEX) concepts explained.
Thanks for being part of our community and know that we invite your feedback!
The information provided by Geeks of Finance LLC is for educational purposes only and is not intended to be, nor should be construed as, an offer, recommendation or solicitation to buy or sell any security or instrument or to participate in any transaction or activity. Please view our Investment Adviser Disclaimer and Risk Disclosure.