
Divergences Worth Noting
ANNUAL SUBSCRIPTION PROMO! We’re now offering $300 off of the annual Portfolio Manager! We have overlayed chart indicators and several backtested algos complete with notifications and we anticipate more near-term improvements. Your needs are our focus, and we want the platform to become indispensable for your trading! Enter code EASTER2025 at checkout to take advantage of this limited time offering. Only a few days remain!
Today’s YouTube video can be viewed by clicking here, where we cover different aspects of the broader indices as well as some individual ideas, including AAPL and HIMS.
The weekly 9-day SMA continues to show its importance, this time with QQQ touching the line from above for the nearly exact intraday low. The closing candle is a red indecision candle though, which some interpret to be signs of a possible bearish reversal. Statistically, there’s also a good chance of continuation, so the candle is not a slam dunk. Given that GEX is effectively neutral, and we have higher strikes as potential targets at 485 and 500, we currently have good odds that any pullback will be a buying opportunity, as long as the GEX picture remains approximately the same or more positive. As highlighted in the YouTube video, some potential QQQ downside targets initially may be 458 (the daily Hull) or 450, which saw high volume (the horiztonal light blue bars) as well as showing a large GEX concentration.

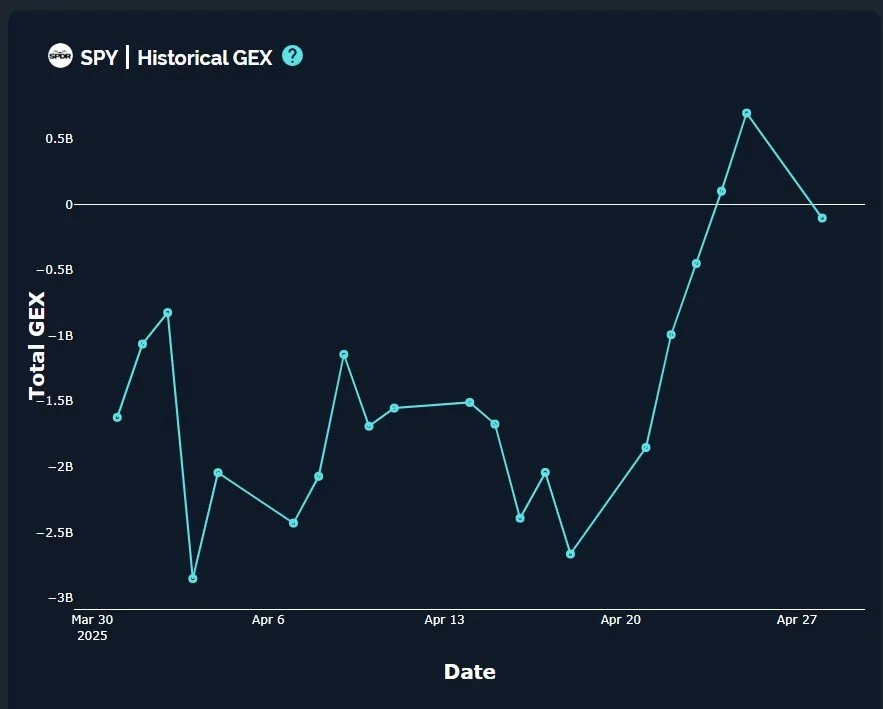
SPY looks very similar, closing just above the 9-period SMA after dropping to test the line today. Note that we still see the largest GEX clusters at lower prices, so SPY isn’t necessarily a bastion of bullish dreams based on the current GEX structure. But this can change, and the momentum has been to the upside lately.

Both QQQ and SPY show a decrease in net total GEX today, somewhat violently back below the zero line. The decline in GEX is certainly more than the price action would indicate, but with the market over the last several years being dominated by zero days to expiration (0 DTE) exposure, the GEX at the closing price can easily swing the total around in a way that sometimes adds more noise than value. But the larger trends are still worth noting, particularly when we see several days in a row of shifting GEX and out-of-the-money strikes gaining or seeing a reduction in positive or negative GEX.
The daily chart for SPX shows potentially strong support now at the Hull moving average and the middle Keltner channel, which are converging, probably as early as tomorrow morning. The more lines of support I see in one place, the more likely we are to hold any drops to that area. I won’t post it here, but my TOS chart shows the 9-day SMA, the 15-day EMA, the middle Keltner, and the Hull all converging at 5400. This gives me a fair amount of confidence that even a 2-3% drop will likely be a good opportunity to establish longs with a target of anywhere from 5700-5800.

IWM likes to live dangerously, to borrow a timeless quote from the great and esteemed Austin Powers, closing a mere 0.03 higher than the 194.91 9-period SMA. My $0.02 (not to confuse matters) is that IWM risk appears to be more to the downside based on negative GEX at lower strikes, but with 190 representing the largest cluster (note- below the current price), we have a potential squeeze scenario that could unfold with the right trigger, which (in part) may happen if we retreat to 190, hold that area, start to rally, and then see the negative GEX unwind at all of those lower strikes. It’s not encouraging that we see higher volume at 184 and 185, but even another 2.5% below 190 would still be within the margin of error where we could see IWM hold and reverse. So far, IWM has been lacking in positive signals and participation to the same extent as QQQ and SPY.

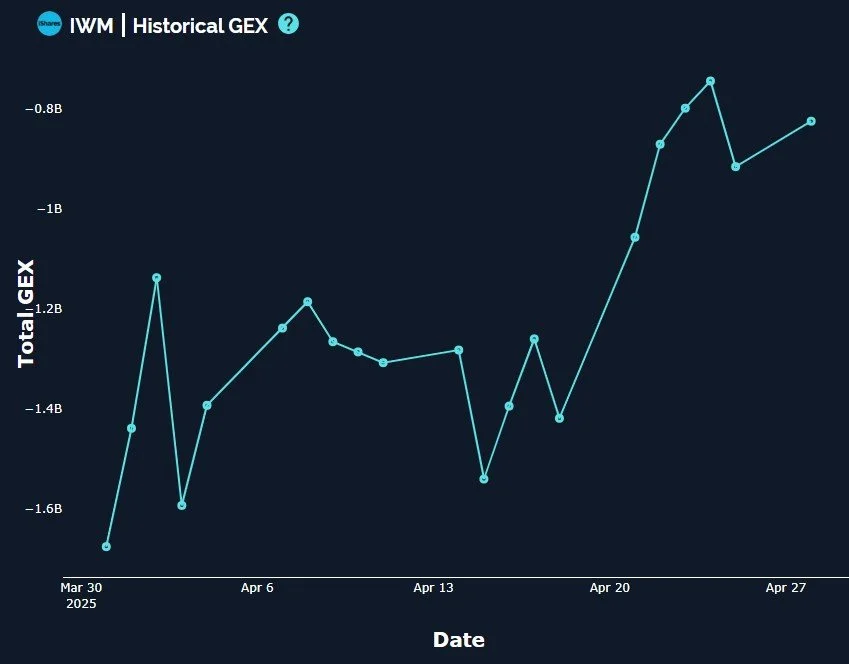
One interesting divergence today- IWM saw an increase in net total GEX while other major indices saw a decline in GEX, opposite of what we saw Friday.
The VIX spent most of the day higher, testing the daily Hull moving average at 26.32 for the first time since mid-April. The first test was rejected, so we closed below the Hull yet again. GEX at the 20 strike has grown, now virtually tying 42.5 as the largest cluster. But note the volume today at out-of-the-money higher strikes: 30, 42.5, and even 60. Once the VIX crosses back over the Hull and closes above it, market bulls may want to watch out in the short run.

Here’s the link to our Discord server if you haven’t joined us yet! Discord is our most active social media setting. Access is free for some channels, and new members have a 7-day trial within Discord to see how we operate. We have an active community of thoughtful and experienced traders who chime in throughout the day, sharing ideas and opportunities as we see them.
If you’re interested in accessing our tools and analytics, be sure to check out our website! We rolled out back tested algos and chart indicators and we just increased our ANALYST tier subscription to include 600+ tickers, including individual stocks!
If you’re interested in learning more about our strategy and approach, we address all of these topics in our Geek University course which is included in all memberships.
We recently posted a YouTube video today, and we have many other short videos, so give our channel a look if you’re curious about recent market commentary and ideas as well as gamma (GEX) concepts explained.
Thanks for being part of our community and know that we invite your feedback!
The information provided by Geeks of Finance LLC is for educational purposes only and is not intended to be, nor should be construed as, an offer, recommendation or solicitation to buy or sell any security or instrument or to participate in any transaction or activity. Please view our Investment Adviser Disclaimer and Risk Disclosure.