
Resistance- Or Major Shift Higher?
ANNUAL SUBSCRIPTION PROMO! We’re now offering $300 off of the annual Portfolio Manager! We have overlayed chart indicators and several backtested algos complete with notifications and we anticipate more near-term improvements. Your needs are our focus, and we want the platform to become indispensable for your trading! Enter code EASTER2025 at checkout to take advantage of this limited time offering. Only a few days remain!
We posted our latest YouTube video this afternoon, which takes a look at indices as of Friday while also covering some important strategy and trade construction themes, so check it out. The short video can be viewed by clicking here.
Last week saw a strong move higher, roughly 8% for the week, with the low on Monday. We saw a noteworthy shift in GEX toward the positive side for SPY and QQQ, though IWM seems more muted in its participation. Let’s take a look at the weekly chart for the big picture importance of the markets current level.
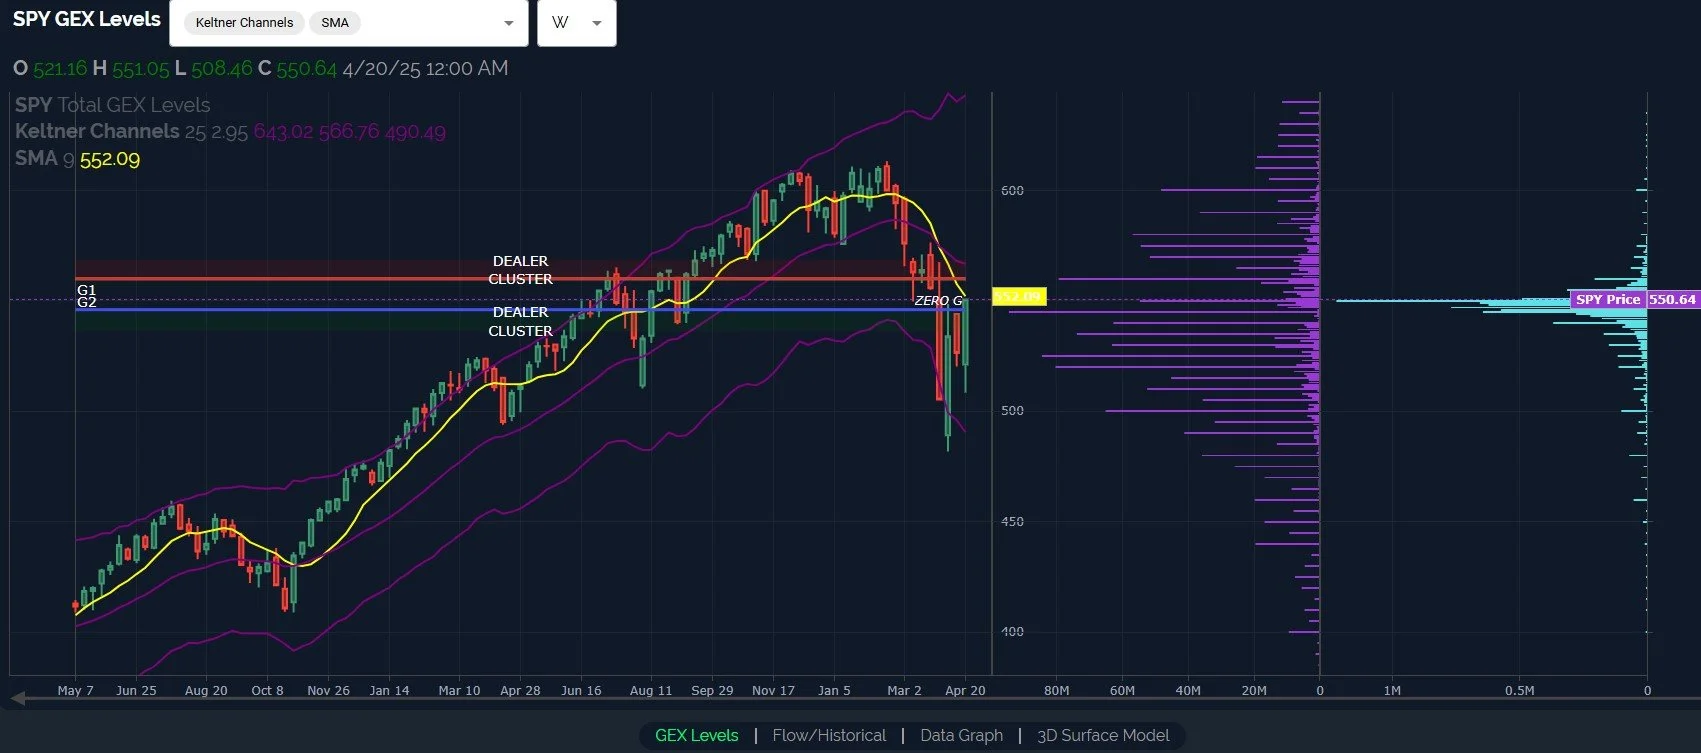
Let’s take a look at SPY above, for starters. The lower weekly Keltner is still pointing lower, though the upper Keltner has started pointing higher, though at a much more subtle angle. This may imply continued outsized volatility in both directions, though we are almost to the middle channel, so we’re immediately more concerned with the next move above or below the line. Note that we now have meaningful GEX at 600, so the range of notable GEX clusters is 500-600 currently.
While SPY closed just above 550, 560 is actually the 3rd largest GEX cluster, behind 525 and 545. This tells me there may be a fairly good chance that we visit 560 in the short term, but getting beyond that is less likely, despite the positive trend of higher strikes showing more GEX than early last week and before. The 9-period SMA is at 552, and that appears to be an important line, given that we haven’t been above it since mid-February. The upper Dealer Cluster zone at 560 implies we may overshoot the line, but risk exists to then fail not far above it, at least failure in the form of a pullback. Targets in the event of a pullback starting are currently the 545 GEX cluster, the 530 weekly or 533 daily Hull moving average, or the GEX cluster at 525. We’ll update our analysis as we see any noteworthy shifts in the GEX picture.
SPY net total GEX increased impressively to 698M, a number not seen for quite some time this year. Given that SPY is above the Hull, we see improved total GEX, and SPX generally agrees in terms of similarities of the GEX picture, my opinion is that a dip is likely soon, but that dip is also likely a buying opportunity.

QQQ’s chart looks remarkably similar to SPY, including the Keltner channels and QQQ’s price in relation to the indicators on my chart, with the exception of QQQ having already (ever so slightly) breached the 9-period SMA. 485 is the largest GEX cluster, which is roughly 2.5% higher from here, implying a retest of the middle Keltner channel.

QQQ also saw similar improvement in the total net GEX picture, now completing 2 days above the zero line.

IWM, as discussed in today’s YouTube video, continues to look the least exciting for bulls, with very little GEX growing above 190, and far more GEX resting below the surface at 170-185. IMW is not quite to the 9-period SMA at 197.10, and note Friday’s high volume at the 183 strike. I’ve mentioned before, to have a sense of being “out of the woods,” I’d rather see IWM leading the way, at least initially. This leadership hasn’t happened during this rebound, which I view as a red flag. IWM hasn’t kept pace with the mega cap-driven indices over the last few years, so I am only talking about leadership for a short period of time emerging from a correction. This time could always be different…right?

IWM GEX is still deeply negative relative to the other indices, and in fact, Friday saw GEX drop for the first time in 5 days. Not awe-inspiring to say the least.

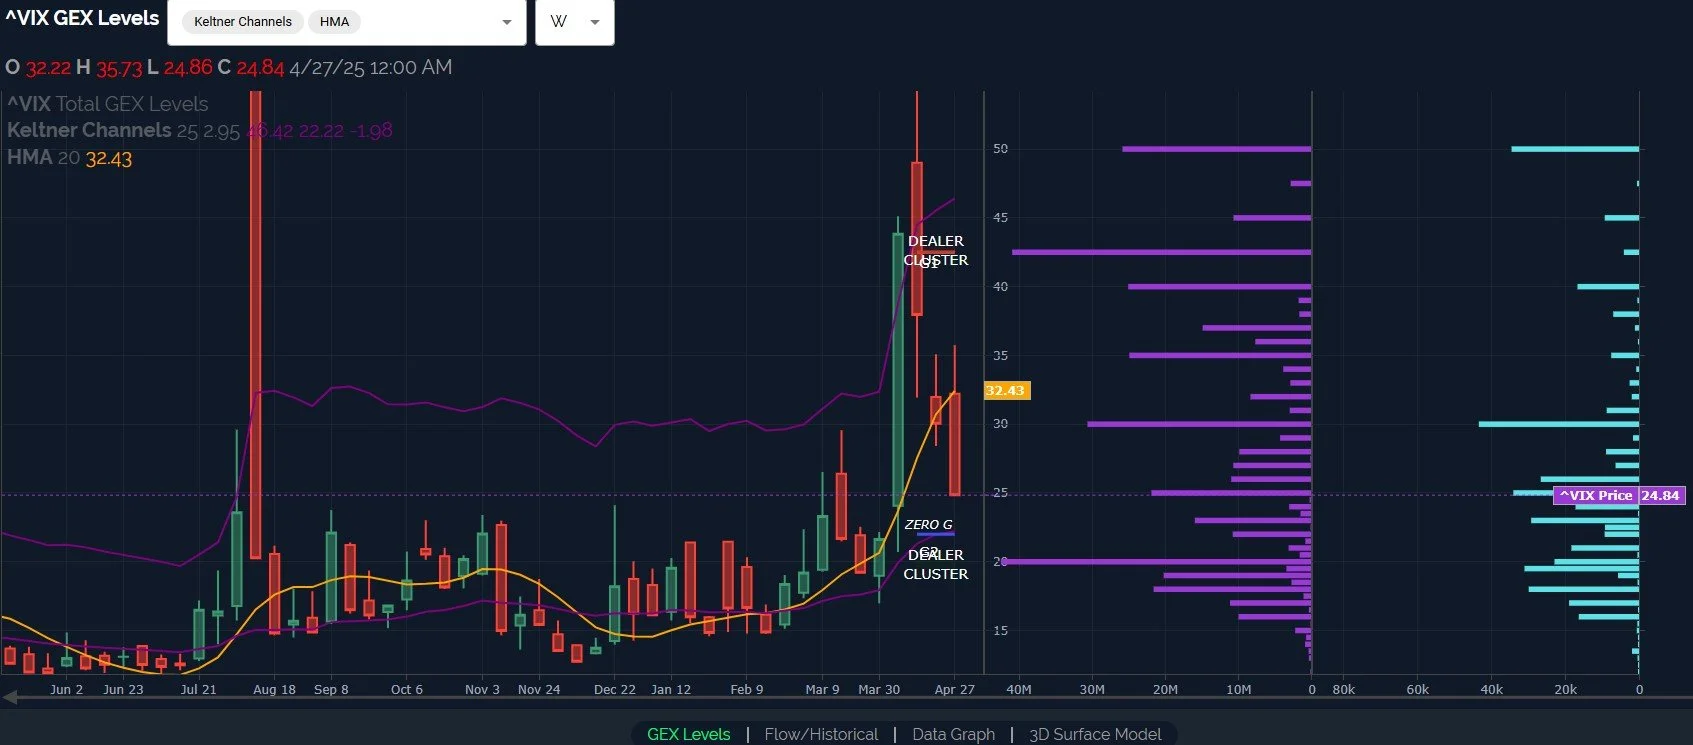
The VIX weekly chart gives us some interesting observations. For the full week, you can see we entered the week after closing below the Hull the previous Friday, attempting to rally above the Hull again, but seeing rejection and a close deeply below the weekly Hull. We saw a negative shift for volatility last week that corresponded with the markets improving, with positive GEX reducing and GEX at the 20 strike growing significantly. This may be the “ultimate” destination for the VIX as the market reaches one of the levels discussed above, in theory. But note the large GEX clusters still at 42.5 and 50? This is unusual relative to recent history and represents another red flag regarding the most recent market decline being a run-of-the-mill pullback.
Alright, so the environment is unusual, you get that…What scenarios will we be watching to unfold in coming weeks? Some of this is only proven in hindsight, but recognizing the uncertainty may impact holding periods or trade structure. Will we resume the decline to new lows, cementing a protracted bear market? Will we make new highs soon, with 600 being the first stop along the way? Will we see new highs, but in the context of crazy volatility not seen in years, including new lows after new highs? We hope you’ll join us as we take in information from the markets as it becomes available and we’ll adjust one day at a time.
Here’s the link to our Discord server if you haven’t joined us yet! Discord is our most active social media setting. Access is free for some channels, and new members have a 7-day trial within Discord to see how we operate. We have an active community of thoughtful and experienced traders who chime in throughout the day, sharing ideas and opportunities as we see them.
If you’re interested in accessing our tools and analytics, be sure to check out our website! We rolled out back tested algos and chart indicators and we just increased our ANALYST tier subscription to include 600+ tickers, including individual stocks!
If you’re interested in learning more about our strategy and approach, we address all of these topics in our Geek University course which is included in all memberships.
We recently posted a YouTube video today, and we have many other short videos, so give our channel a look if you’re curious about recent market commentary and ideas as well as gamma (GEX) concepts explained.
Thanks for being part of our community and know that we invite your feedback!
The information provided by Geeks of Finance LLC is for educational purposes only and is not intended to be, nor should be construed as, an offer, recommendation or solicitation to buy or sell any security or instrument or to participate in any transaction or activity. Please view our Investment Adviser Disclaimer and Risk Disclosure.