
Upside Targets & Landmines
Tonight’s YouTube video (click here to view) covers some new ideas you won’t see in the newsletter, and we also take a look at QQQ as well as additional points on SPY/SPX, so I think you’ll find it interesting. You’ll notice some overlap, such as with the VIX, which reached a huge upper Dealer Cluster zone at the 50 strike as shown in the chart below:

We have various ways that we display gamma exposure (GEX) on our website, including graphs that show net positive/negative GEX as well as each individual GEX cluster at each strike, but since it’s not obvious on the chart above, the VIX currently shows net positive GEX, and the cluster at 50 is positive as well. One way to think about large GEX clusters is that those areas may be where consolidation or reversal occurs given the counteracting actions dealers will often take at those levels, particularly in a positive GEX environment. Volume today was also at lower strikes for the VIX, and I notice the lower Keltner channel turning lower, a divergence from the upper Keltner channel, which has been following price on the way up.
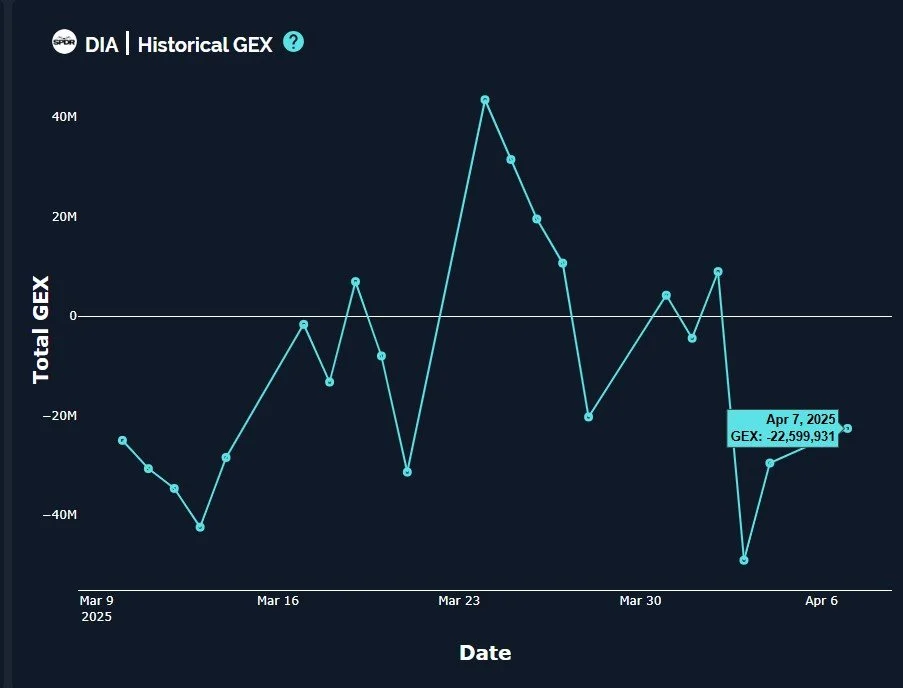
DIA’s price action has been weaker as of late, especially the last two trading days, but we still see a relative absence of large GEX clusters below today’s low and the largest clusters are actually higher, at 400 and 425. Large volume was present at 400 today as well.

A theme we saw consistently across the board was a decrease in negative GEX (except for SPY, driven exclusively by today’s 0 DTE close), a positive sign. GEX getting back to positive means dealers are likely to “assist” in dampening volatility as they hedge their exposure, whereas negative GEX sees dealers potentially exacerbating volatility by positioning in the direction of underlying momentum. This is an assumption that factors into GEX in our case.
SPX also saw a reduction of roughly 20% of its negative GEX, a positive development, especially compared to Friday’s increase in negative GEX. Today’s action saw a breach and initial rejection of the declining lower Keltner channel, though SPX still closed nicely positive compared to the cash session open. A retest of the Hull (the yellow line currently showing 5430) would be a realistic upside target in a continuation scenario. Keep in mind, the expanded volatility has created a situation where the lower and upper Keltners are over 800 points apart, so wider ranges are not to be unexpected, at least temporarily.
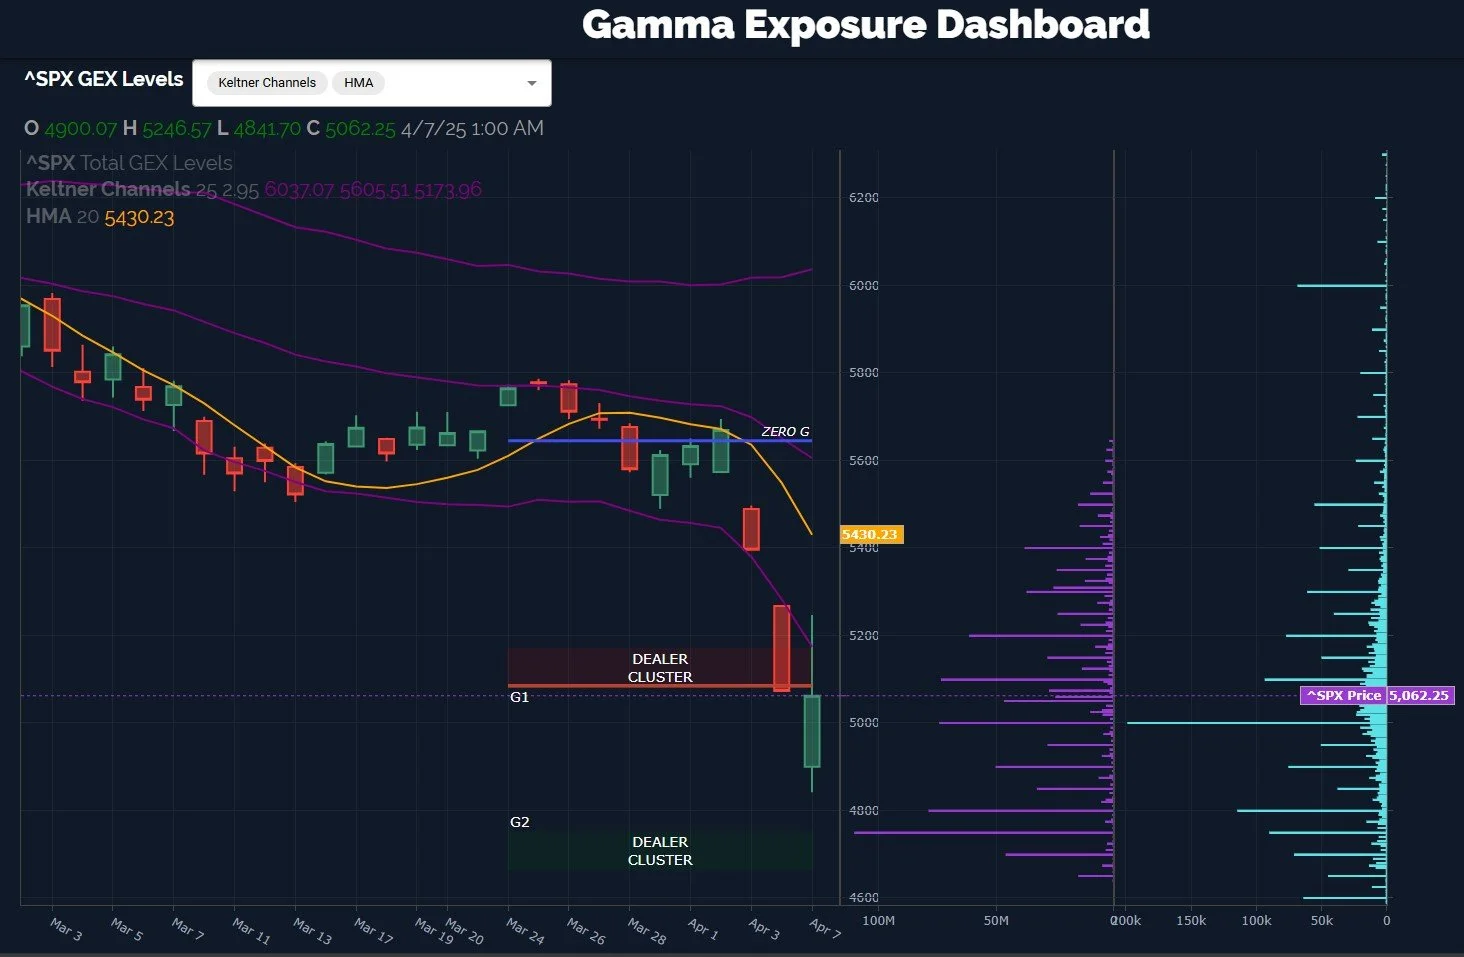
SPX is still the most problematic of the large indices in terms of what GEX looks like, and that’s problematic because oftentimes SPX is the most correct in terms of eventual resolution. So 1) either SPX is wrong and SPY is correct with its more positive (though still overall negative) GEX positioning, 2) they’re both correct but over different timeframes, or 3) SPX is immediately correct and this upside attempt will be short-lived.
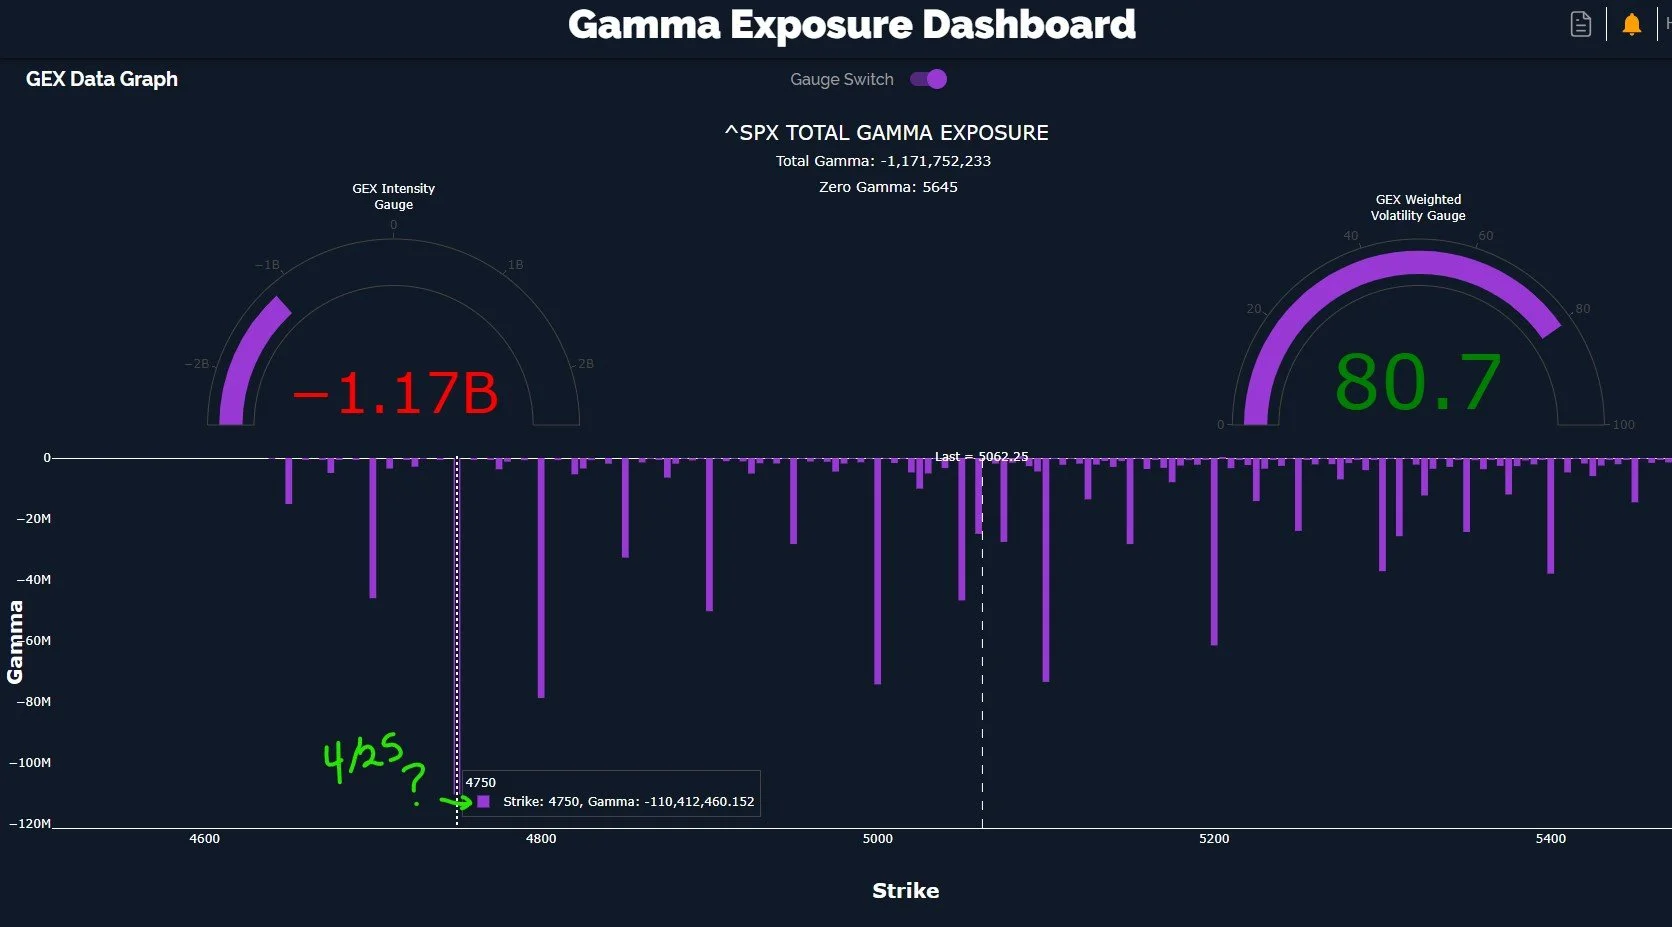
SPX shows 4750 as the largest current GEX cluster, and GEX is solidly negative despite the positive increase in GEX and price today. But the expiration on most of the 4750 GEX is 4/25, which does allow time for an upside move (as suggested by other indices as more likely) while still allowing for retracement back down later. The bottom line is that we need to watch the large negative SPX clusters at 4750 and 4800 for signs of reduction/movement if we are to adjust our expectations of a retest of lows or a new lower low.
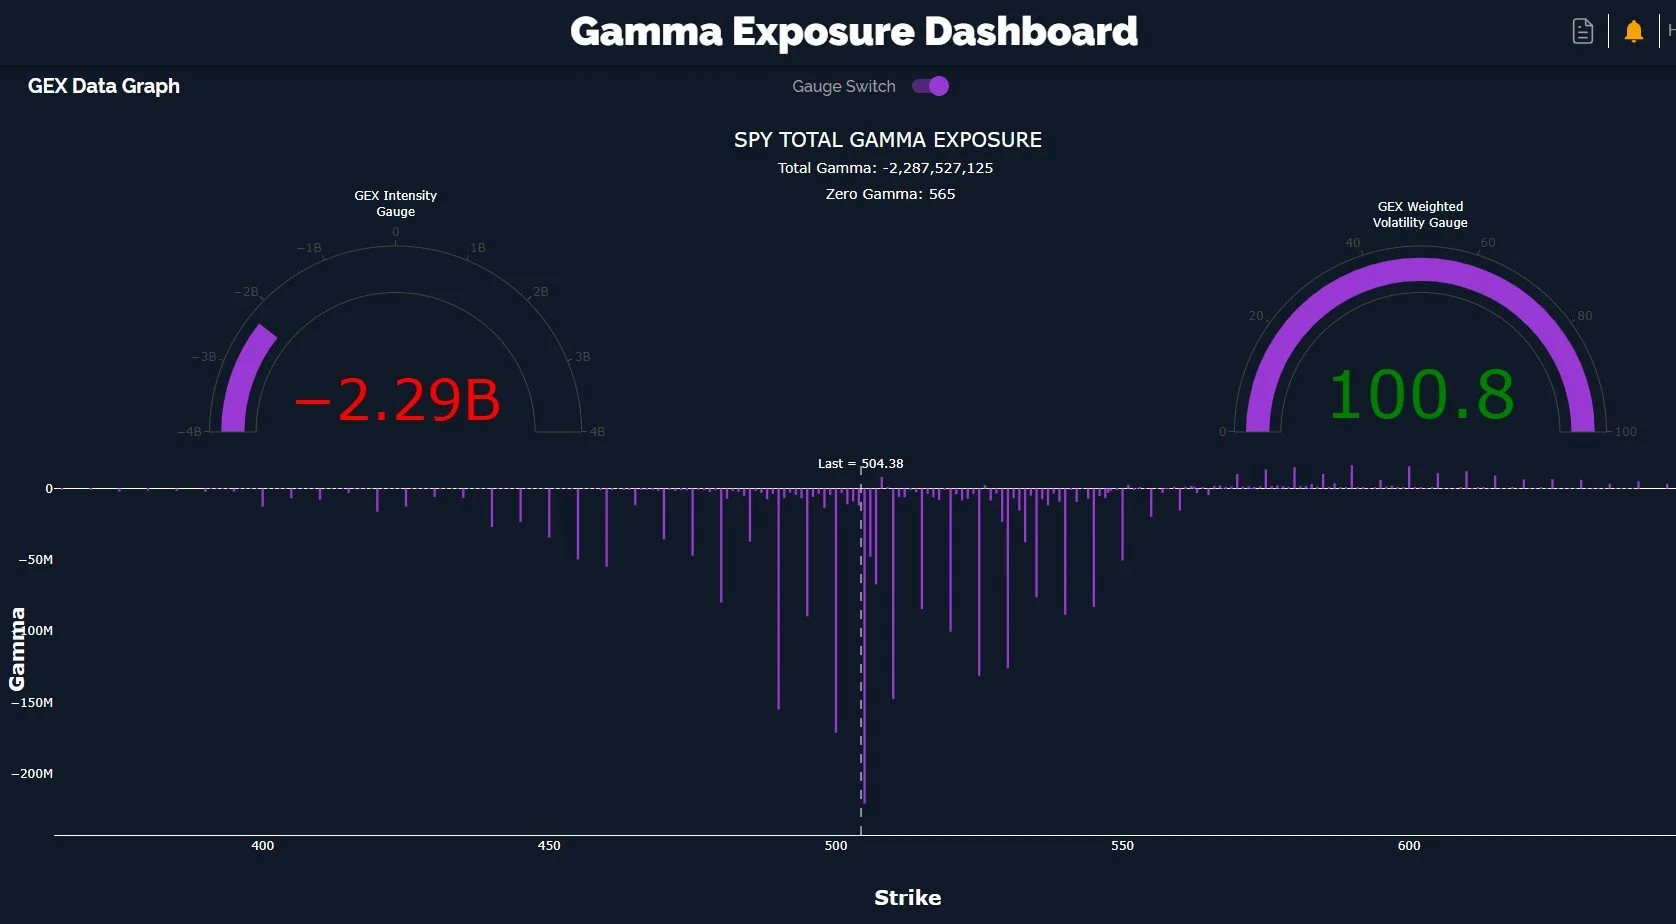
SPY below shows a lack of meaningful interest below 490, though if SPX proves to be correct, we would expect to see lower strikes grow for SPY. Holding above the big negative cluster at 500 is a positive for now and corresponds to SPX holding above 5000, also a positive sign.
Given the extreme oversold conditions by a number of metrics, we lean toward letting the current momentum continue higher for the time being, though we may quickly be looking at hedging again given the 4750 GEX cluster on SPX and the lack of growing negative GEX for most indices. We will watch intraday GEX shifts and act accordingly. We hope you’ll join us in Discord if you haven’t already, see the link below!
Here’s the Discord link if you haven’t joined us yet! Access is free for some channels, and new members have a 7-day trial within Discord to see how we operate. We have an active community of thoughtful traders who chime in throughout the day, sharing ideas and opportunities as we see them.
If you’re interested in accessing our tools and analytics, be sure to check out our website! We rolled out backtested algos and chart indicators and we have more improvements on the way!
If you’re interested in learning more about our strategy and approach, we address all of these topics in our Geek University course which is included in all memberships.
We recently posted a YouTube video after the market close today, and we have many other short videos, so give our channel a look if you’re curious about recent market commentary and ideas as well as gamma (GEX) concepts explained.
Thanks for being part of our community and know that we invite your feedback!
The information provided by Geeks of Finance LLC is for educational purposes only and is not intended to be, nor should be construed as, an offer, recommendation or solicitation to buy or sell any security or instrument or to participate in any transaction or activity. Please view our Investment Adviser Disclaimer and Risk Disclosure.