
Overshooting Lower Clusters, DIvergences: What’s Next?
Tonight’s YouTube video (which you can see by clicking here) covers several tickers and QQQ, which we won’t cover in the newsletter, so I think it’s worth the 9 minutes to watch for some complementary thoughts. I started writing the newsletter before futures opened, which started out with a breaktaking gap down, though so far we’ve set the low at the open and the S&P has rallied over 120 points as I type this. The reason I am telling you when I started the newsletter is because I’m going to leave most of it as I typed out before futures opened, since many of the points are still relevant, and in fact the final point pertains to Friday’s close showing huge GEX on SPX at 4800. Well, we got there quickly, taking the suggested pathway of up and then down more off of the table, and I am now watching for a potential continued bounce (risky call and strictly my opinion), then we can reassess whether or not more downside lurks ahead. I encourage everyone to consider ideas shared as catalysts to provoke your own critical thinking, many (most?) of you are smarter than I am.
The ongoing decline is already one for the history books, but of course I could also point out that the S&P effectively tripling in 5 years is even more out of the norm. Nonetheless, we use the aggregate data available to try and improve our odds of success. Thursday we noted that the Dow Jones (represented by the ETF DIA) was the only index that hadn’t yet reached the lower Dealer Cluster, where the options market indicates dealers may become buyers. We hit that area Friday, also blowing through it to the downside on the gap down. My initial contrarian reaction is a sense of interest in buying due to the extreme negative sentiment and other measures surrounding the falling knife, but the secondary reaction is to tell myself “let’s see what the data says.” So here we go, let’s start with DIA, since that’s what we were watching prior to Friday’s rout.

Some observations from the chart above:
While price closed almost at lows of the day, the lower Dealer Cluster zone didn’t yet shift, with the largest GEX (in purple) remaining at 400.
Most of the GEX is still negative, but it’s concentrated above 380. 425 stands out.
Volume was also mostly at higher strikes, except for a large amount of volume (ranking 3rd for the day) at 350.
As for indicators, we are below the lower Keltner channel, and curiously, the upper Keltner is turning higher. When I see “jaws” forming on the Keltners, I am on alert for heightened volatility in BOTH directions.
To add to this, look at the GEX change as shown on the next graph. DIA actually saw a reduction in negative GEX, though not dramatically so. A reduction in negative GEX is positive and a move back toward positive GEX.

I’ll also note that IWM showed positive divergence, performing the best amongst the big indices as far as recovering much of the day’s loss, despite not filling the gap from Thursday. In Thursday’s newsletter, I noted the weekly longer term chart showed 180 would be an area that could show some support if we lost 190, and 180 has held so far. We still see most GEX clustered between 180-200 despite volume being mostly at lower strikes, down to 170.
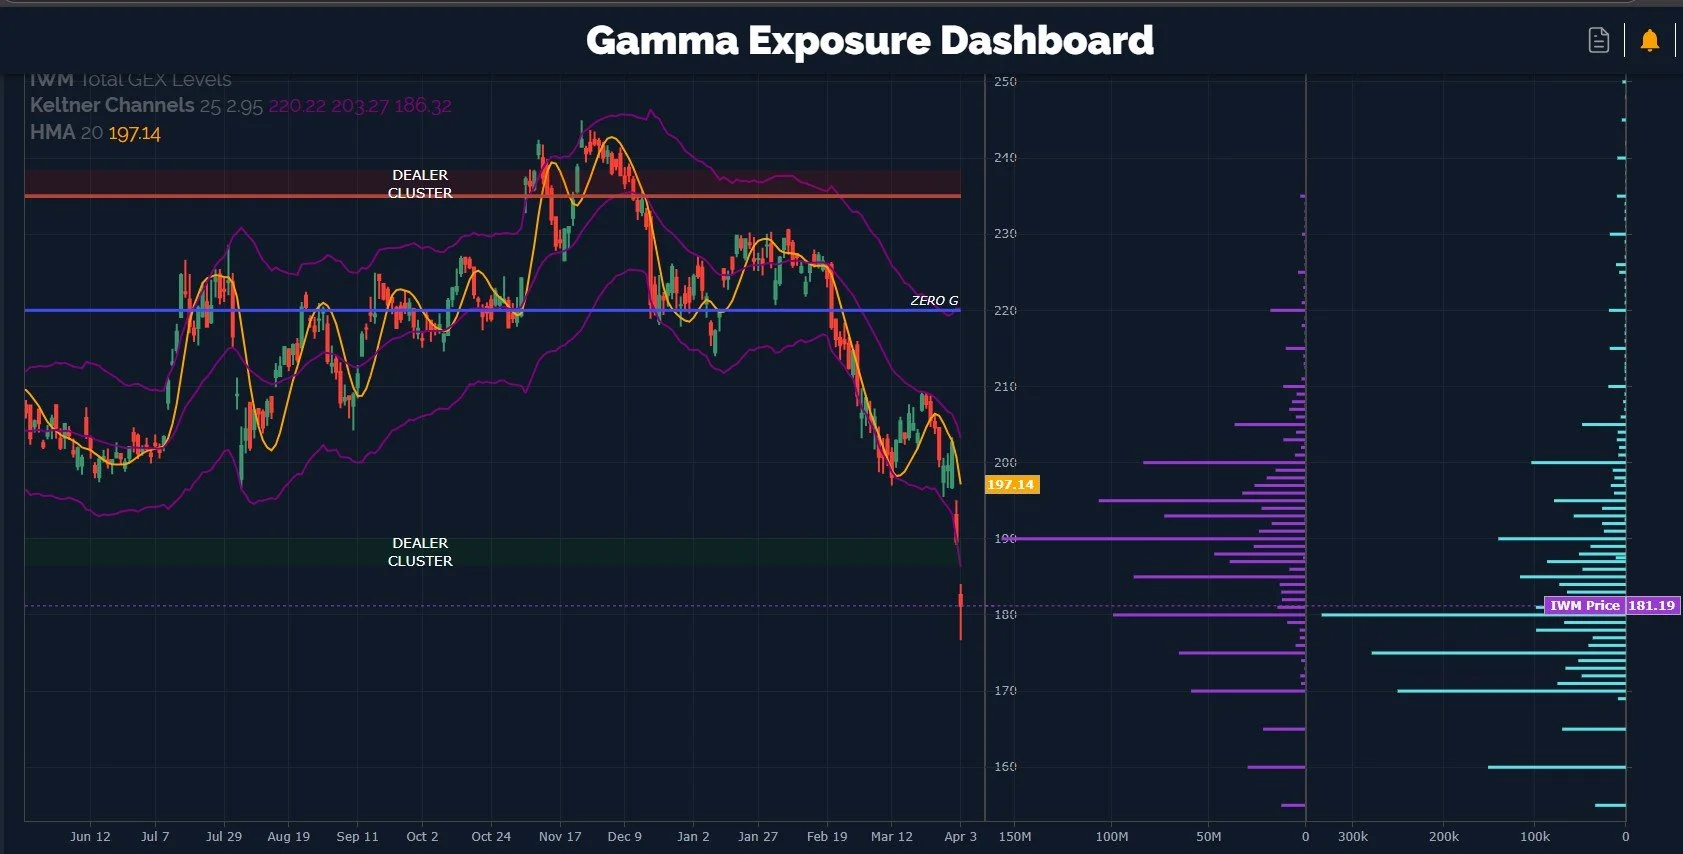
Similar to DIA, IWM also demonstrated a reduction in negative GEX. For full context, the overall picture is still negative, we are in solid negative GEX territory and charts are pretty broken, but at some point, this is how lows are made. It never looks pretty when margin calls force indiscriminate selling. At this point, we aren’t looking to predict a bottom, but we are looking at the odds of a near-term bounce and then to reassess new shorts or continuation for limping bulls to make it farther away from the slaughterhouse (pardon the imagery for the cow lovers out there).

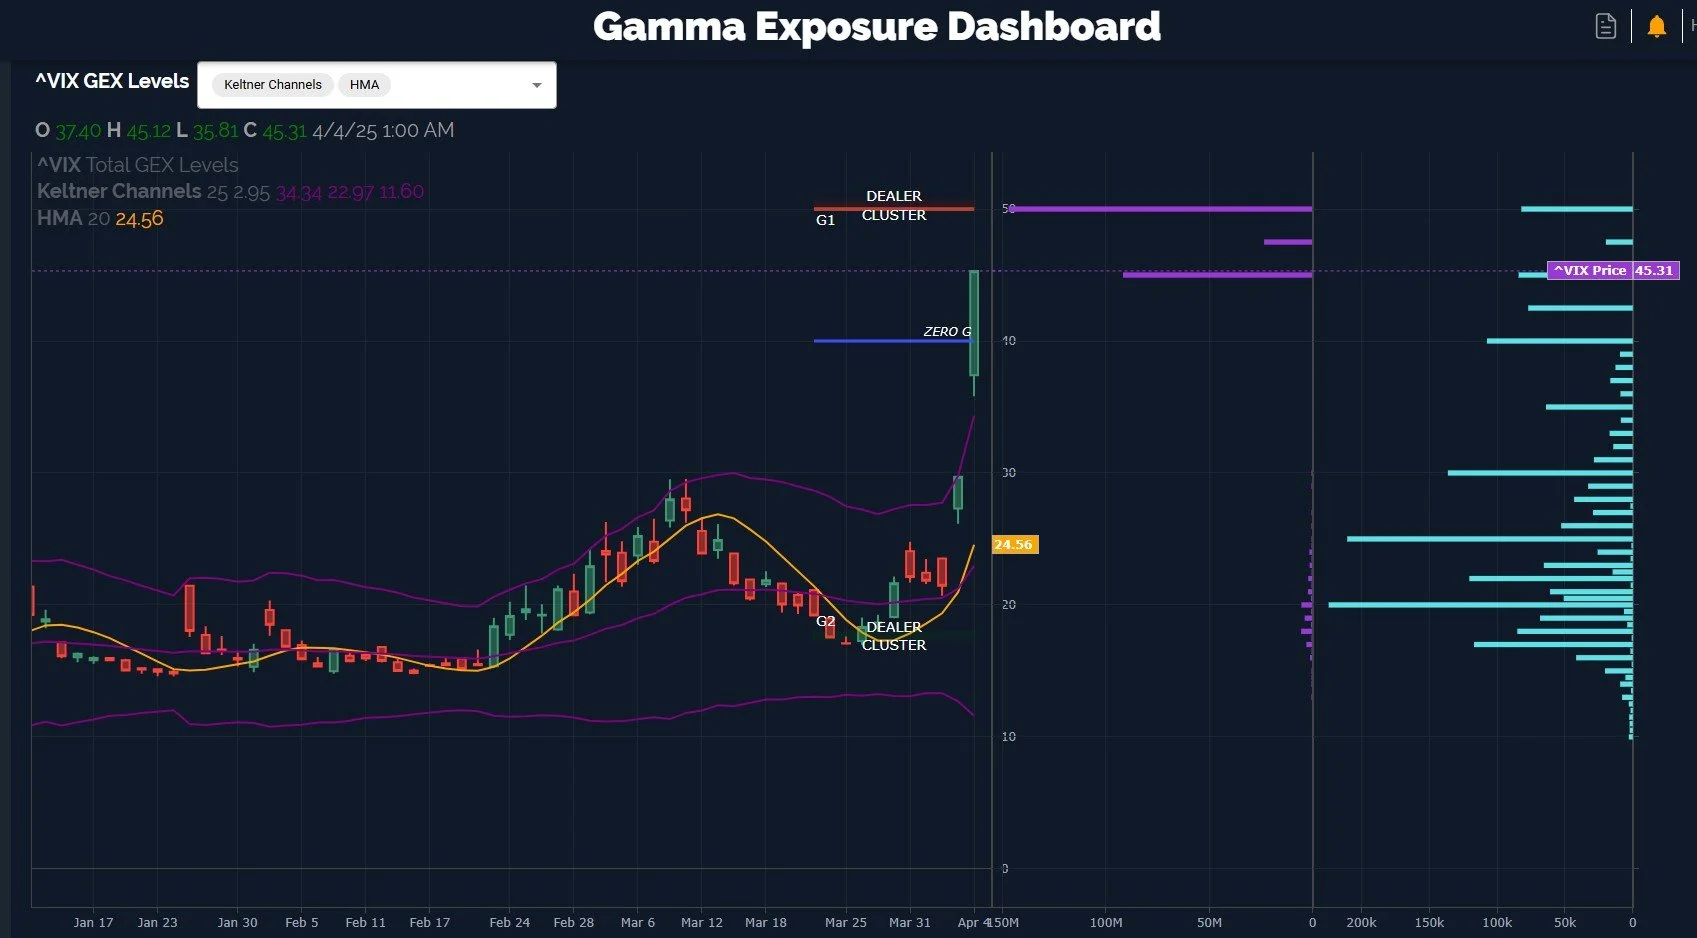
Let’s consider what the VIX is telling us. The upper Dealer Cluster zone is at 50, it’s a big cluster too, with 45 right behind it in terms of size (where we closed Friday). I notice the volume in light blue was highest at lower strikes, especially 20 and 25, which is interesting. Historical precedent says even if we hit or exceed 50, the VIX is not likely at all to sustain these levels going forward. But that might mean days or weeks, and going long too early can feel like even longer while waiting for recovery. We may see VIX hit 50 early tomorrow before a bounce materializes above Friday’s close, let’s see what happens. Let’s move on to SPX next.
SPX has perhaps the most cautious current picture, which is also contrasting with SPY, so one of the two are wrong, or perhaps both are correct but on different timeframes.
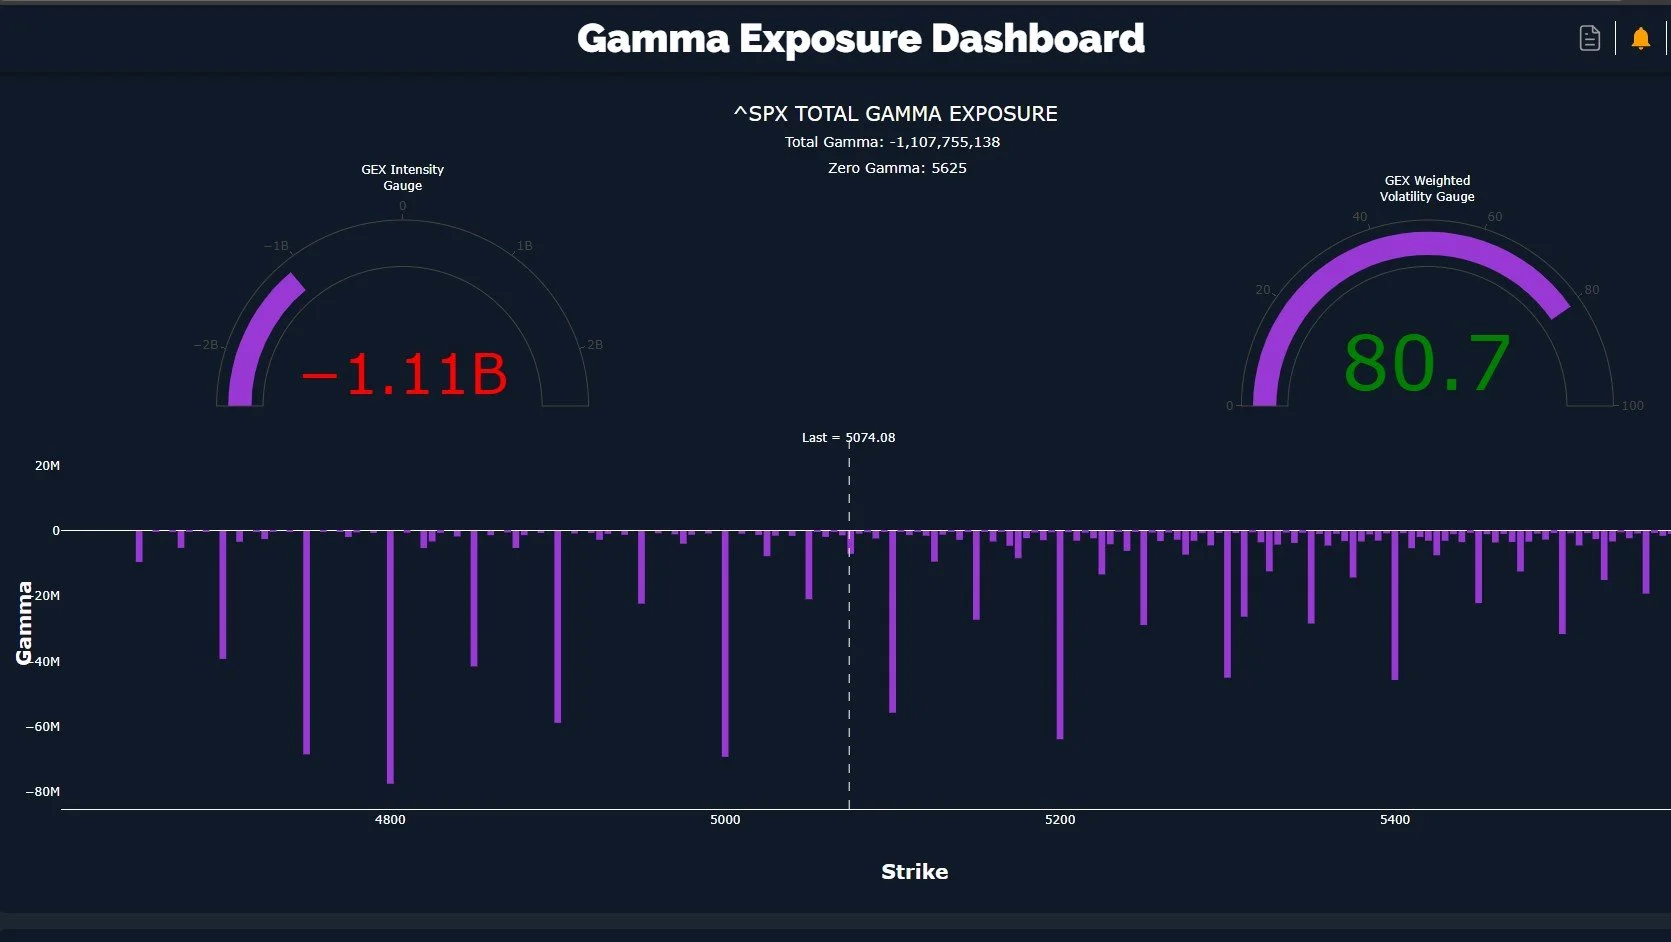
SPX saw its lower Dealer Cluster shift down to 4700-4800. 5000 remains a near-term large cluster that has to be overcome to open the doors to those lower levels, but the fact that they’re present and large is a potential warning of what awaits other indices down the road (or more immediately). Volume was still at higher strikes though, and we are way beyond the lower Keltner channel, which is a sign of being deeply oversold.
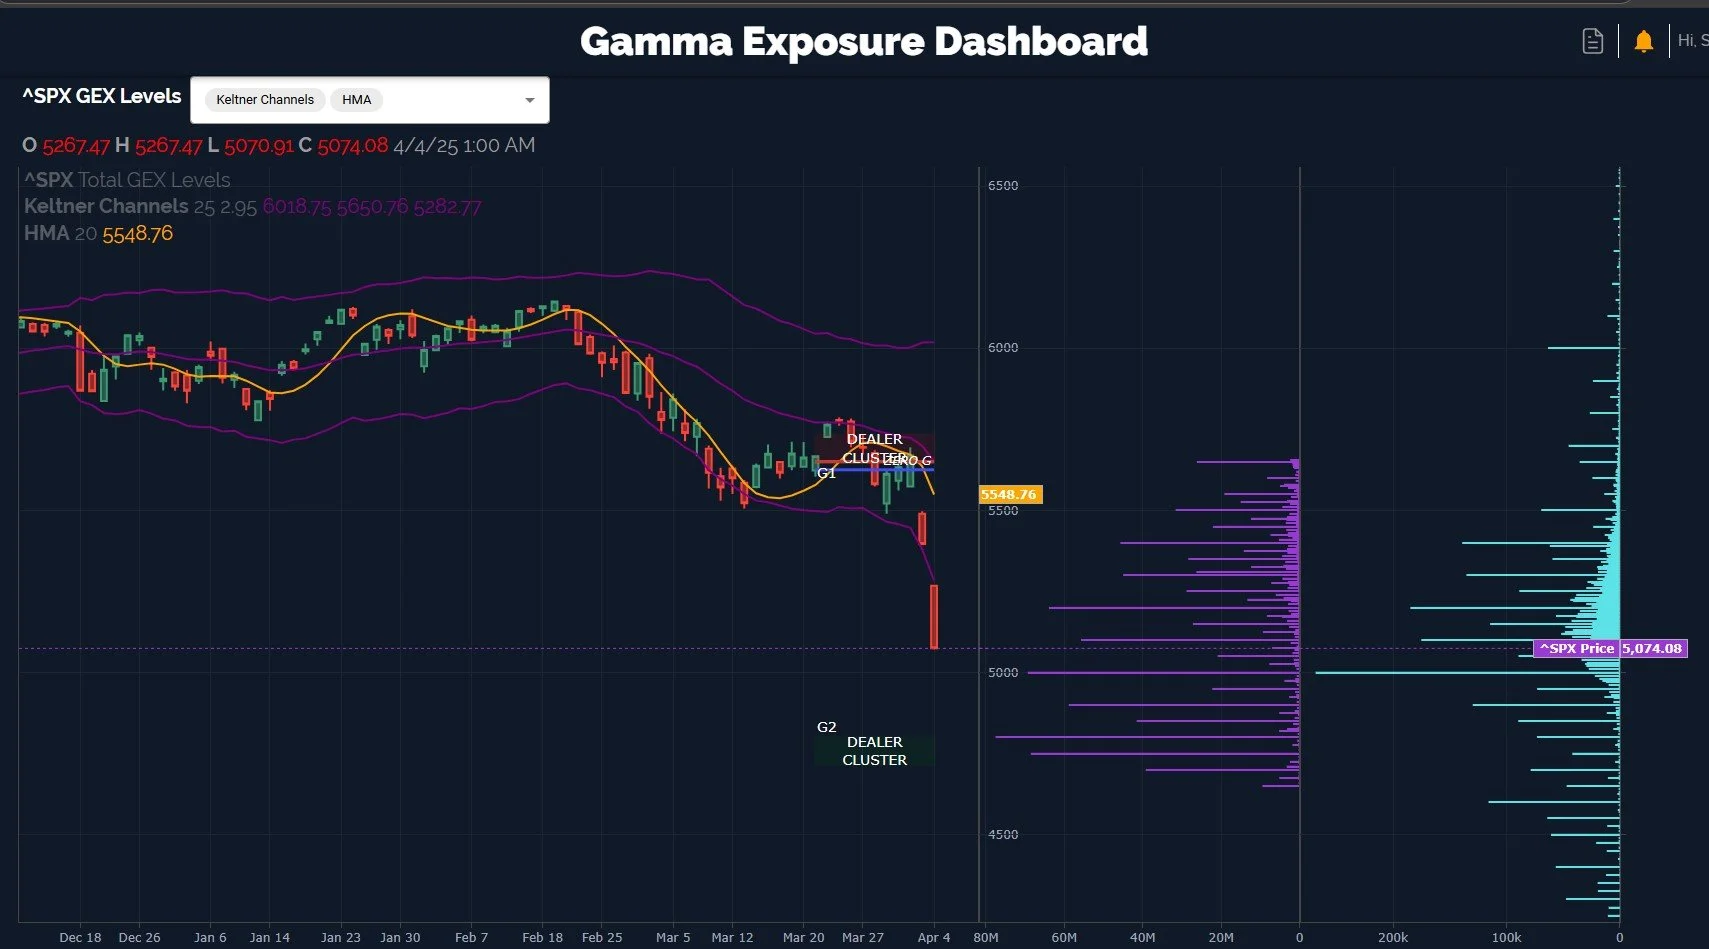
Another thing I don’t like about SPX is that GEX actually went slightly more negative, unlike IWM and DIA that we just reviewed, and also unlike SPY. As an anecdotal story, after the Silicon Bank collapse in early 2023, we saw SPY GEX deeply negative but SPX wasn’t buying it. They were quite starkly contrasting. SPX ended up being correct, and SPY was wrong, potentially impacted by the greater number of retail traders and other aspects that may make it the occasional contrarian signal. Markets rallied sharply out of that low. We see somewhat the opposite now, at least on a one-day basis.
Note SPX reflecting almost singular negativity, and 4800-4900 are large clusters below 5000. If we see a squeeze scenario to the upside, I like the idea of 5200 being a realistic target, note the large GEX cluster at that level. 5200 could be a place where a rally finds resistance.
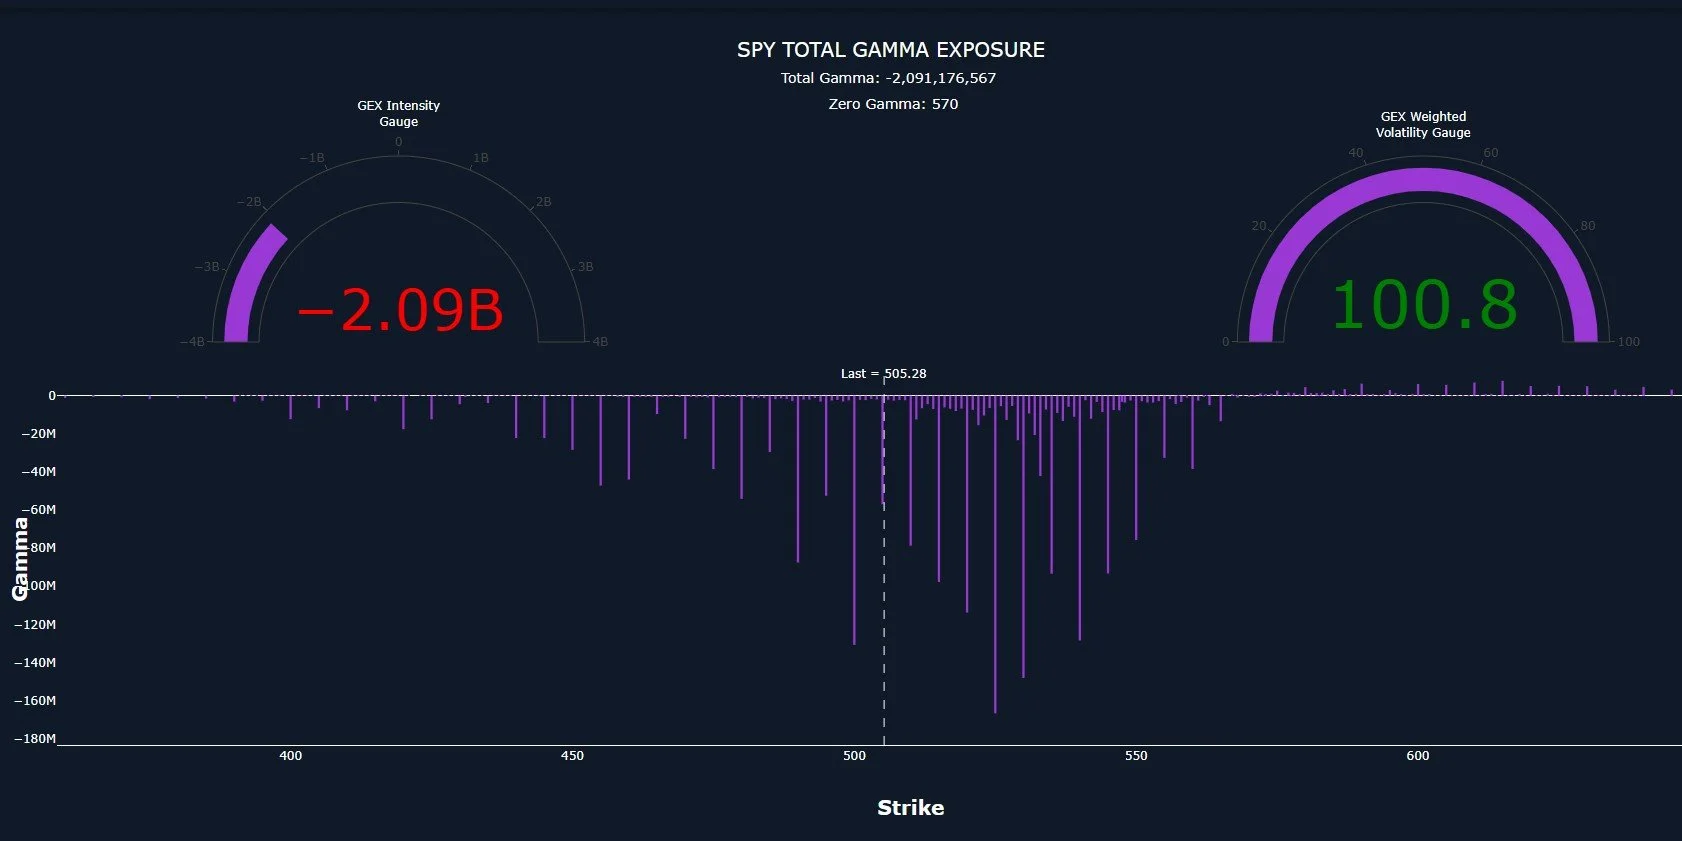
SPY still reflects negative GEX, but note how sharply the negative GEX clusters fall off below 500. 490 has a shot, but there isn’t currently much interest below that level. Meanwhile, lots of GEX remaining on the negative side at higher strikes, with 525 SPY appearing to be a likely target in a squeeze scenario.
To sum it all up, we still see an overall negative GEX picture, though we see some modestly positive divergences with IWM (both price and GEX) and GEX with SPY and DIA. SPX didn’t show any improvement, and currently indicates 4800 as a likely target, though this can change tomorrow. My speculative personal opinion is that we initially rally out of these deeply oversold conditions next week, but we have to constantly assess changes in options market positioning and the VIX with the possibility of a failure and drop to lower lows. GEX gave us a perfect 5100 target early Friday morning, which played out by the afternoon, so we will assess what positioning tells us tomorrow morning as well.
Here’s the Discord link if you haven’t joined us yet! Access is free for some channels, and new members have a 7-day trial within Discord to see how we operate. We have an active community of thoughtful traders who chime in throughout the day, sharing ideas and opportunities as we see them.
If you’re interested in accessing our tools and analytics, be sure to check out our website! We rolled out backtested algos and chart indicators and we have more improvements on the way!
If you’re interested in learning more about our strategy and approach, we address all of these topics in our Geek University course which is included in all memberships.
We recently posted a YouTube video after the market close today, and we have many other short videos, so give our channel a look if you’re curious about recent market commentary and ideas as well as gamma (GEX) concepts explained.
Thanks for being part of our community and know that we invite your feedback!
The information provided by Geeks of Finance LLC is for educational purposes only and is not intended to be, nor should be construed as, an offer, recommendation or solicitation to buy or sell any security or instrument or to participate in any transaction or activity. Please view our Investment Adviser Disclaimer and Risk Disclosure.