
One More Weekly Keltner Low Remains..
Tonight’s YouTube video addresses today’s precipitous gap down (and go down) action as well as addressing potential opportunities not discussed in the newsletter, so give it a quick view by clicking here. We do bring up additional opportunities in the newsletter, so roll your eyes once at the need to visit two platforms and then sharpen your digital pencil as you get ready to enter the arena at tomorrow’s market open with a winning gameplan. You’re already ahead of the game by reading a no-cost cheesy one-liner.
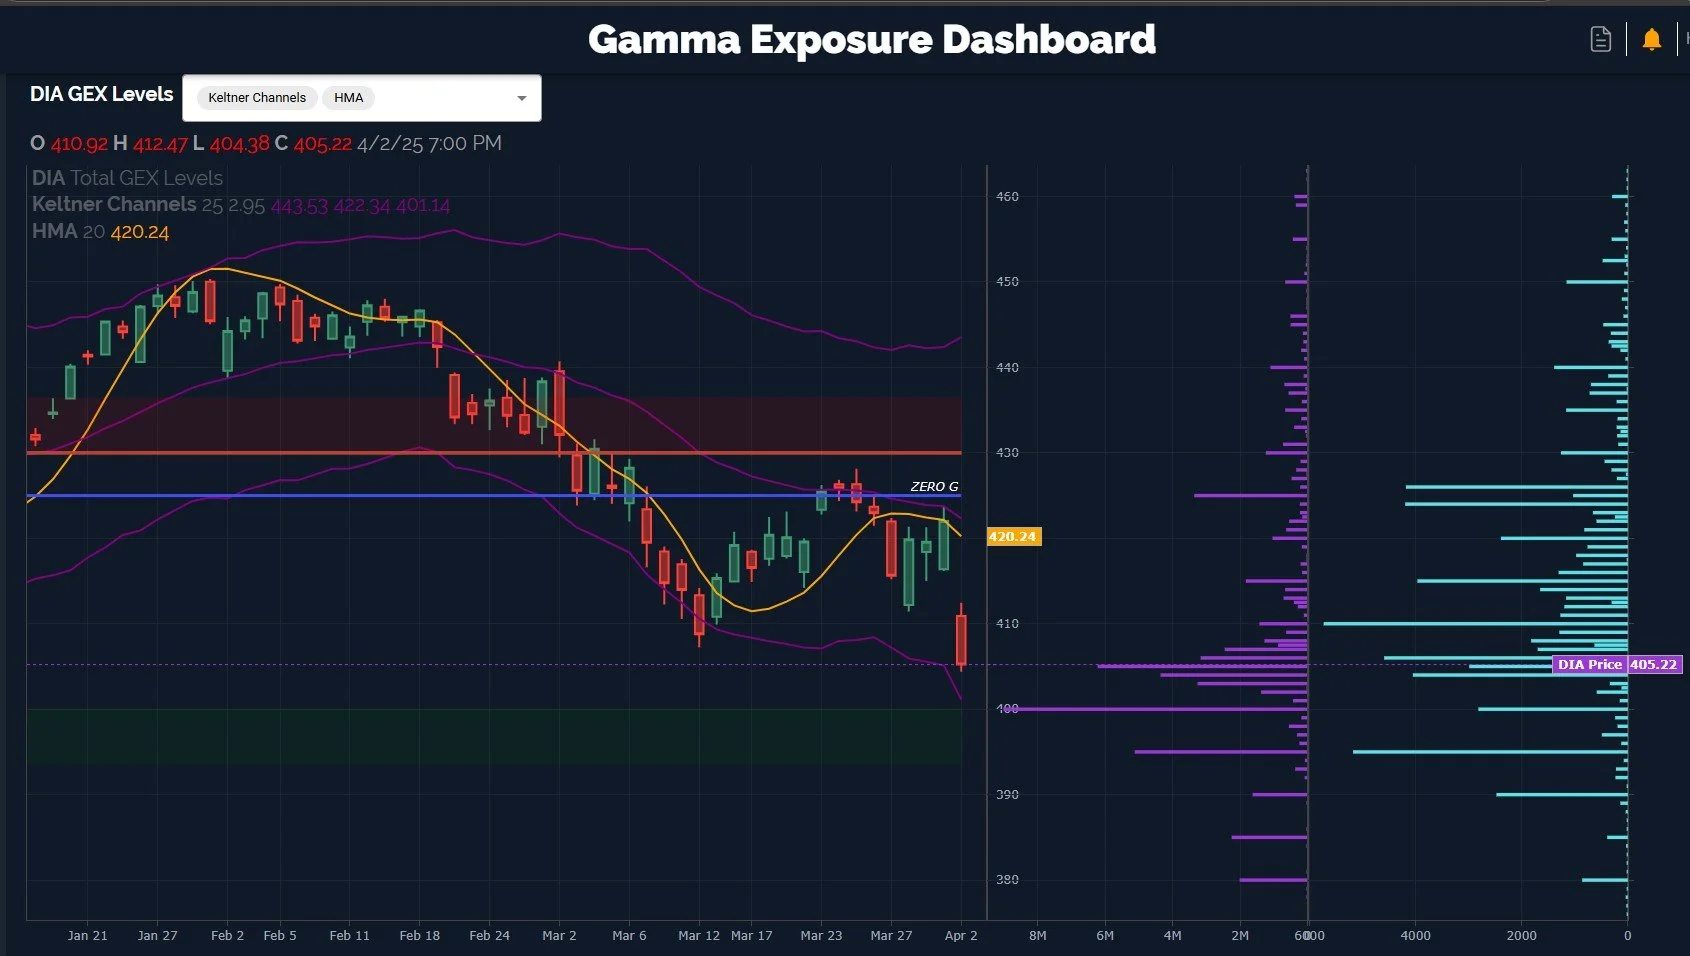
We reached our weekly Keltner targets for both SPX and QQQ, and IWM is also at the 190 area we’ve mentioned even prior to this week, so now the key is what happens next from this point. We may have one lower weekly Keltner holdout (DIA, cough cough) that has the highest-level obsessive-compulsive disorder mega traders waiting to buy this dip, though the necessary tag may be right around the corner.
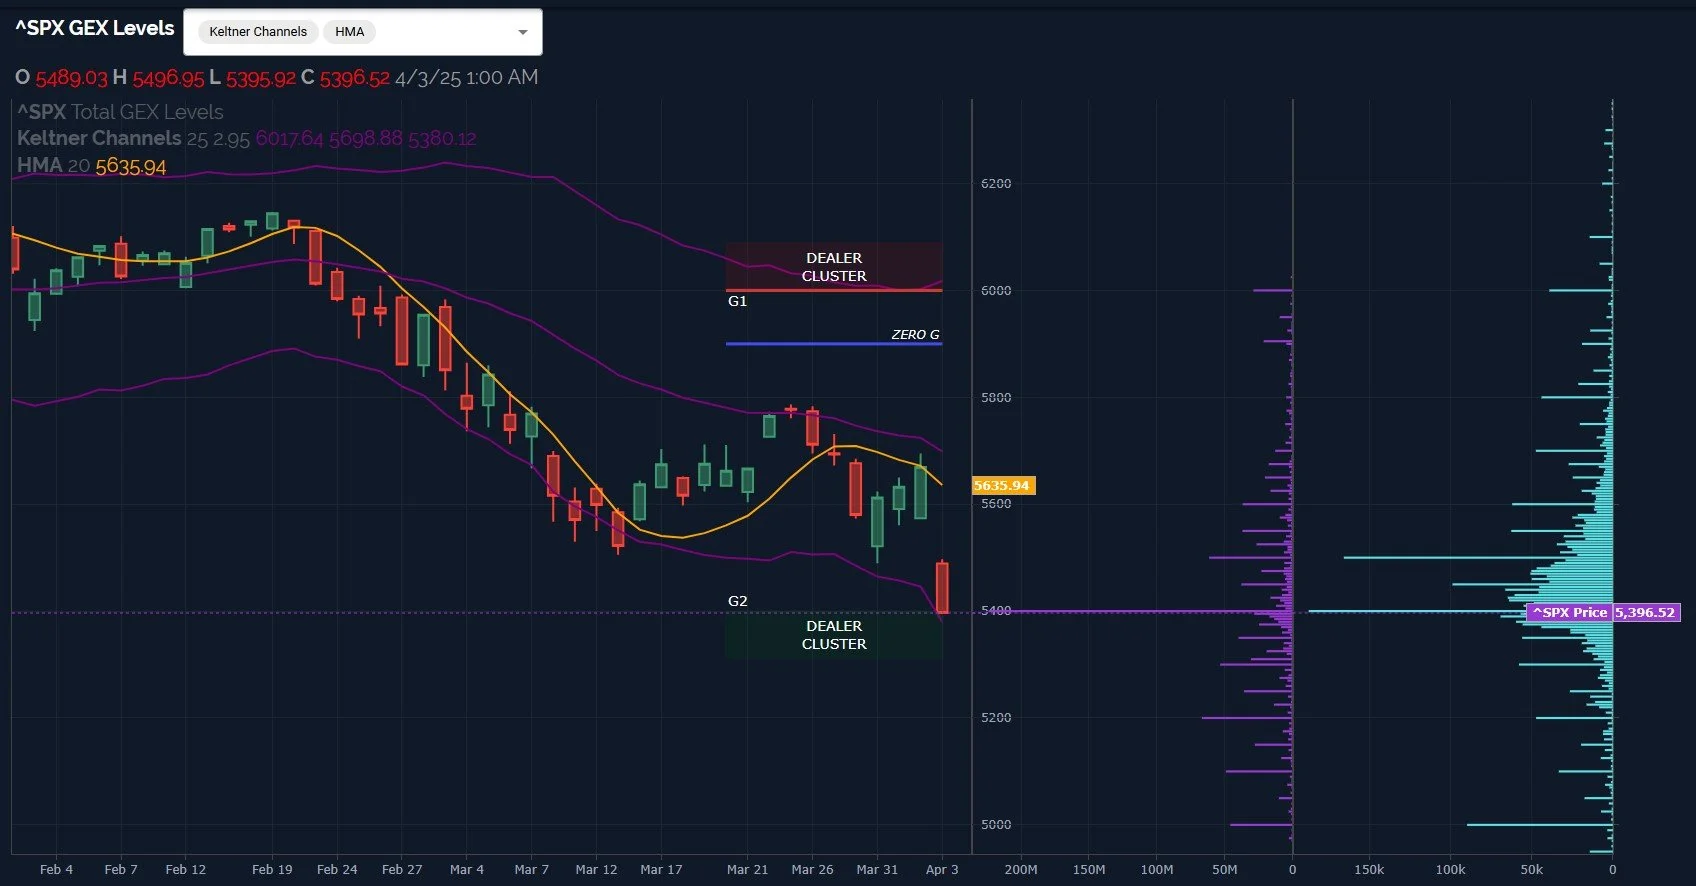
SPX closed just below 5400, in the middle of the 5365-5425 range mentioned in the weekend newsletter, so we’re now officially in the lower weekly Keltner channel territory. We also have a lower Dealer Cluster zone coinciding with this theoretical Keltner support that gives us a view of how the option market is positioned, justifying the focus on the lower weekly Keltner. The Dealer Cluster ranges from 5300-5400, where we expect dealers could potentially become buyers.
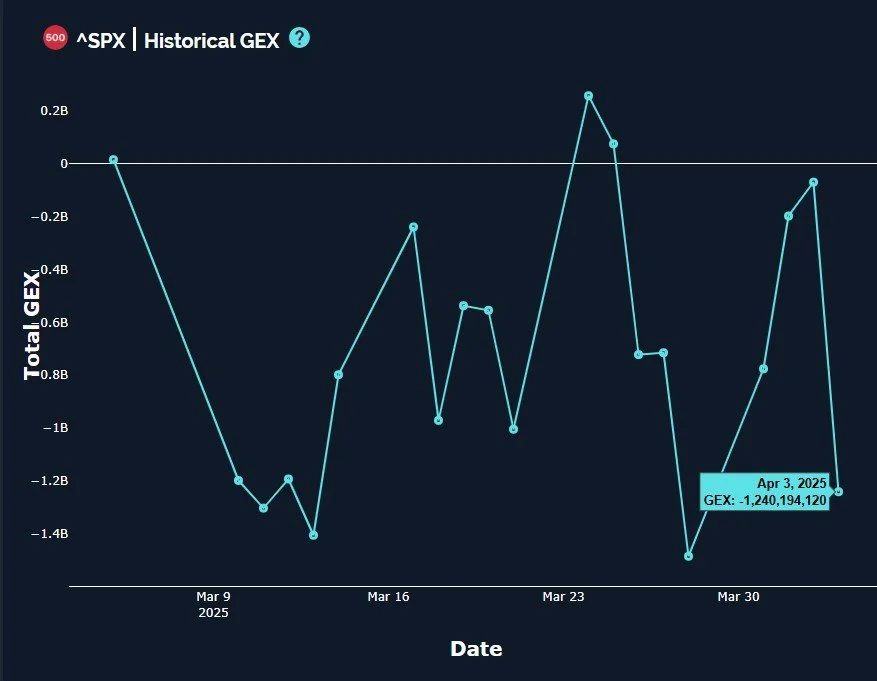
As the graph shows below, SPX dropped from almost tagging the zero GEX line back down to a solid negative position at -1.24B at the close, not at an extreme yet, but still a large change in one day.
We want to watch action tomorrow for signs (GEX and otherwise) pointing toward whether the market is ready to rebound or not, and if not, where the repositioning of the options market suggests we might be headed. We’ve brought up prior stats giving credibility to high odds of a rebound very soon, so our bias (always subject to change if evidence steers us in a different direction) is currently in the camp of a contrarian long trade materializing imminently.
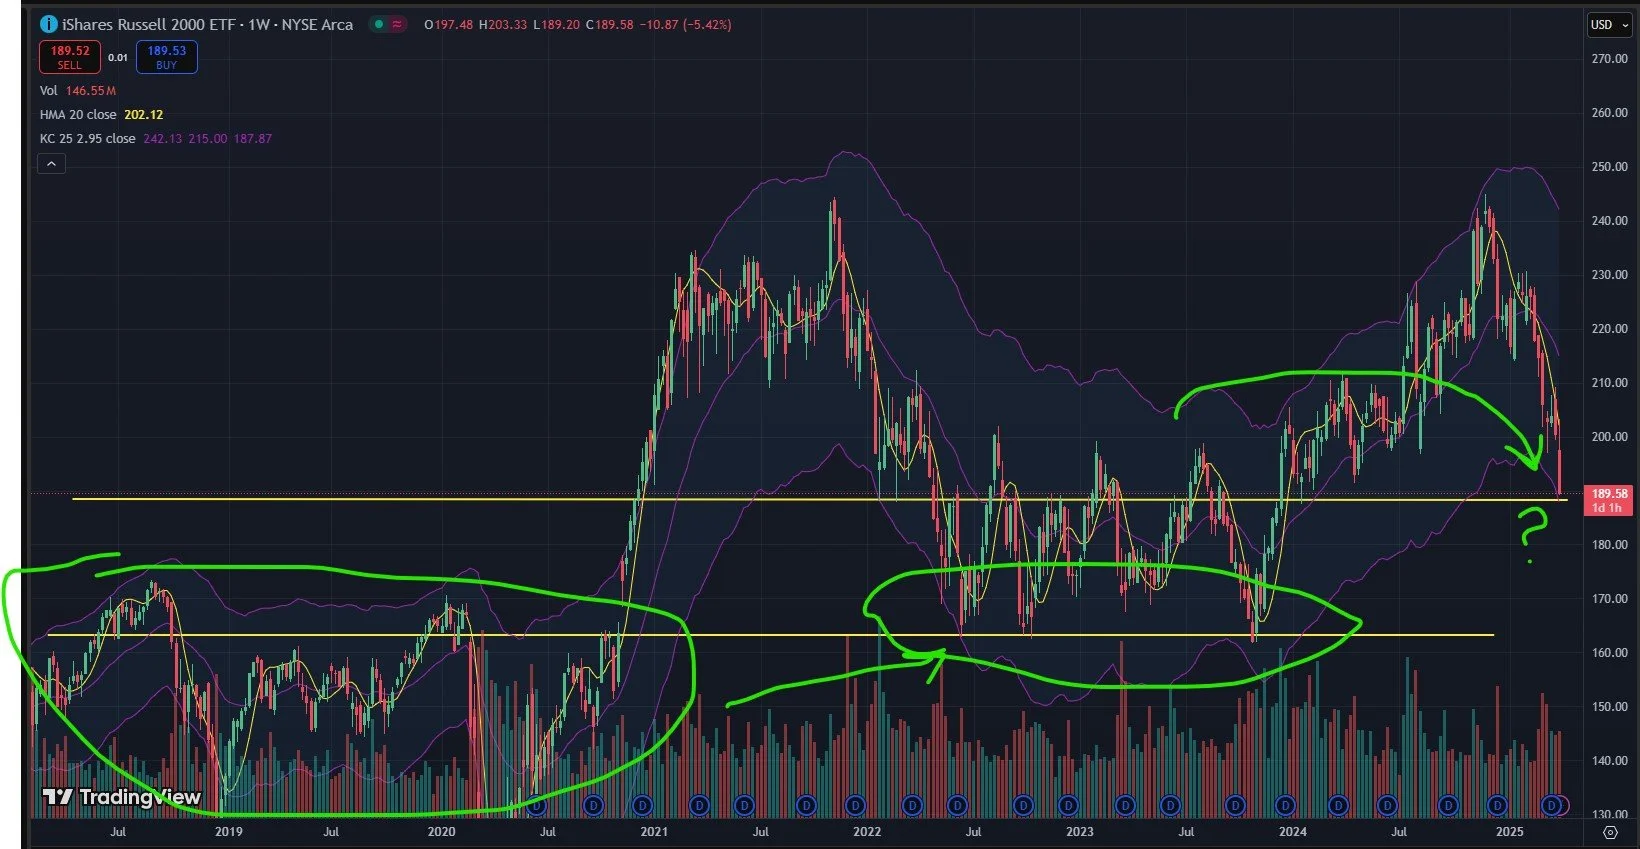
In Discord today, I posted this weekly chart of IWM, essentially showing that the consolidation highs of 2018-2020 became a support level in the 2022-2023 timeframe, and here we are 2 years after that timeframe (some might call it a…"“cycle?”) and we’re faced with the possibility of the 2022-2023 highs becoming support as we end the 1st quarter of 2025 at the same area. We don’t see significant GEX for IWM below 190, but even the best plans can be laid to waste, and I’m prepared to sustain a drop to roughly 180 while still considering this the zone for a rebound. Trade size and allowance of time become important when you’re not trying to be the hero.
As mentioned earlier, our OCD big-bank trading desk friends who managed to turn what some may consider a crutch into a sword of victory (just don’t become hoarders, please!) probably opened up their 12 screens and said “hmm, I see SPX, QQQ, and IWM have all reached the lower Keltner, but DIA hasn’t reached it yet. Let’s start buying everything when DIA reaches 400!” which would imply an overshoot for QQQ and SPX, since DIA hasn’t reached that lower Dealer Cluster or the lower weekly Keltner channel. I’m half-joking, of course, but it makes sense to me. There’s always some math involved in large participants’ decisions, right?
Regardless, we also see most of today’s volume at higher strikes for DIA, though 395 stands out. The odds say we’re 1-2% away from a spot where risk/reward may be good for an upside move, even if we continue dropping beyond that point.
One additional idea not mentioned in the YouTube video tonight- COST has been respecting the Hull (the yellow line), regaining support at the Hull despite gapping below it today. We have positive GEX and the largest cluster at 1000, mostly concentrated at the April 17 expiration. Volume also accompanied this focus today, showing great resilience in the face of the market falling apart. COST at least shows the possibility that if you’re long and betting on the big indices rebounding, it won’t necessarily follow those indices if you’re wrong.

Here’s the Discord link if you haven’t joined us yet! Access is free for some channels, and new members have a 7-day trial within Discord to see how we operate. We have an active community of thoughtful traders who chime in throughout the day, sharing ideas and opportunities as we see them.
If you’re interested in accessing our tools and analytics, be sure to check out our website! We rolled out backtested algos and chart indicators and we have more improvements on the way!
If you’re interested in learning more about our strategy and approach, we address all of these topics in our Geek University course which is included in all memberships.
We recently posted a YouTube video after the market close today, and we have many other short videos, so give our channel a look if you’re curious about recent market commentary and ideas as well as gamma (GEX) concepts explained.
Thanks for being part of our community and know that we invite your feedback!
The information provided by Geeks of Finance LLC is for educational purposes only and is not intended to be, nor should be construed as, an offer, recommendation or solicitation to buy or sell any security or instrument or to participate in any transaction or activity. Please view our Investment Adviser Disclaimer and Risk Disclosure.