
Markets In Turmoil: Navigating Thursday’s Mayhem
Tonight’s YouTube video addresses the after-hours decline, which you can view it by clicking here. We also find a ticker or two that seem to be uncorrelated with the mayhem, which you might find interesting to add to the watchlist.
While market declines are rarely pleasant for the primarily long-oriented investing world, I was pleasantly surprised to see our anticipated highest probability pattern playing out, as advertised earlier this week:
1) Continuing rebound at least to the Hull moving average, with an overshoot to the middle Keltner channel (accomplished today)
2) Negative factors mentioned yesterday- such as the positive trajectory of the VIX with a rising Hull as theoretical technical support, and GEX not increasing sufficiently at higher strikes for indices- playing out upon rejection of the Hull breach
3) Now we are really looking at the possibility of the weekly levels we brought up late Sunday night/early Monday morning (later than usual due to family activities) being tagged, where we mentioned the decline potentially reaching 5365-5420 SPX.
Food for thought-why get wrapped up in the impossible task of predicting headlines when those headlines usually respect key levels and the odds already presented by a comprehensive view of the data beforehand? The headline might be the catalyst, but the data is often already present to show possible boundaries for upside/downside. Obviously anything is possible, but we’re looking for systems that work in MOST environments, and even today’s drop really shouldn’t shock anyone (no offense intended to those truly baffled). We didn’t know if we would continue higher after breaching the upper resistance areas highlighted, but we automatically know that it’s possible we can reject hard from those levels. That’s exactly what has happened, so we had a chart that was prompting us to consider hedges if we didn’t already have them.
Here’s the exact chart shared Sunday, which actually contains an optimistic message as well:
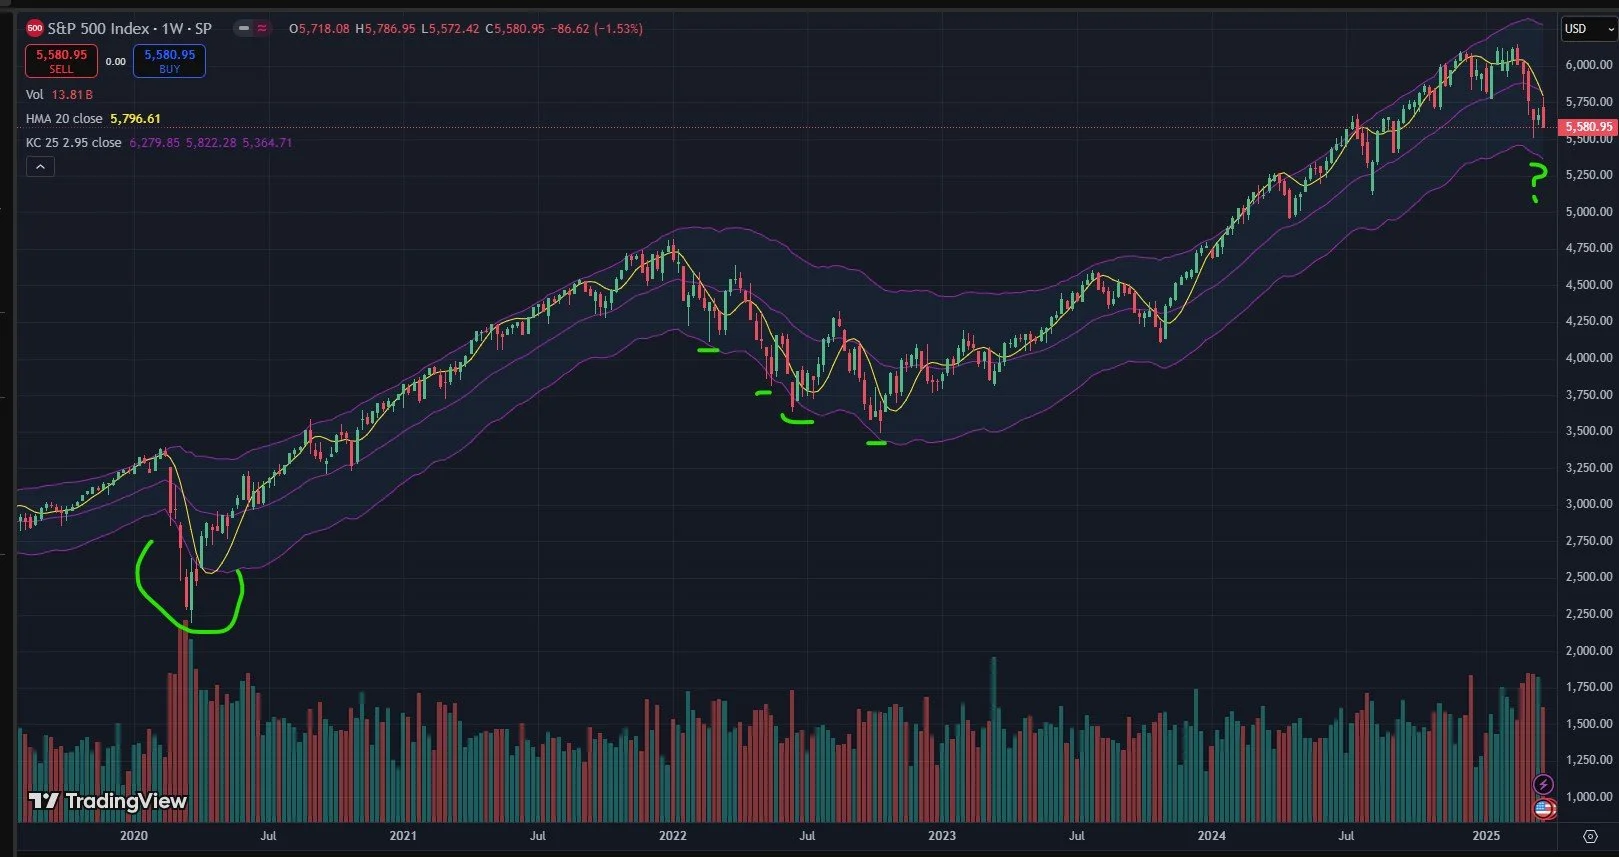
What’s the optimistic message? Well, at least for bulls, I highlighted the odds being in favor of a rebound after a breach of the weekly lower Keltner channel. Yes, it sometimes takes 2 weekly candles, but in the unusual event where two weeks were required, the rebound that followed made the wait worthwhile. I won’t be going all-in on 0 DTE calls tomorrow, but I might treat a scary low as a possible entry for a swing trade on the long side, with extra TIME being the key.

Looking at the SPY chart above, showing SPY as of today’s close, we breached the Hull (the yellow line), we tagged the middle Keltner (purple, sorry it appears dark), and then closed at the edge of the Hull. Note the lack of volume in light blue at higher strikes, also note the outsized volume at the big 550 GEX cluster. We’ll want to check this cluster tomorrow after the cash session opens to see if price is above or below the cluster, and if the cluster appears to be maintaining significant size or not.
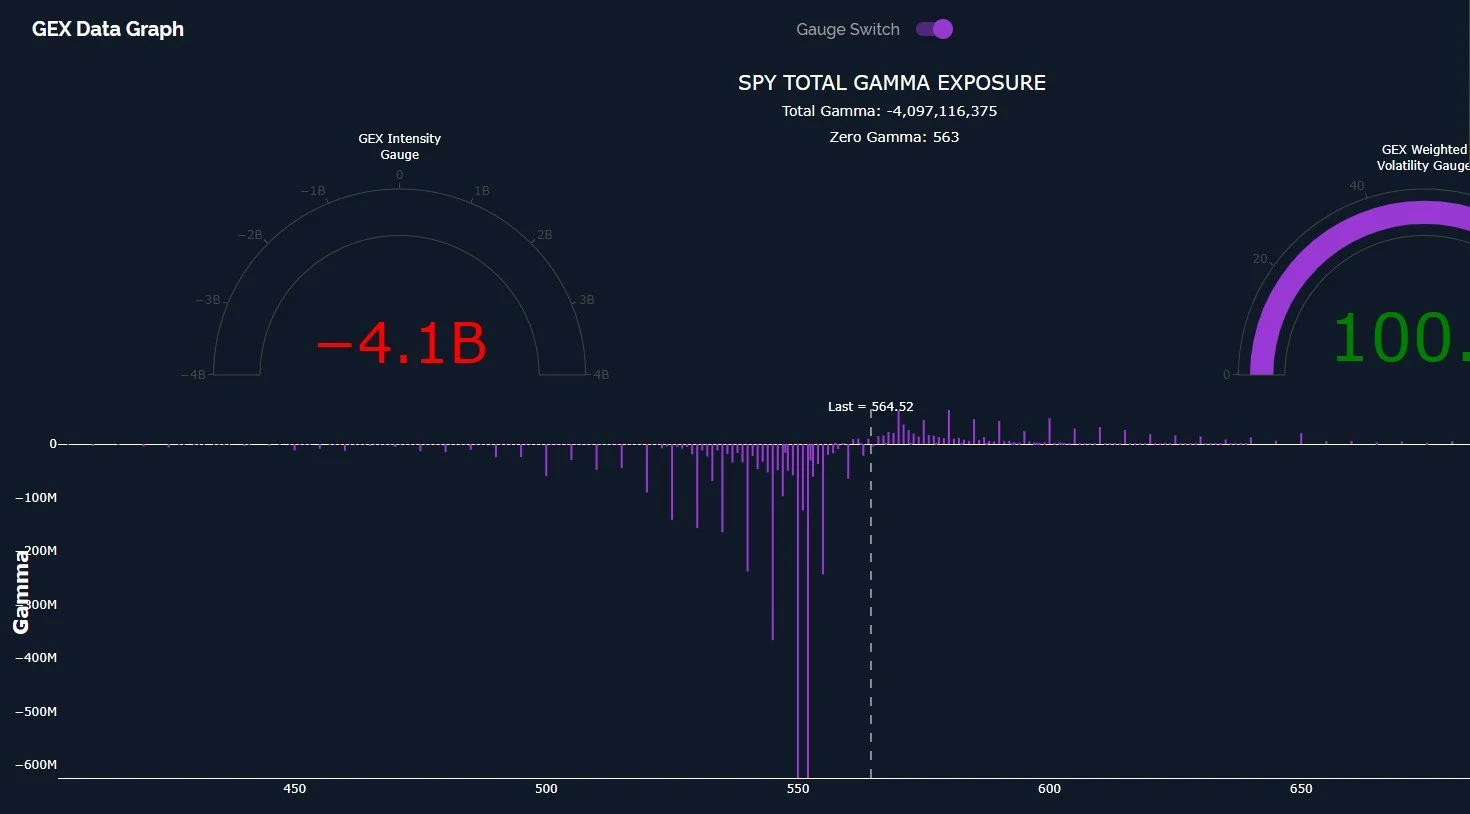
One contrarian signal we can finally check off is the presence of a negative extreme on our GEX Intensity Gauge, where GEX is compared to readings over the past 52 weeks for relative measure. SPY was at -4.1B at the time I took this screenshot, and IWM was also off the chart, so this is what we want to see when solid lows are being formed. NOT that we see solid lows forming at this moment, but this is one factor that often accompanies a rebound area. We’ll also consider other factors, including chart indicators and signals from volatility.
QQQ didn’t quite reach the middle Keltner, but it got close enough, and closed below the Hull after the breach above.
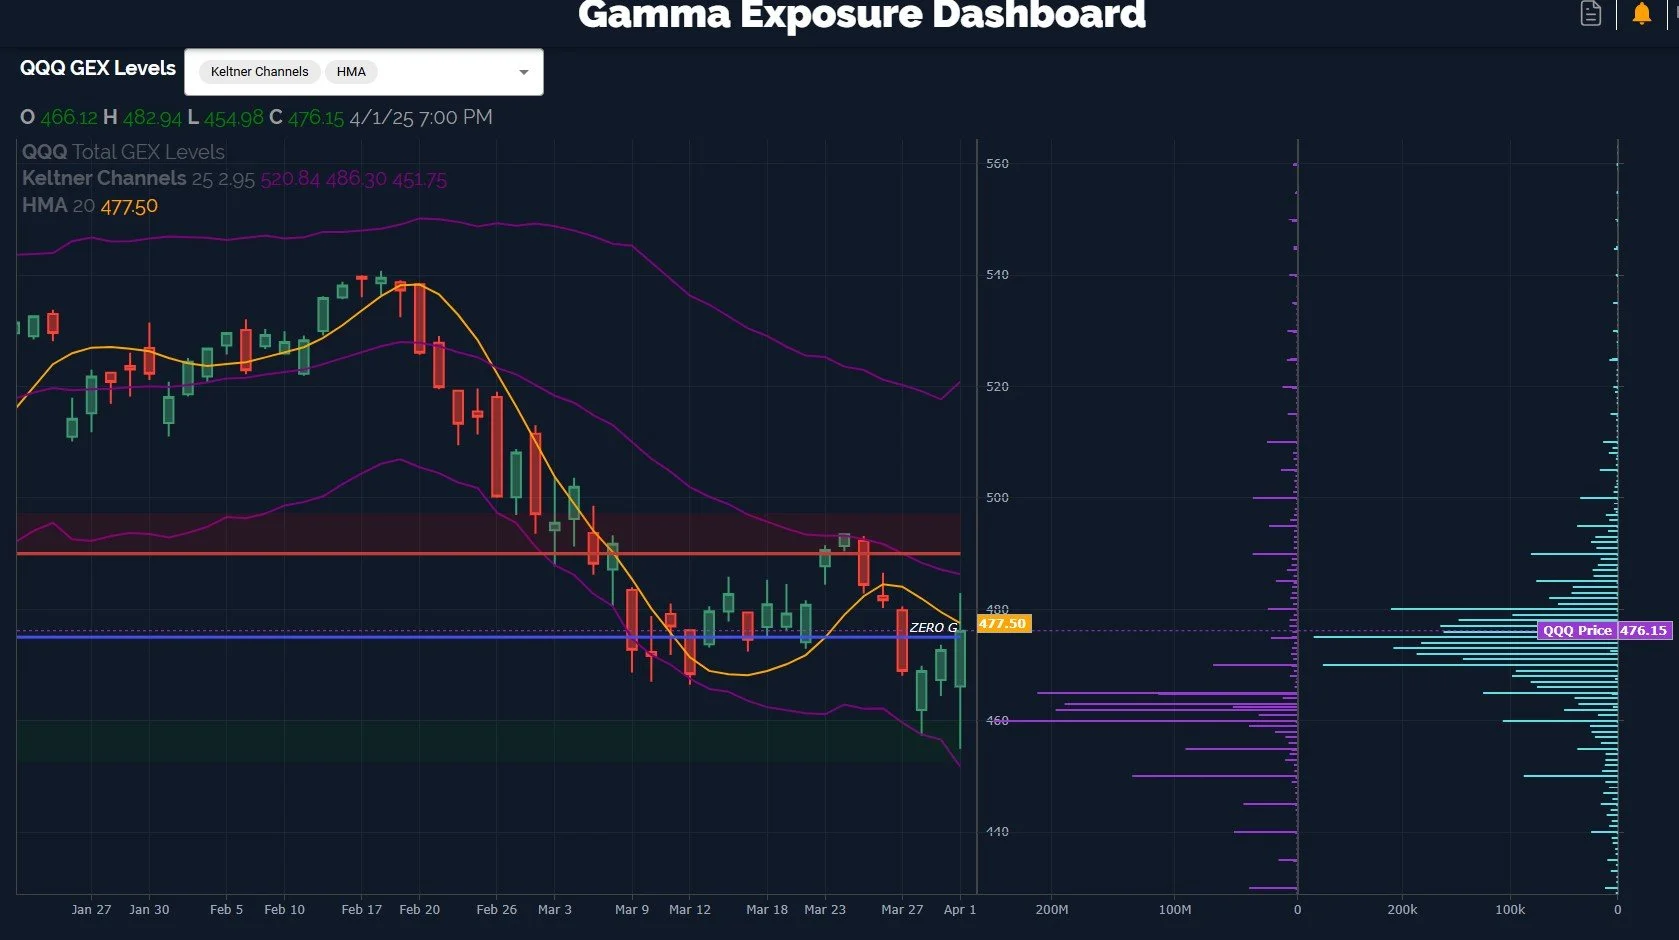
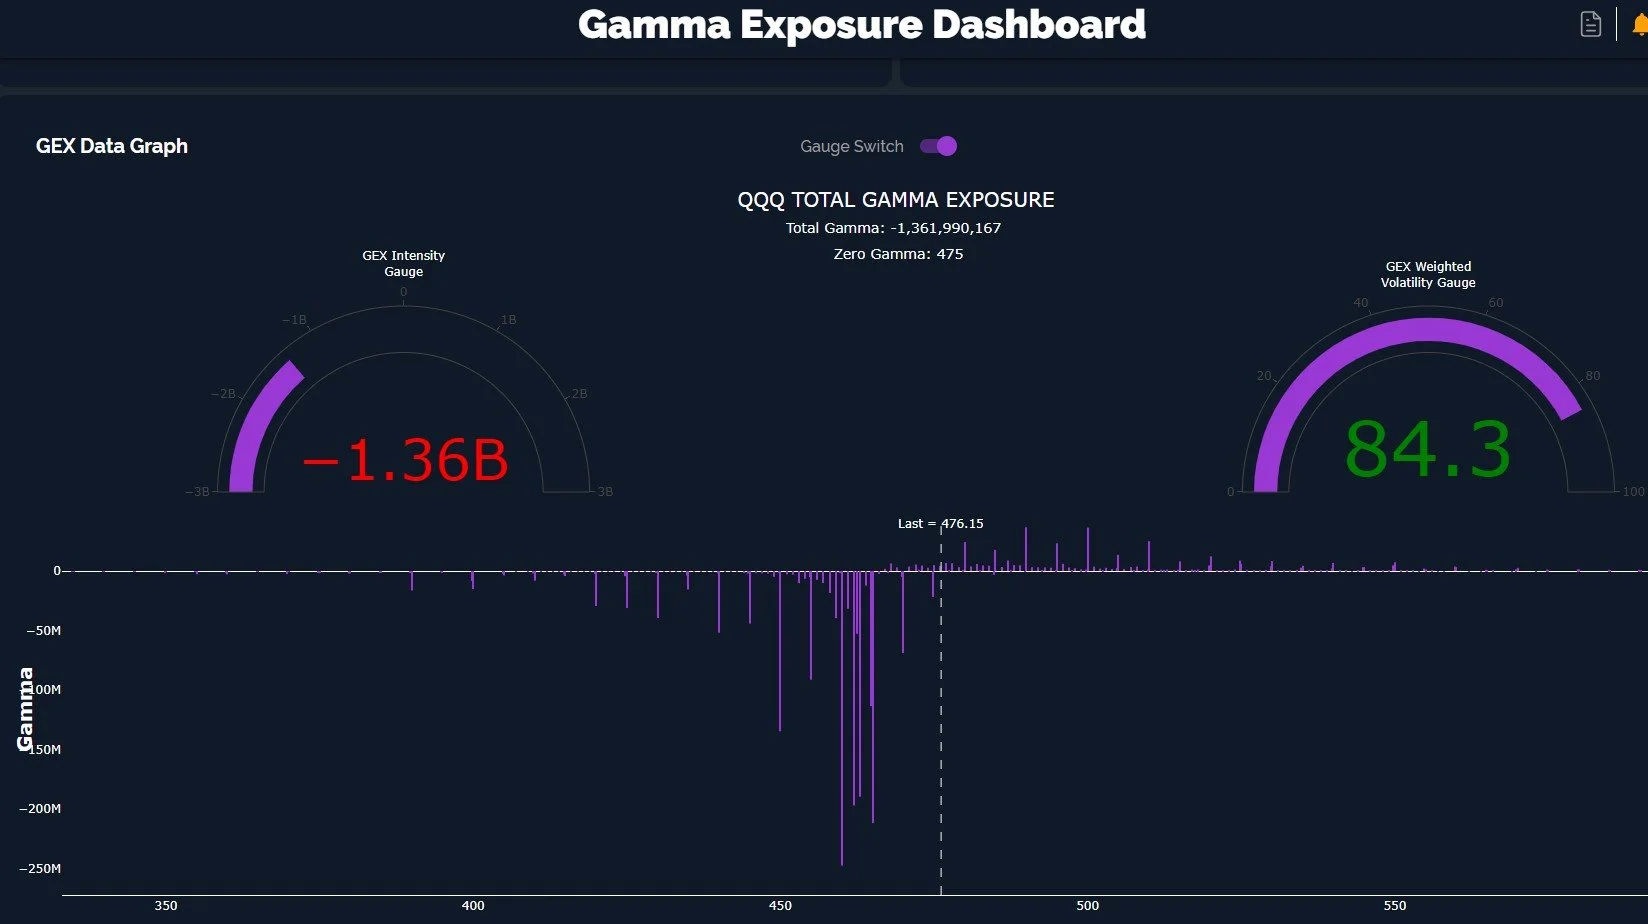
Note the solid negative GEX after hours, with GEX significant down to 450, very close to the current weekly Keltner low at 449 and change. I think it’s potentially noteworthy that the weekly and daily Keltners are within one point of each other, possibly signaling that 448-449 is an important zone for QQQ.
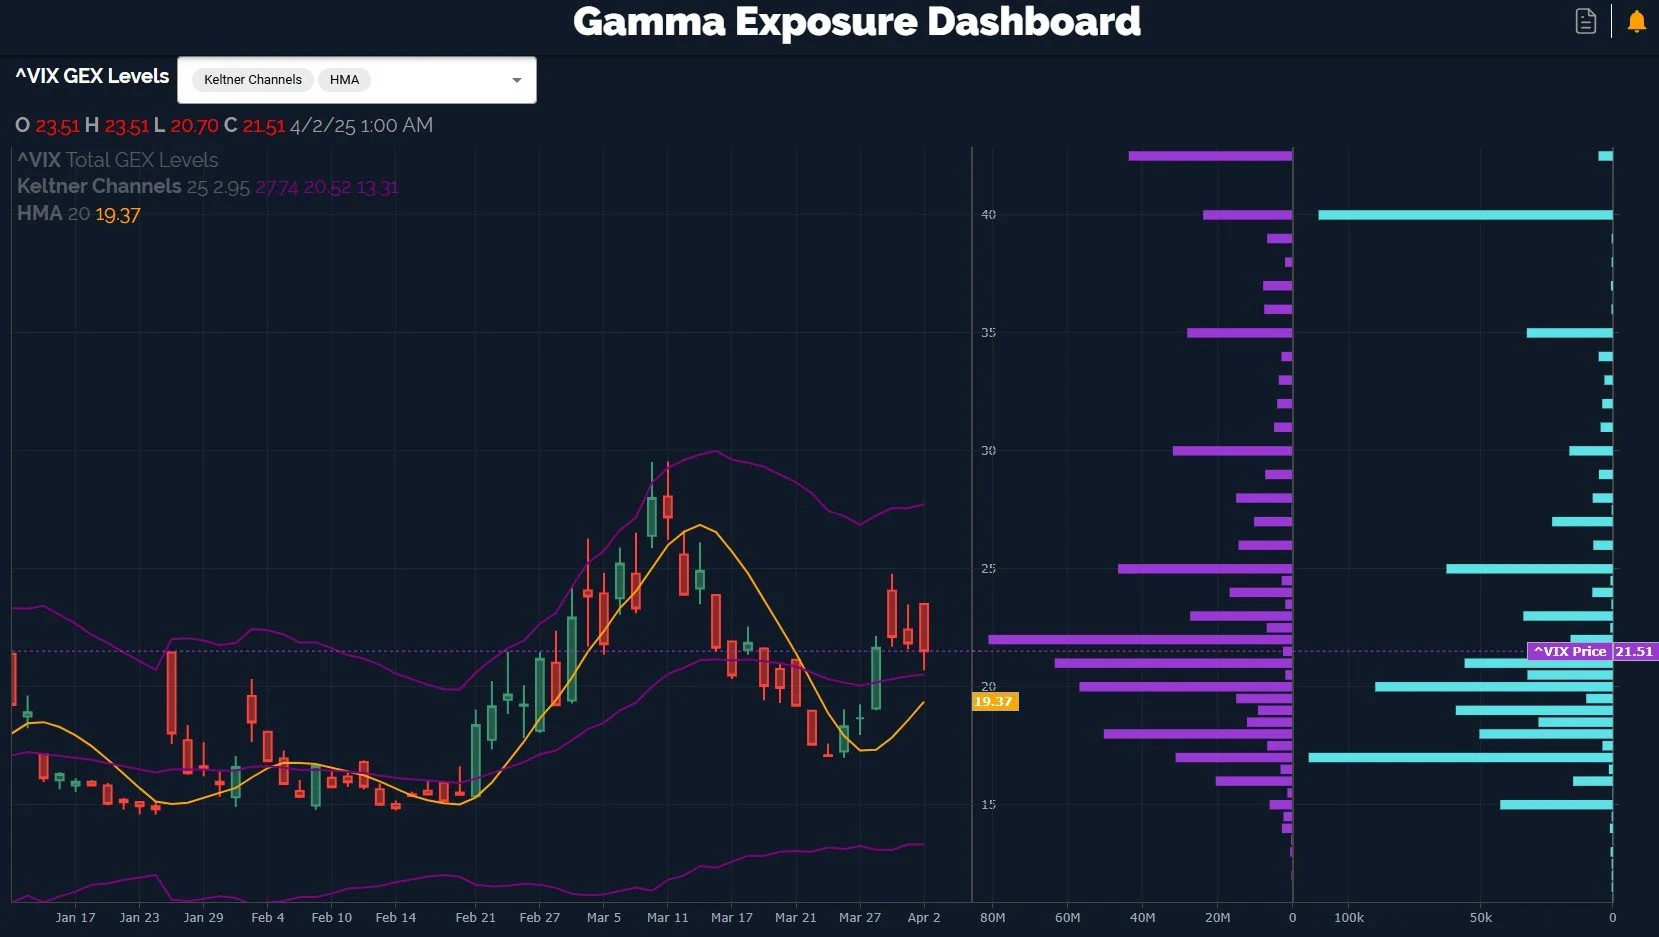
As noted in yesterday’s newsletter, the VIX presents market bulls a headwind in that it’s above the Hull and the chart leans bullish in my opinion. Today’s VIX low was a perfect retest of the middle Keltner channel, just like the indices, but from the opposite direction (testing support instead of resistance). I wouldn’t be surprised to see us reach the big GEX cluster at 25, if not 30. We saw the 2nd largest volume today at the 40 strike.
We’re finally approaching the lower targets, so the next several days will be interesting. We hope you’ll join us in Discord as we navigate the opportunities that will be presented.
Here’s the Discord link if you haven’t joined us yet! Access is free for some channels, and new members have a 7-day trial within Discord to see how we operate. We have an active community of thoughtful traders who chime in throughout the day, sharing ideas and opportunities as we see them.
If you’re interested in accessing our tools and analytics, be sure to check out our website! We rolled out backtested algos and chart indicators and we have more improvements on the way!
If you’re interested in learning more about our strategy and approach, we address all of these topics in our Geek University course which is included in all memberships.
We recently posted a YouTube video after the market close today, and we have many other short videos, so give our channel a look if you’re curious about recent market commentary and ideas as well as gamma (GEX) concepts explained.
Thanks for being part of our community and know that we invite your feedback!
The information provided by Geeks of Finance LLC is for educational purposes only and is not intended to be, nor should be construed as, an offer, recommendation or solicitation to buy or sell any security or instrument or to participate in any transaction or activity. Please view our Investment Adviser Disclaimer and Risk Disclosure.