
Approaching another Pivot?
NEW ANNUAL SUBSCRIPTION PROMO! We’re now offering $300 off of the annual Portfolio Manager! We have overlayed chart indicators and several backtested algos complete with notifications and we anticipate more near-term improvements. Your needs are our focus, and we want the platform to become indispensable for your trading! Enter code EASTER2025 at checkout to take advantage of this limited time offering.
Today saw nice follow through to the upside after closing back above the Hull moving average Tuesday, but that upside was mostly comprised of the gap up and an initial push during the early hours of the cash session. Selling eventually took over, at least to a point. We were able to alert our subscribers and Discord guests to the SPX 5470 possible upside target, the likely retracement back to 5400, and the likely pause/rebound from the 5365 area, all thanks to our 0 DTE GEX data. Let’s zoom out and take a look at the most likely path forward from here as we enter the back half of the week. Our latest YouTube video can be viewed by clicking here, so be sure to check that out as well.
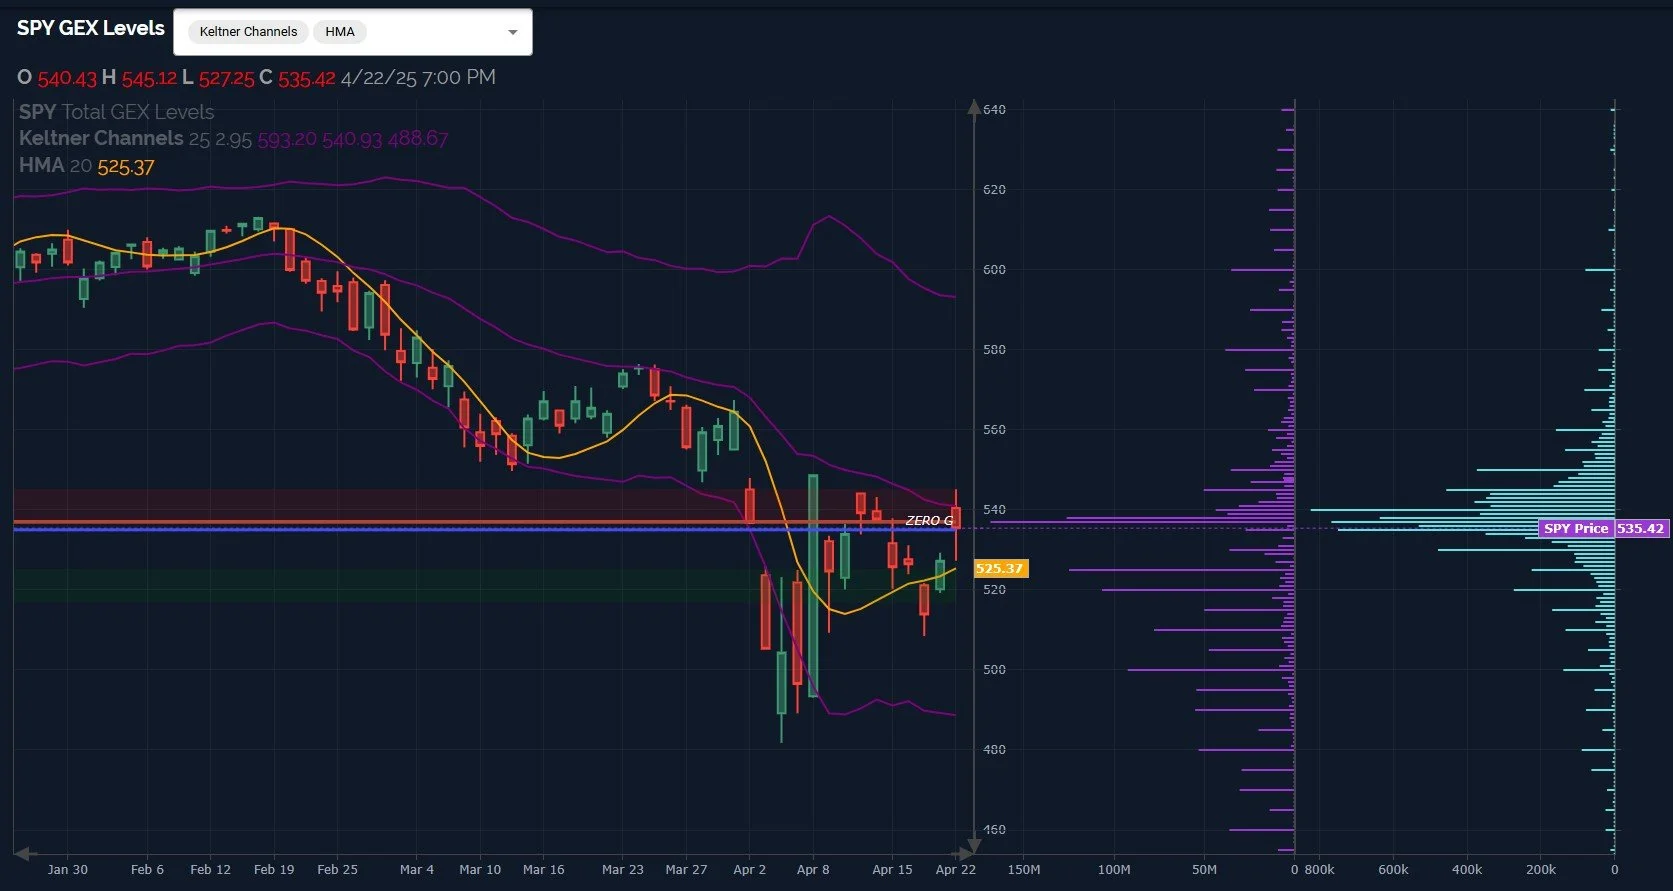
SPY is holding above the Hull so far, as you see in the chart above (the yellow line), but we’ve seen rejection of the purple middle Keltner channel so far. Perhaps even more concerning is the lack of comparatively meaningful gamma exposure (GEX) above the 540 level. The column of purple horizontal bars represents net GEX at each strike, one of several ways we display GEX data for our subscribers.
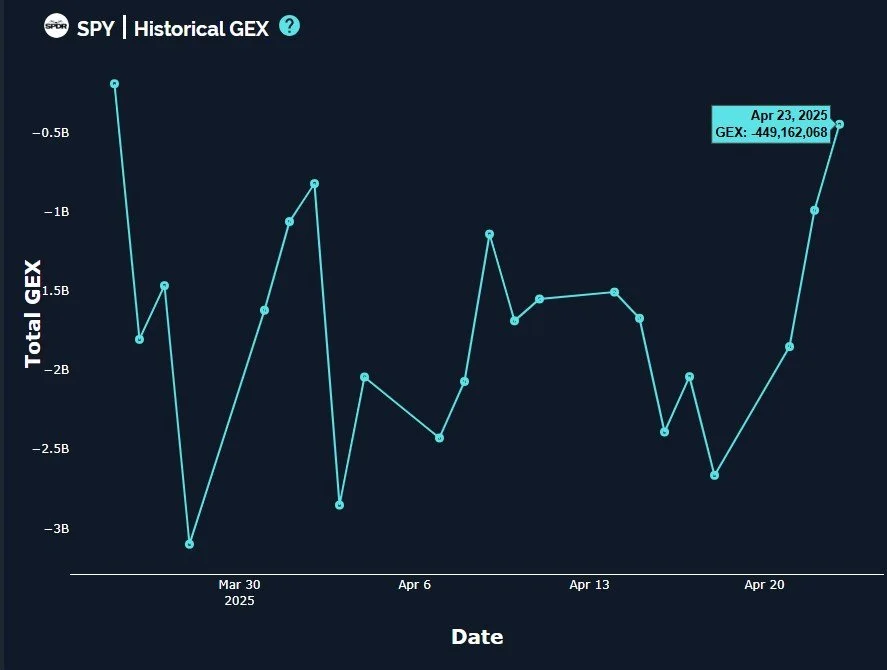
It is positive that all major indices saw another sharp reduction in negative GEX, but we need to be cautious in that GEX highs or approaching the zero line since the decline started have marked tops so far. A more constructive view would reflect an increase in GEX (decrease in negative GEX) as well as visible individual GEX clusters at specific higher levels. We also see more volume at lower strikes today.
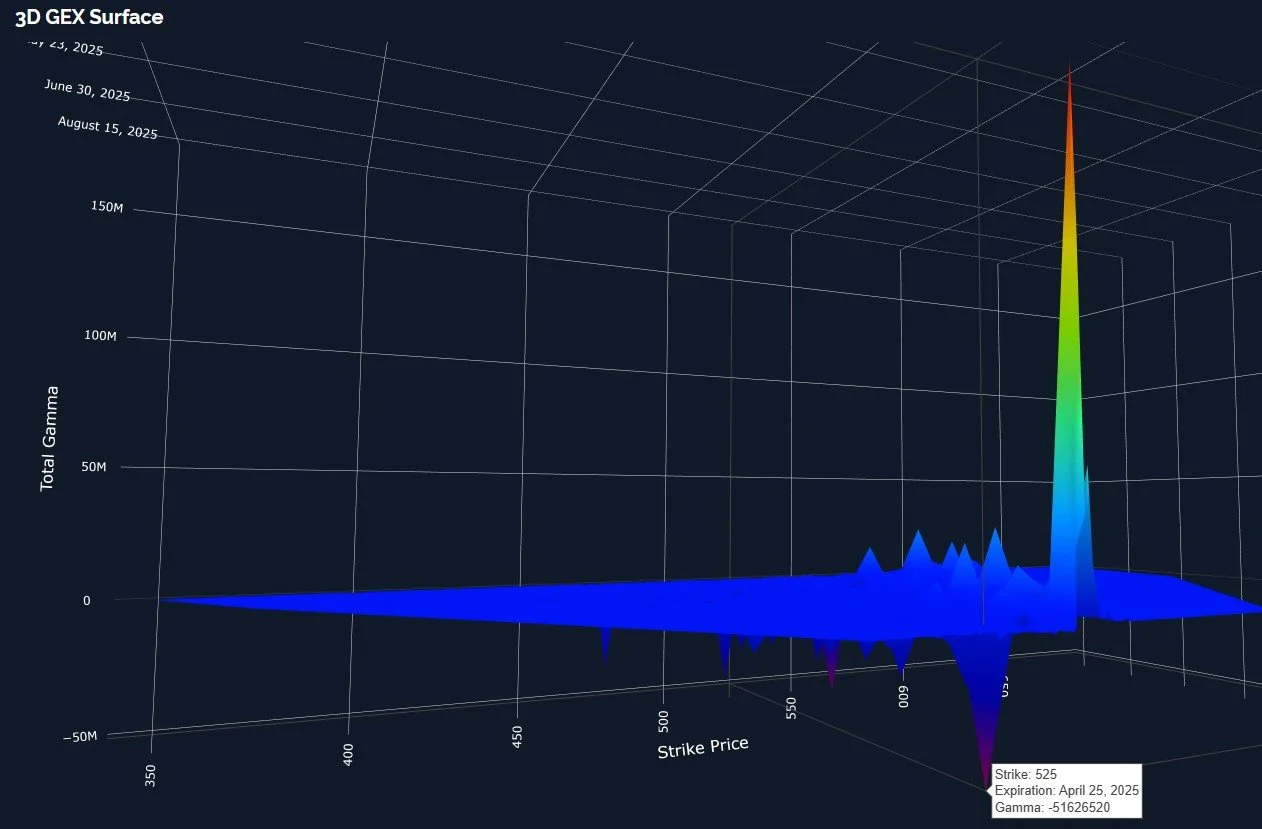
Lastly in terms of SPY, the 3D graph, which shows each GEX cluster instead of the net at each strike, shows 525 is the largest GEX cluster for Friday, so a closer look seems to tilt the odds toward the downside at some point before the week is over. Note that 525 also coincides with the Hull moving average on the daily chart, so I like the confluence. Holding above the Hull is bullish in my view from a short-term tactical perspective, but a drop to 525 is still 10 points lower, and we still need to consider other factors including the GEX outlook.
Essentially the same story for QQQ, though we’ve seen an improvement in the GEX visible at higher strikes, including 480 and 500. Comparatively, those positive clusters are still not as large as the clusters at 420 and 430. We also still see the purple Keltner channels on the chart pointing lower and to the right, though not at as steep of an angle as we saw early April.

QQQ almost reached the 0 GEX line, a big improvement compared to just two days ago. Similar to SPY, we still have recent history showing these GEX tops to also be near price tops, so caution is warranted.

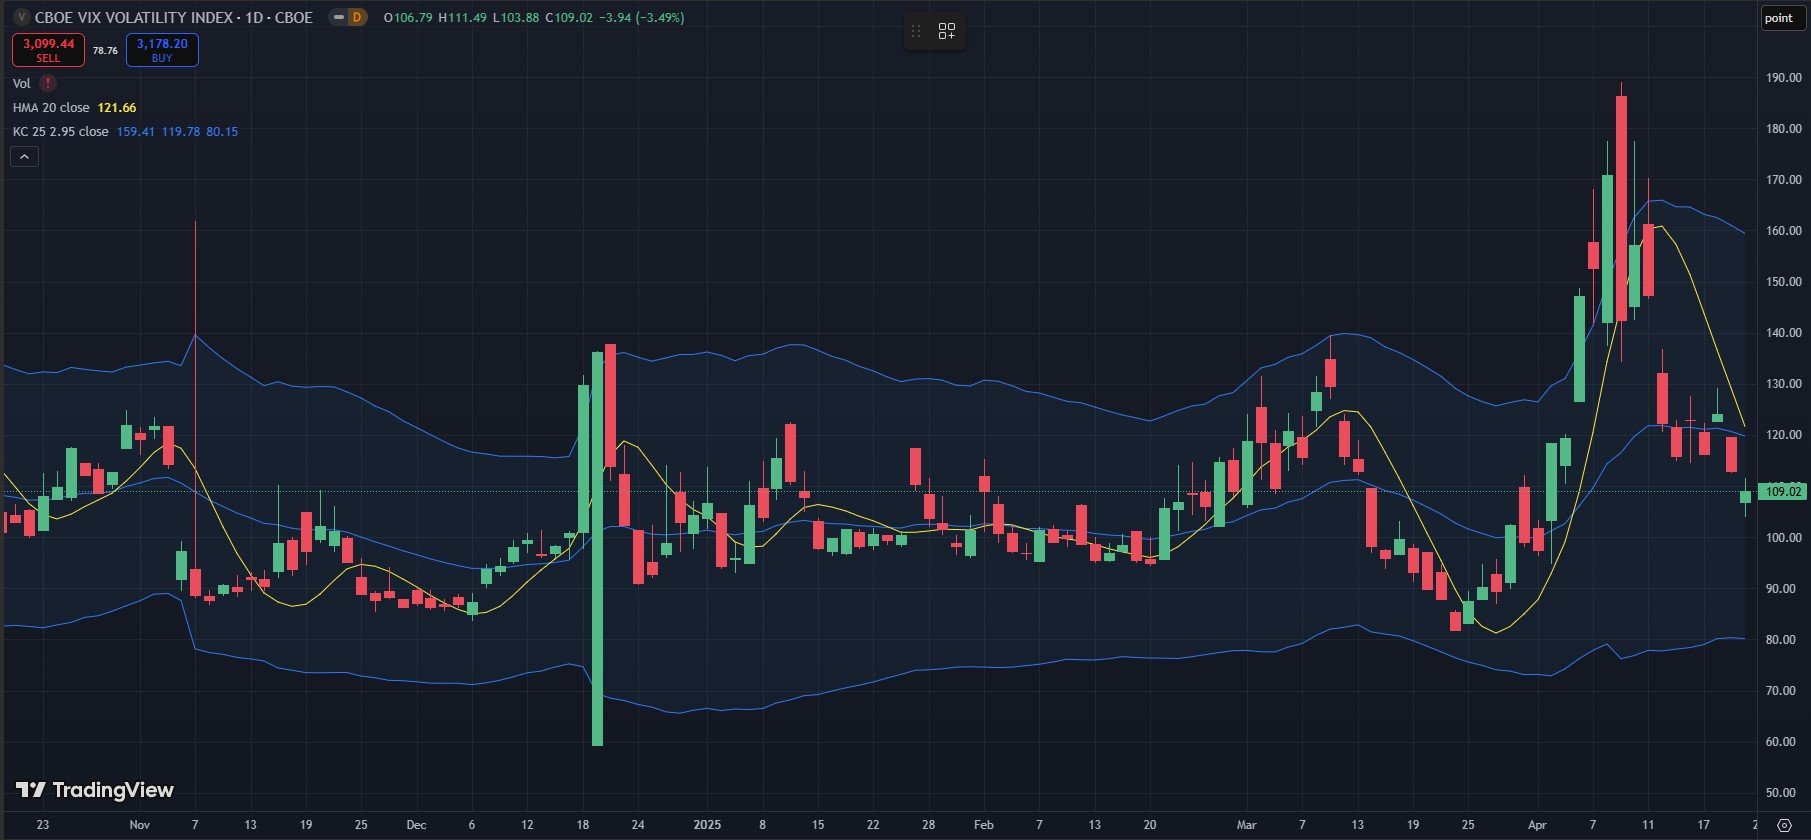
We often talk about VIX and VVIX divergences/negative correlation acting as potential predictors of future VIX spikes. We saw such a divergence today, with VVIX green and VIX red. We also see the VIX at an interesting spot that has marked prior resistance levels since at least late 2024, now acting as support. Given that the VIX is below the Hull, and it’s been a good short ever since closing below the Hull some 10 trading sessions ago, we won’t expect too much upside for the VIX until it can overcome the 32.5 Hull. This could happen intraday and spike further quickly, so it’s worth watching as we sink toward the mid-20s.

VVIX measures the expected future volatility of the VIX, so one interpretation of a green candle on VVIX is that the VIX is expected to become more volatile soon. Even a brief VIX rebound might see VVIX go back toward the 120 area to retest the Hull from below. As usual, we’ll assess the intraday GEX picture after the market opens tomorrow and we’ll share some observations in Discord. We hope you’ll join us!
Here’s the Discord link if you haven’t joined us yet in our most active social media setting! Access is free for some channels, and new members have a 7-day trial within Discord to see how we operate. We have an active community of thoughtful traders who chime in throughout the day, sharing ideas and opportunities as we see them.
If you’re interested in accessing our tools and analytics, be sure to check out our website! We rolled out backtested algos and chart indicators and we just increased our ANALYST tier subscription to include 600+ tickers, including individual stocks!
If you’re interested in learning more about our strategy and approach, we address all of these topics in our Geek University course which is included in all memberships.
We recently posted a YouTube video today, and we have many other short videos, so give our channel a look if you’re curious about recent market commentary and ideas as well as gamma (GEX) concepts explained.
Thanks for being part of our community and know that we invite your feedback!
The information provided by Geeks of Finance LLC is for educational purposes only and is not intended to be, nor should be construed as, an offer, recommendation or solicitation to buy or sell any security or instrument or to participate in any transaction or activity. Please view our Investment Adviser Disclaimer and Risk Disclosure.