
Is DIA The “Straggler” Sellers Are Awaiting?
NEW ANNUAL SUBSCRIPTION PROMO! We’re now offering $300 off of the annual Portfolio Manager! We have overlayed chart indicators and several backtested algos complete with notifications and we anticipate more near-term improvements. Your needs are our focus, and we want the platform to become indispensable for your trading! Enter code EASTER2025 at checkout to take advantage of this limited time offering.
Well, against my wishes (though within the realm of expectation), the market (SPX) headed higher yet again today, effectively counteracting Wednesday’s close near cash session lows by overcoming the middle Keltner channel, this time closing above Wednesday’s highs and looking strong above the middle Keltner channel. One index has yet to officially close above the mark: Could this be what the market is awaiting before at least a pullback? We take a look at the big picture in our latest YouTube video, which can be viewed by clicking here.

Let’s sum up where SPX stands at the moment, starting with the GEX levels chart above:
1) The April 21 low looks constructive, it was basically a “halfway back” test of that wild 10% day earlier in April.
2) We’ve left a gap from Tuesday that some would expect to be closed.
3) SPX is above the daily Hull moving average, which is a positive according to my methodology.
4) We still want to respect the Dealer Cluster zones, since the upper Dealer Cluster zone reflects a potential area where dealers may become sellers.
5) The second largest net GEX cluster is still at the important 5200 level.
All things considered, we have good reasons to doubt a near-term retest of sub-5000 lows, but we have potentially good reasons to also expect an imminent pullback from the upper Dealer Cluster. I believe 5200-5300 represents a realistic target zone, given that 5200 has the large GEX cluster visible and 5302 represents the Hull. Can we make new lows? Is the bear market over? There’s really no useful reason to speculate on these questions in terms of money landing in your trading account, because tactically, we can focus on the near-term levels and current GEX structure that already tell us where we’re likely to meet solid resistance or strong support (we exclude the ever-present Black Swan, because there’s nothing predictable about that by definition, just have proper hedging in place).
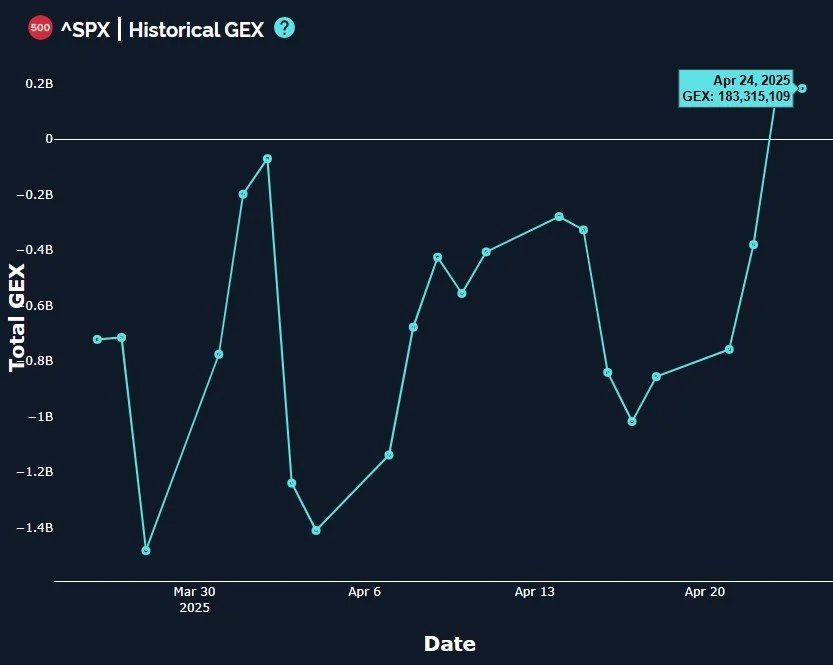
Glancing at the total net GEX picture below, we can see SPX has maintain a 2nd day in positive GEX territory, albeit marginally so. This is still a positive development and we’ve seen GEX improve more than any time over the last month, so we need to be open-minded that maybe we do end up rallying further, even considering potential pullbacks along the way.
I also want to point out another colorful line that lies just overhead, the 9-period SMA on the weekly chart. I like using the 9-period SMA, though the Hull is my favorite. Regardless, you can see that we are about to test the 551 level that the yellow line represents for SPY. The Keltners hardly look bullish, in fact the lower Keltner is still diving, keeping alive the potential for a move down toward the sub-5000 area again, in theory.

DIA appears to be last major index to have not closed above the middle Keltner channel. Could this group of crotchety-old grandpa stocks be the last checkmark necessary for the market to turn back south again, or is DIA simply limping along at the rear? The limping possibility seems unlikely, given that DIA led the way up and down several times over the last 6-12 months, which we highlighted along the way. I think there’s a real possibility DIA makes it above the middle Keltner tomorrow, perhaps touches the big 407 GEX cluster, and then the market begins its pullback. No need to flip a coin, we can wait to initiate intraday positions also using the GEX data shown on the 0 DTE (or weekly expirations on Friday) basis to improve our odds of success.
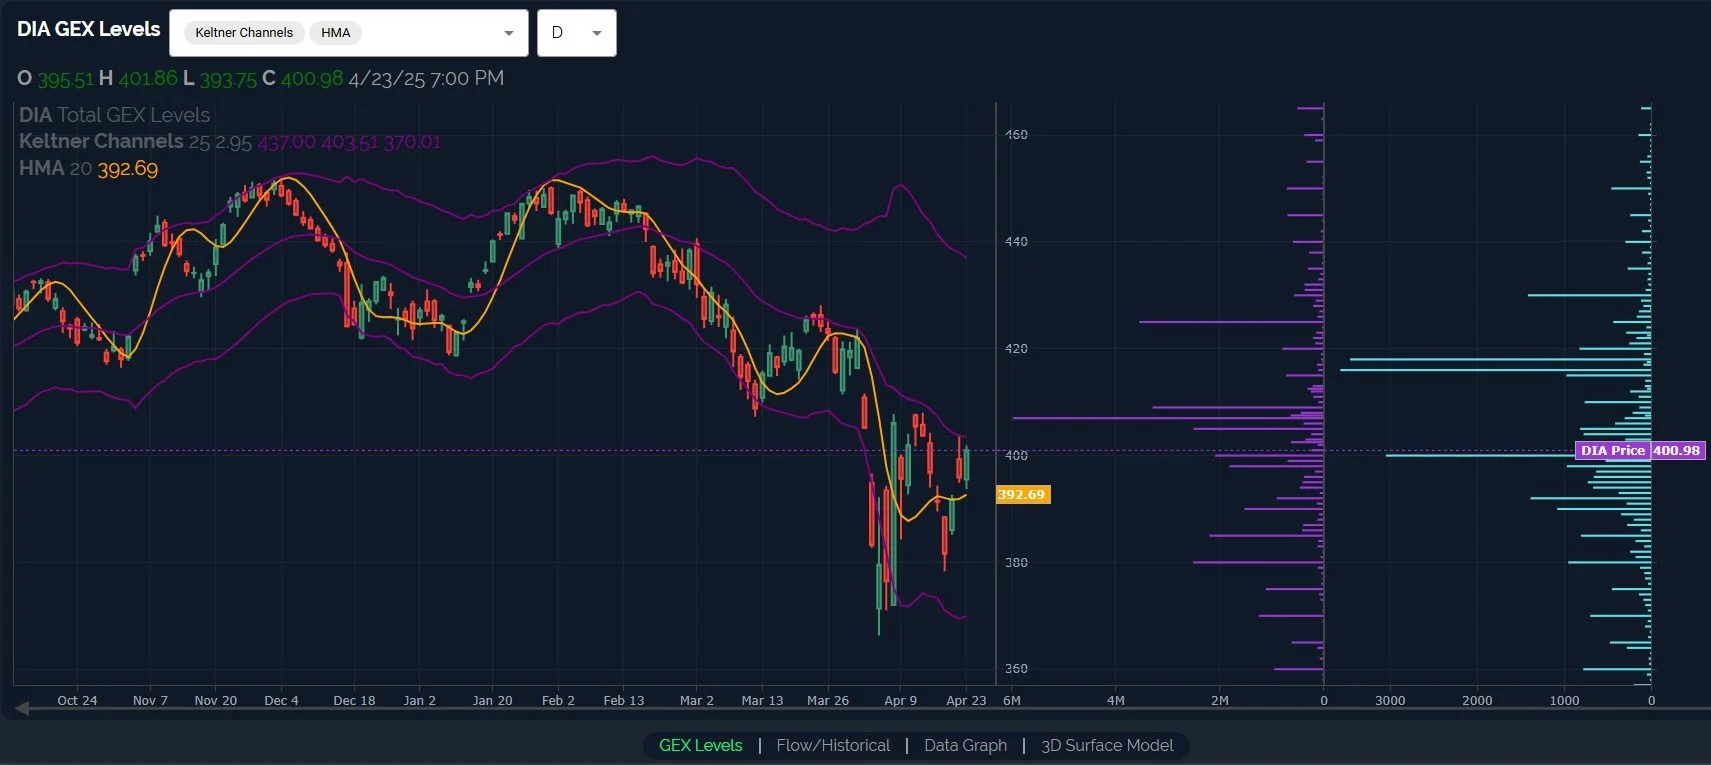
DIA is also lagging a bit in terms of total GEX improvement, certainly showing improvement, but not even making it into positive territory yet. Omen or meaningless coincidence? I don’t have a crystal ball for that one, time will tell.

Lastly, we’ve been watching VIX 25 for quite some time, and today’s close was awfully close at just over 26. Note the change in character on the volume side, the light blue volume bars show a lot of activity at higher strikes today. We also still see meaningful GEX (in fact, the biggest GEX cluster) at 42.5 and even at 50. We don’t have the positive momentum signal for volatility until a close back above the yellow line, the Hull, but hedges even now are certainly cheaper than they were a few days ago.

As usual, we’ll assess the intraday GEX picture after the market opens tomorrow, and we’ll share some observations in Discord. We hope you’ll join us!
Here’s the Discord link if you haven’t joined us yet in our most active social media setting! Access is free for some channels, and new members have a 7-day trial within Discord to see how we operate. We have an active community of thoughtful traders who chime in throughout the day, sharing ideas and opportunities as we see them.
If you’re interested in accessing our tools and analytics, be sure to check out our website! We rolled out back tested algos and chart indicators and we just increased our ANALYST tier subscription to include 600+ tickers, including individual stocks!
If you’re interested in learning more about our strategy and approach, we address all of these topics in our Geek University course which is included in all memberships.
We recently posted a YouTube video today, and we have many other short videos, so give our channel a look if you’re curious about recent market commentary and ideas as well as gamma (GEX) concepts explained.
Thanks for being part of our community and know that we invite your feedback!
The information provided by Geeks of Finance LLC is for educational purposes only and is not intended to be, nor should be construed as, an offer, recommendation or solicitation to buy or sell any security or instrument or to participate in any transaction or activity. Please view our Investment Adviser Disclaimer and Risk Disclosure.