
Still Going Higher..But How Far?
NEW ANNUAL SUBSCRIPTION PROMO! We’re now offering $300 off of the annual Portfolio Manager! We have overlayed chart indicators and several backtested algos complete with notifications and we anticipate more near-term improvements. Your needs are our focus, and we want the platform to become indispensable for your trading! Enter code EASTER2025 at checkout to take advantage of this limited time offering.
Our latest YouTube video can be viewed by clicking here, which I encourage you to check out for complementary aspects of the broader indices not covered in tonight’s newsletter, as well as several individual tickers that we’re watching. We got our bounce today that we anticipated yesterday as the most likely scenario, in fact we placed our hedges back on given the rebound. Just in case the market moves even higher, we also picked up new long positions earlier in the morning, which we’ll close out if we see continuation higher. The nice thing about each trade being structured for 2x-3x+ upside relative to 1x downside is that a near-perfectly hedged portfolio with less than 50% success on each individual position can still rack up good returns.
Alright, enough trying to convince you to make your trading easier, let’s look at SPX. SPX is playing a dicey game of cat-and-mouse around this beloved Hull Moving Average, the yellow line, gapping up close to the line and surpassing the line for a strong close above the important 5250 level.

The middle Keltner channel is close to 5400, which is also a large GEX cluster, so it wouldn’t be surprising (especially given the strength visible in futures at the moment) to see 5400 reached within a day or two. That said, as the purple net GEX bars indicate (and they’re negative GEX bars, which our GEX Data Graph shows our subscribers), the interest above 5400 is virtually nonexistent. So we are still in a “sell the rip” environment, no matter how painful the rips may be for inflexible bears.
Total net GEX did dramatically improve today, with SPX now only showing -380M negative GEX, well within our “neutral” zone. We do need to pay attention to the ceiling we’ve seen below the zero line since late March, so it’s possible we’re closer to a high than to a major turning point. We don’t know, so we need to remain open-minded.

QQQ faded a bit more, nearly reach the middle Keltner channel, but closing a little too close to the Hull for comfort. But technically it did close above the Hull. 465 is a noteworthy GEX cluster overhead, also representing a not too shabby 20-point move from today’s close, if we continue higher. The overall Keltner configuration still indicates a lower and to the right bias, which is negative.
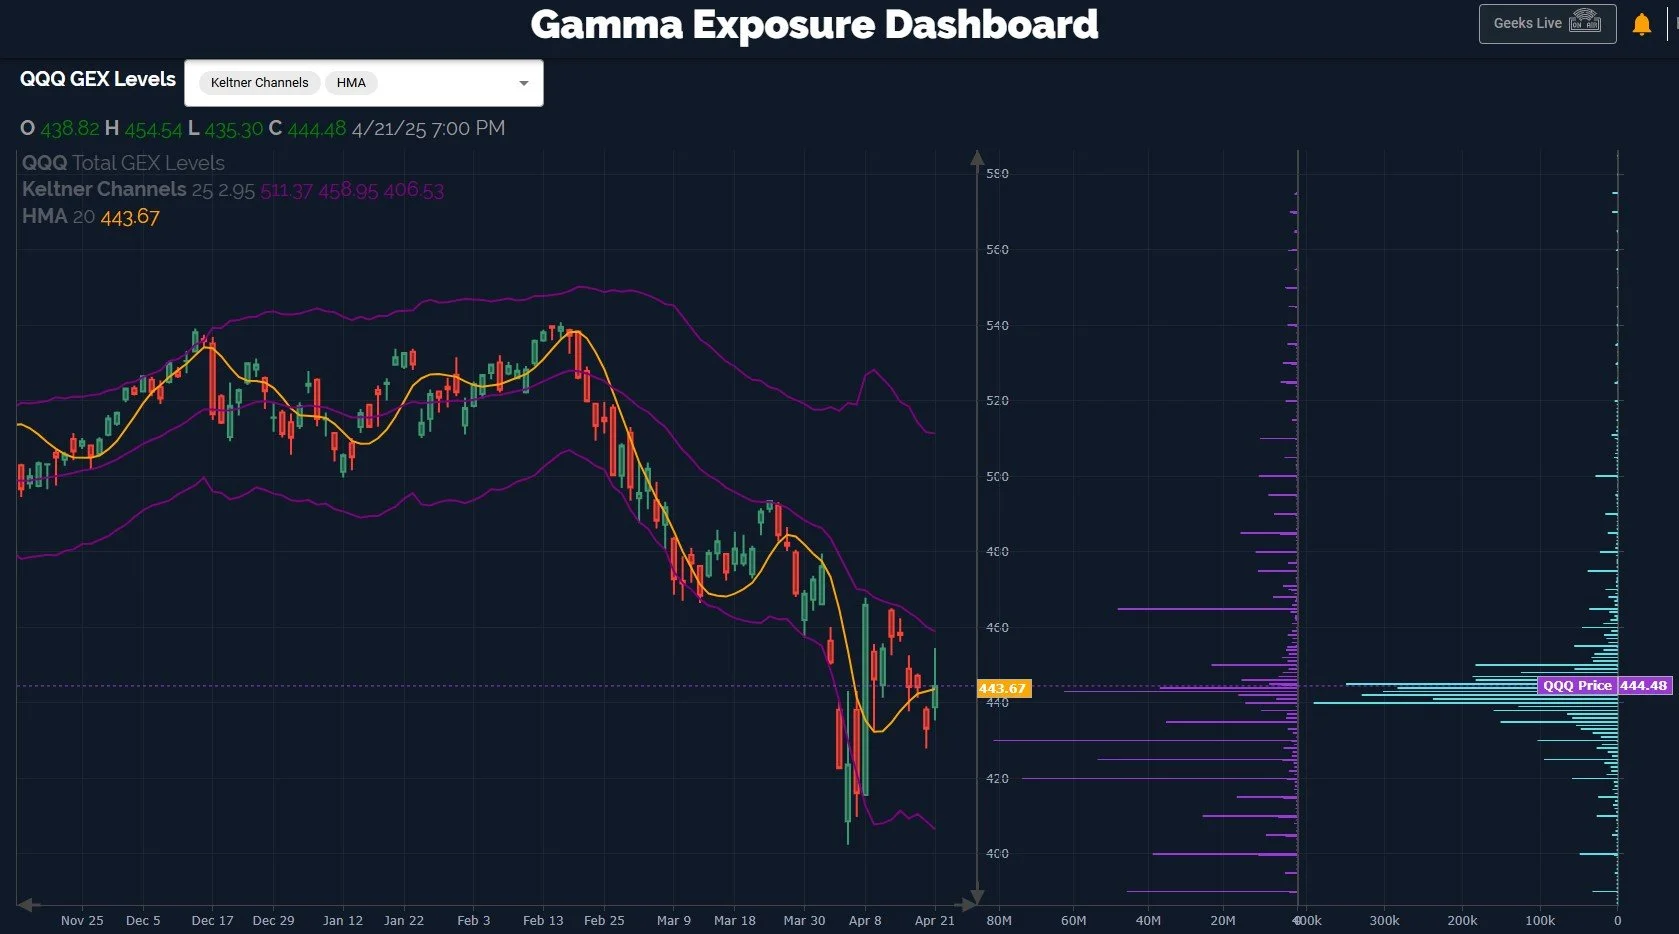
On the positive side, QQQ also saw a large increase in net GEX (or a reduction in negative GEX), approaching a GEX level associated with recent highs. I say this is positive because any chance the bulls have of a more sustained rebound will almost certainly involve a move to the positive for GEX, so this is a move in the right direction, even if we see that this increase marks a top prior to reaching more positive GEX levels. We will incorporate other data into our analysis to hopefully arrive at a conclusion that proves correct when it comes to continued rebound versus turning south again.

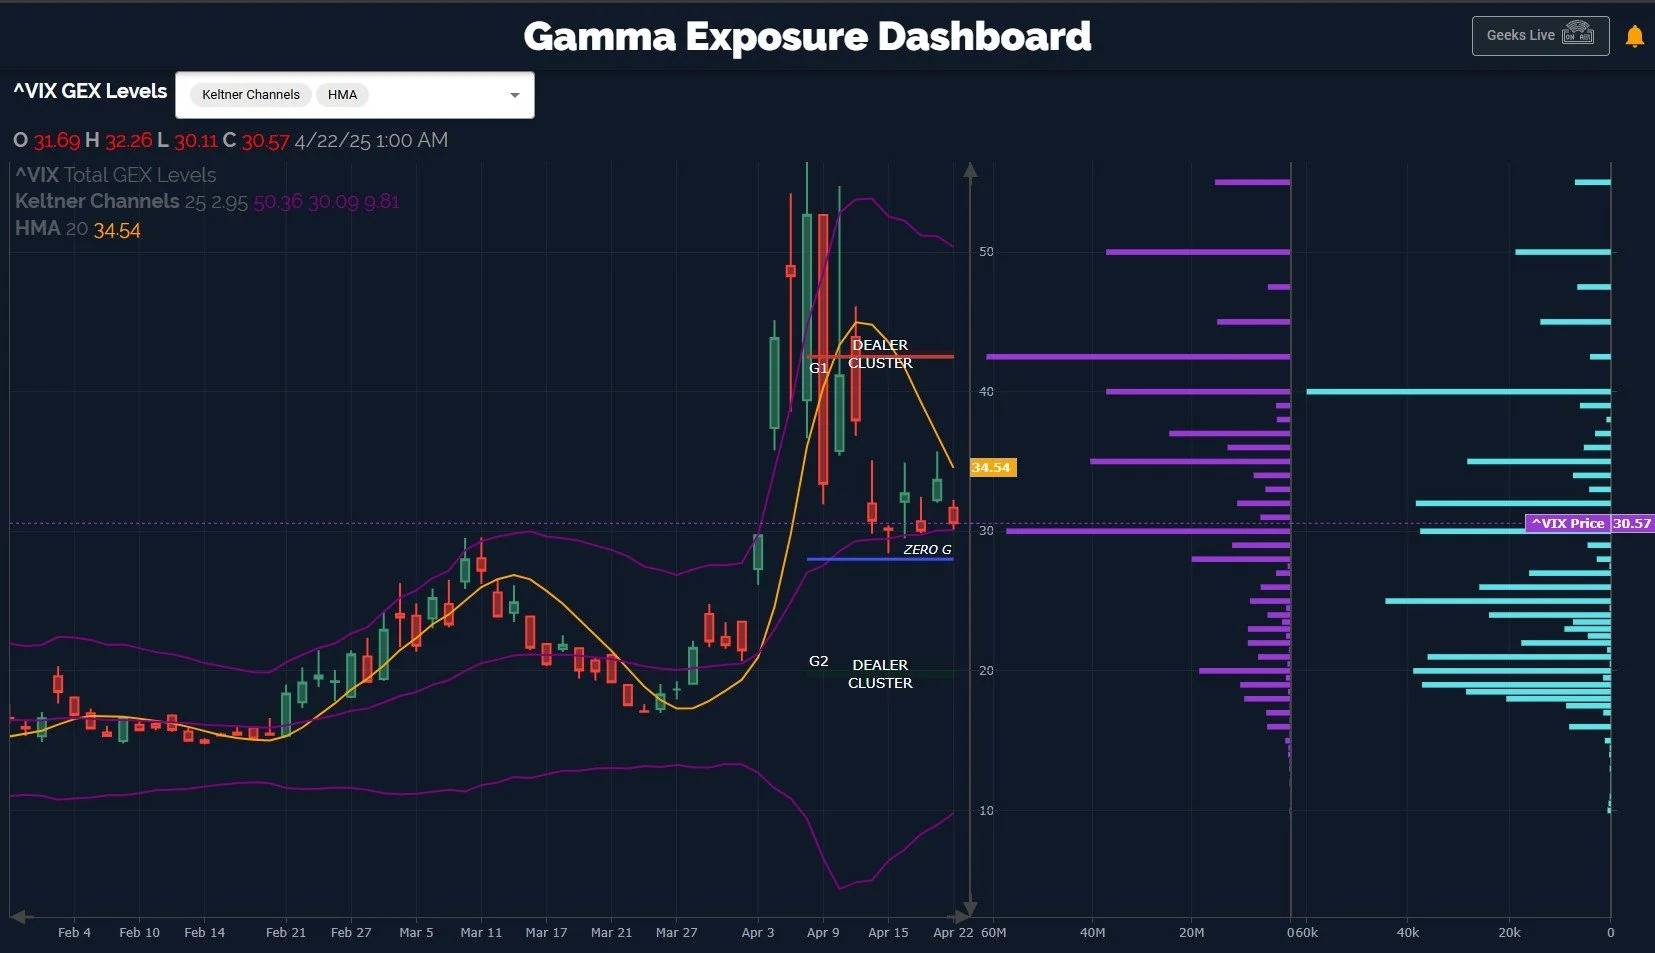
The VIX continues to signal uncertainty and a lack of confidence in the move higher, with the VIX holding the 30 level virtually all day, an important line-in-the-sand we’ve been highlighting. An overshoot toward 25 wouldn’t be surprising, and in fact, I looked at the 2-hour and 4-hour charts and they signal a likelihood of just that. Market bulls do need to be cautious about the volume between 40-50 over the last few days and the continued stubbornness of the GEX at 42.5. Once the rapidly declining Hull crosses beneath the VIX’s current level, a setup may emerge to justify another move higher for volatility.
We had yet another good day in Discord as we incorporated intraday GEX data and we hope you’ll join us there.
Here’s the Discord link if you haven’t joined us yet in our most active social media setting! Access is free for some channels, and new members have a 7-day trial within Discord to see how we operate. We have an active community of thoughtful traders who chime in throughout the day, sharing ideas and opportunities as we see them.
If you’re interested in accessing our tools and analytics, be sure to check out our website! We rolled out backtested algos and chart indicators and we just increased our ANALYST tier subscription to include 600+ tickers, including individual stocks!
If you’re interested in learning more about our strategy and approach, we address all of these topics in our Geek University course which is included in all memberships.
We recently posted a YouTube video today, and we have many other short videos, so give our channel a look if you’re curious about recent market commentary and ideas as well as gamma (GEX) concepts explained.
Thanks for being part of our community and know that we invite your feedback!
The information provided by Geeks of Finance LLC is for educational purposes only and is not intended to be, nor should be construed as, an offer, recommendation or solicitation to buy or sell any security or instrument or to participate in any transaction or activity. Please view our Investment Adviser Disclaimer and Risk Disclosure.