
Entering A New OpEx Cycle
NEW ANNUAL SUBSCRIPTION PROMO! We’re now offering $300 off of the annual Portfolio Manager! We have overlayed chart indicators and several backtested algos complete with notifications and we anticipate more near-term improvements. Your needs are our focus, and we want the platform to become indispensable for your trading! Enter code EASTER2025 at checkout to take advantage of this limited time offering.
We posted a new short video on YouTube this afternoon (which you can view by clicking here) where we cover the big picture on several indices as well as a review of some individual stock ideas, so give it a watch. The newsletter will build upon some of the general themes with a closer tactical look at the indices in relation to some of the indicators we like to use and what we’ll be watching as Monday enters the picture.
First off, let’s note that the Keltners on SPX are (and have been) wide apart, indicating a potentially huge range of possible volatility relative to much of the prior year and earlier, at least if those boundaries act as magnets as they have oftentimes beforehand. Interestingly, and perhaps adding a bit of credibility to why I like the Keltners (and apparently someone with more money than I have likes them as well), look at the volume at the approximate upper and lower Keltner levels on the daily chart Friday. Huge volume at 5000 and 6000. I assume this prodigy managing billions said “screw it, I’m following whatever the indicators say on the Geek’s free newsletter.” Just kidding…But anyway, the volume and the coincidence at those levels is worth noting.

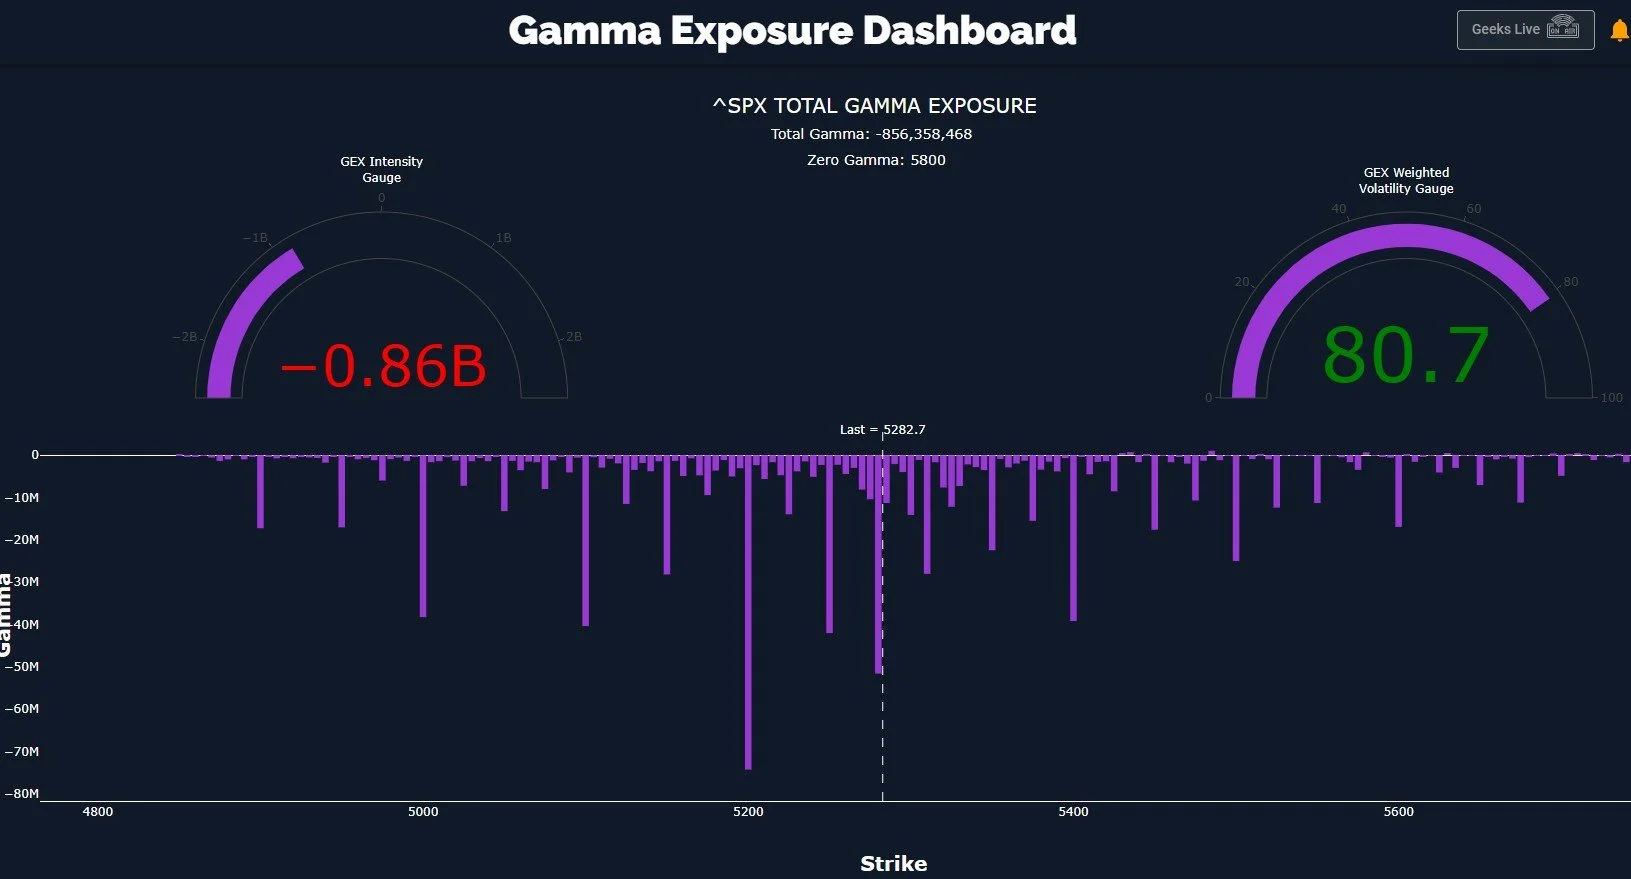
Using GEX immediately after OpEx (monthly Option Expiration) Friday (or Thursday, given the holiday Friday) is perhaps amongst the most speculative times to use GEX, since the new OpEx cycle will start Monday. Given these factors, we’ll pay a lot of attention to the early shifts in the GEX picture and we’ll alert to these observations in Discord, but we can still evaluate possibilities as of Thursday’s close. We see SPX still consolidating above the Hull, which I view as a positive, and we are close to the lower Dealer Cluster zone. The pattern that makes the most sense to me on the basis of causing pain to a lot of participants would be an overshoot of the Hull (the yellow line) to the downside, perhaps retesting 5200 or even 5150 again, then an attempt higher, closing at or above the Hull again. Then we continue higher toward what could be a bear market pivot back down again, or a stronger upside move, we just don’t know yet. We do know that GEX continues to be skewed toward the downside at the moment. The invalidation of this scenario would be closing tomorrow below the Hull at 5228 or an immediate move higher at tomorrow’s open, which is possible, even if less likely. In any case, we’ll adjust to reality and propose possible pathways forward as soon as practicable.

Historical GEX improved only modestly for SPX, and other indices like QQQ and IWM moved more deeply negative relative to Wednesday, not an encouraging sign. SPX still shows the largest negative cluster at 5200, with enough at 5100 and even 5000 to warrant concern.
The VIX showed high volume at 50, but also in the teens, a wide disparity. The larger GEX exists at 50, and the largest GEX has been stubborn at the 42.5 strike for some time, while the VIX hovers around the middle Keltner channel. As mentioned in today’s YouTube video, the 30 level is very important and seems to be a pivot that will dictate which extreme we begin marching toward next. Even if we see a fake breakdown followed by a rally in coming days/week(s), we will have to consider a potential new leg lower for markets and a leg higher in the VIX if the GEX picture remains negative for indices and bullish for volatility.

We mentioned QQQ showing a large shift toward the negative side in terms of GEX, though a lot of that expired after Thursday’s close, so we need to see how the new positioning tomorrow shifts that picture, if at all. The chart shows a steady downtrend (outside of the spike low and rebound) that is at risk of continuing lower if we close below the yellow Hull at 444. The Keltners certainly don’t inspire any optimism with the steady lower right trajectory. As highlighted for SPX, we are still looking at a wide range, with the lower Keltner at 423 and the upper channel at 501, so we can still see volatility within this broad channel, GEX allowing.

IWM didn’t spike as much on April 9 as other indices, but it’s maintained its gains a little better than others, basically building out a consolidation flag. Unfortunately, it has potential to be a bear flag, though the Hull is curling higher. Even a retest of the Hull down to 180 would be viewed constructively in my book. With GEX having moved closer to an extreme again, and GEX clusters on a net basis being almost exclusively negative, a larger squeeze higher would not be surprising, even if we do move lower tomorrow. We’ll look forward to sharing further updates tomorrow in Discord!

Here’s the Discord link if you haven’t joined us yet in our most active social media setting! Access is free for some channels, and new members have a 7-day trial within Discord to see how we operate. We have an active community of thoughtful traders who chime in throughout the day, sharing ideas and opportunities as we see them.
If you’re interested in accessing our tools and analytics, be sure to check out our website! We rolled out backtested algos and chart indicators and we have more improvements on the way, including an improved mobile experience!
If you’re interested in learning more about our strategy and approach, we address all of these topics in our Geek University course which is included in all memberships.
We recently posted a YouTube video today, and we have many other short videos, so give our channel a look if you’re curious about recent market commentary and ideas as well as gamma (GEX) concepts explained.
Thanks for being part of our community and know that we invite your feedback!
The information provided by Geeks of Finance LLC is for educational purposes only and is not intended to be, nor should be construed as, an offer, recommendation or solicitation to buy or sell any security or instrument or to participate in any transaction or activity. Please view our Investment Adviser Disclaimer and Risk Disclosure.