
On A Mission Into Quarter End
THE SPRING PROMO ALMOST OVER- We’re offering $300 off of the annual Portfolio Manager for a few more days! We now have overlayed chart indicators and several backtested algos complete with notifications and we anticipate more near-term improvements. Your needs are our focus, and we want the platform to become indispensable for your trading! Enter code SPRING2025 at checkout to take advantage of this limited time offering.
Today’s YouTube video gives a great overview of what’s happening in the markets, as well as some individual tickers. You can view it by clicking here, and it’s only a few minutes long. I think in today’s newsletter, we need to zoom out and look at the weekly charts given the determined and dynamic decline we’ve seen as we head into quarter end. Could the ongoing drop be as simplistic as bottoming right at quarter end, prior to new monthly flows assisting with some sort of rebound? Sure, though even if we do bottom tomorrow, we still don’t have a firm grasp on where we might bottom or how long it may take to see a recovery. It’s also possible we’re positive tomorrow and then resume the decline into April. Let’s look at a few potential clues:
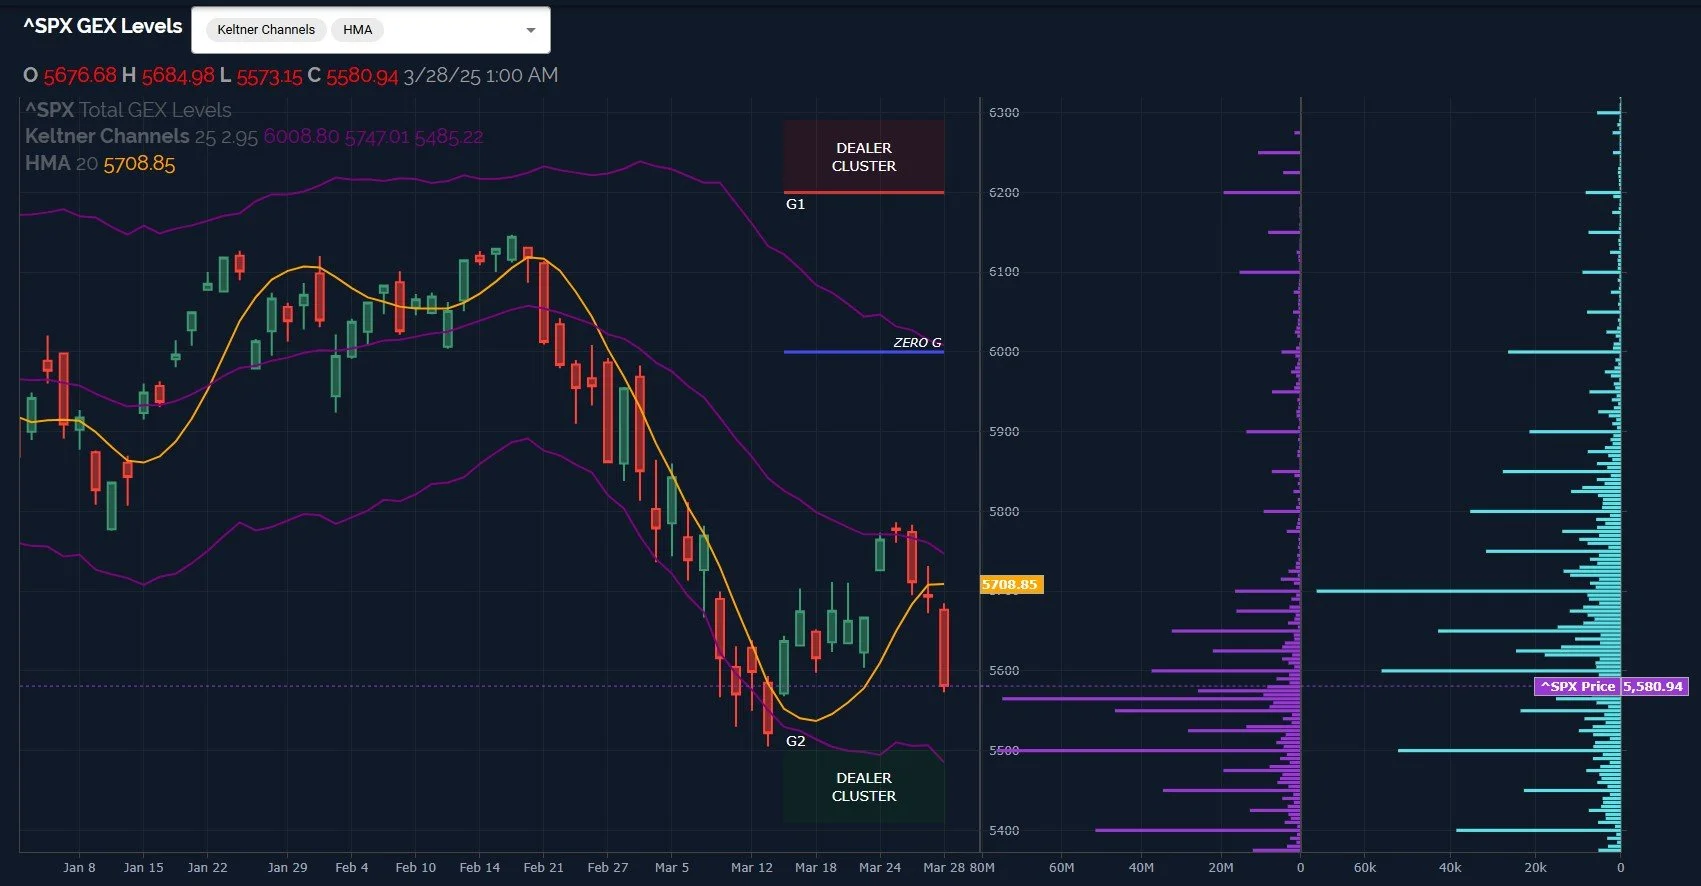
SPX has already given up the entirety of the recent rally, and the lower Dealer Cluster zone has shifted down as well. I also notice the large GEX cluster at 6000 is all but gone on a net basis, which is concerning in the short run.5400-5500 is currently the next area where we might look for a bounce, even if only temporary. The Keltners are pointing lower and we’re below the Hull, so combined with negative GEX, we have an overall situation that tells me to look toward the short side until evidence says risk/reward is no longer skewed in that direction.
Unfortunately, even with the turn south, SPX is still not that close to reflecting a GEX extreme, meaning we can see markets move even lower before triggering a potential GEX contrarian signal.
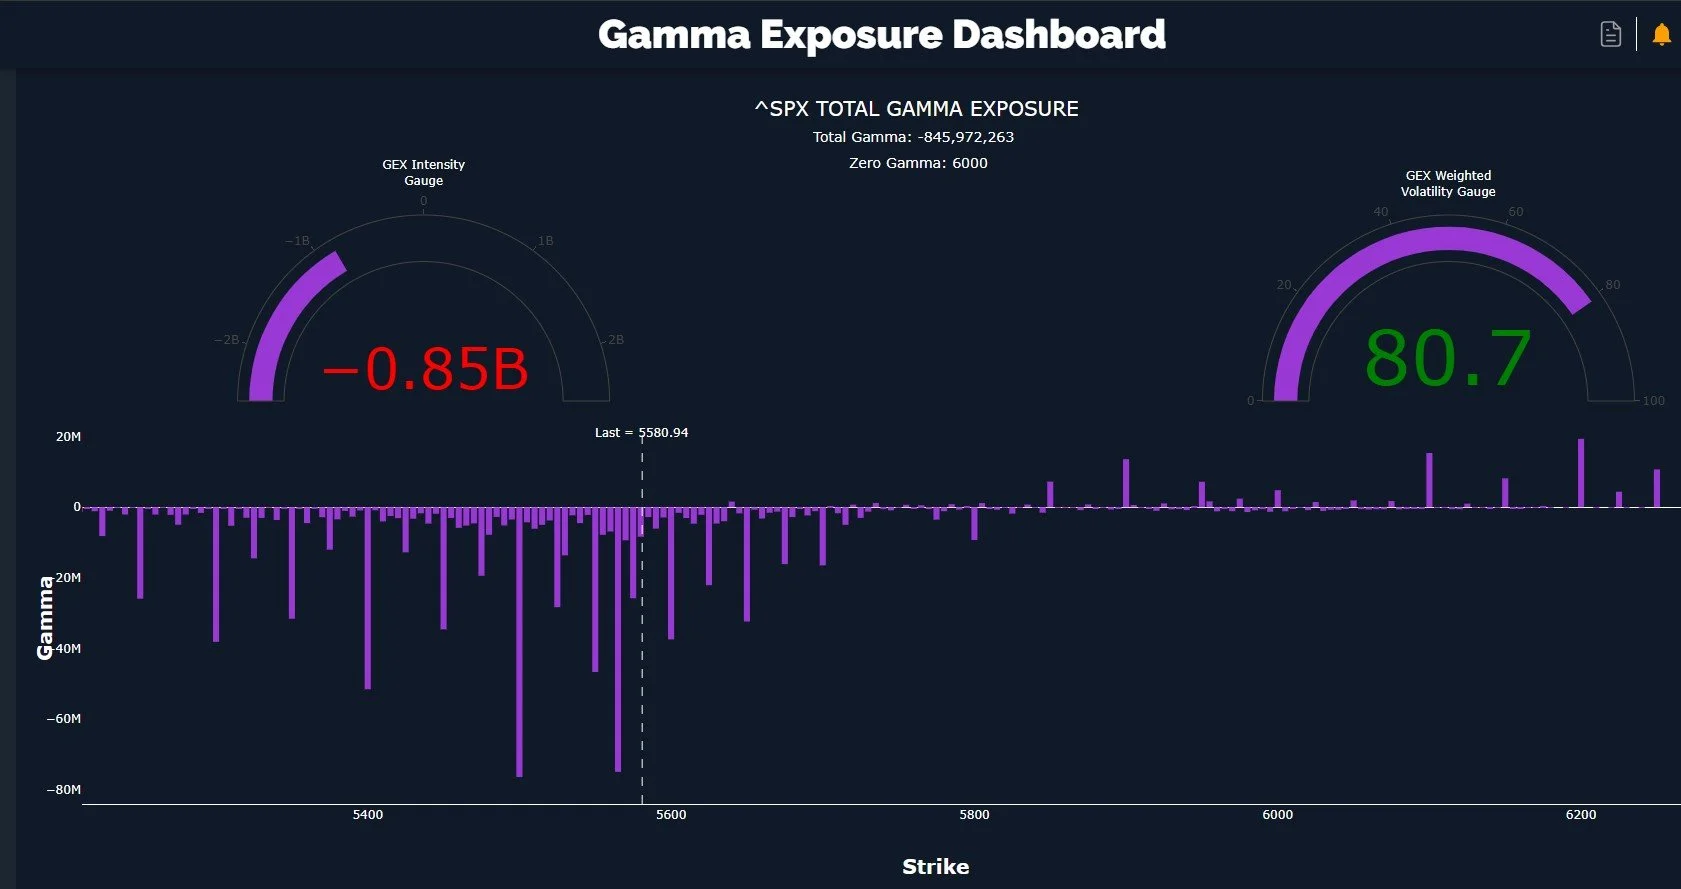
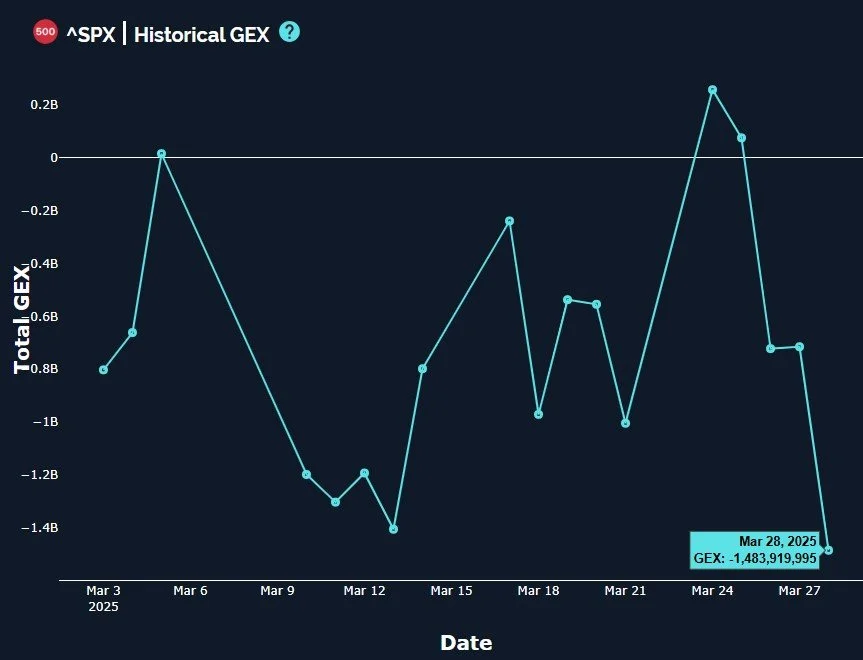
SPX GEX reached a new low Friday compared to recent GEX lows, confirming we’re in a solid downtrend.
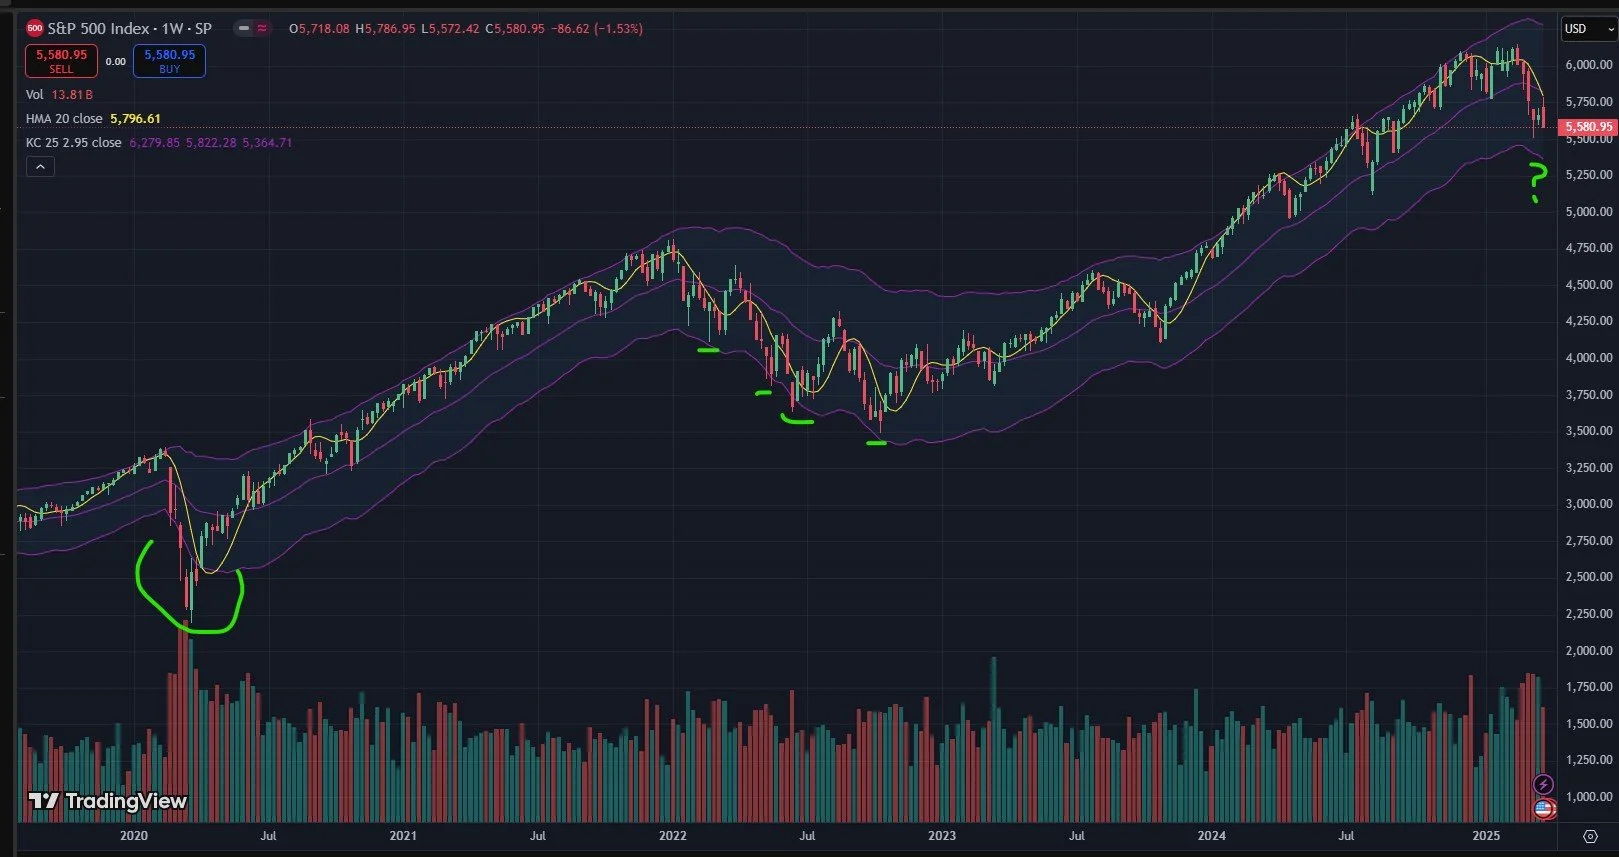
Let’s zoom out and look at the weekly chart. On a weekly basis, we rejected from the Hull moving average last week, sending us on a higher probability path lower toward the lower Dealer Cluster zone (5400-5500) and potentially also the lower Keltner channel, which is somewhere between 5365-5425, depending on whose Keltner channels you’re reviewing (we won’t get too deep into the weeds on that topic). Regardless, the range 5365-5425 fits well within the GEX 5400 lower current area.
But how deep can the drop go and how long might price take to recover? Let’s look at every example over the last 5 years where SPX came close to the lower Keltner channel on the weekly chart or perhaps overshot it to the downside. We only have a few examples, but most of those examples show that a dip buyer would have at least had some opportunity to exit at higher prices within the next week, though two examples (2020 and the 1st half 2022) show buyers having to wait 2 weeks to see a sizable rebound from that lower weekly Keltner.
We see virtually the same thing with QQQ, though QQQ looks even stronger, no surprise given its role in market leadership over recent years. QQQ may be headed for the low to mid 440s if the drop continues.
The bottom line is that we may see the market continue its slide lower, and it may have another 3-4% downside, if not a little more. But recent examples show that touching and/or exceeding the lower weekly Keltner ended up being a good buying opportunity a few weeks out, even if the rally was within a larger bear move. This time may be different, which is always a risk, and we used the bounce to put on new hedges against our longs just in case. But we’ll continue making intraday adjustments based on what GEX tells us and we’ll look for extreme readings to initiate contrarian moves. It’s not easy buying powerful declines and we definitely want to wait until we see more evidence of reversal.

Here’s the Discord link if you haven’t joined us yet! Access is free for some channels, and new members have a 7-day trial within Discord to see how we operate. We have an active community of thoughtful traders who chime in throughout the day, sharing ideas and opportunities as we see them.
If you’re interested in accessing our tools and analytics, be sure to check out our website! We rolled out backtested algos and chart indicators and we have more improvements on the way!
If you’re interested in learning more about our strategy and approach, we address all of these topics in our Geek University course which is included in all memberships.
We recently posted a YouTube video after the market close today, and we have many other short videos, so give our channel a look if you’re curious about recent market commentary and ideas as well as gamma (GEX) concepts explained.
Thanks for being part of our community and know that we invite your feedback!
The information provided by Geeks of Finance LLC is for educational purposes only and is not intended to be, nor should be construed as, an offer, recommendation or solicitation to buy or sell any security or instrument or to participate in any transaction or activity. Please view our Investment Adviser Disclaimer and Risk Disclosure.