
Relief Rally Vs Bottom? March 31 Stock Market Preview
Get $300 off of the annual Portfolio Manager subscription by entering code EASTER2026 at checkout!
Tonight’s YouTube video looks at the post-mortem SPX as of today’s close, QQQ, the VIX, MSTR, and MSFT, so check it out! You can view the most recent and prior YouTube videos by clicking Community at the top of our homepage to find our YouTube channel link.
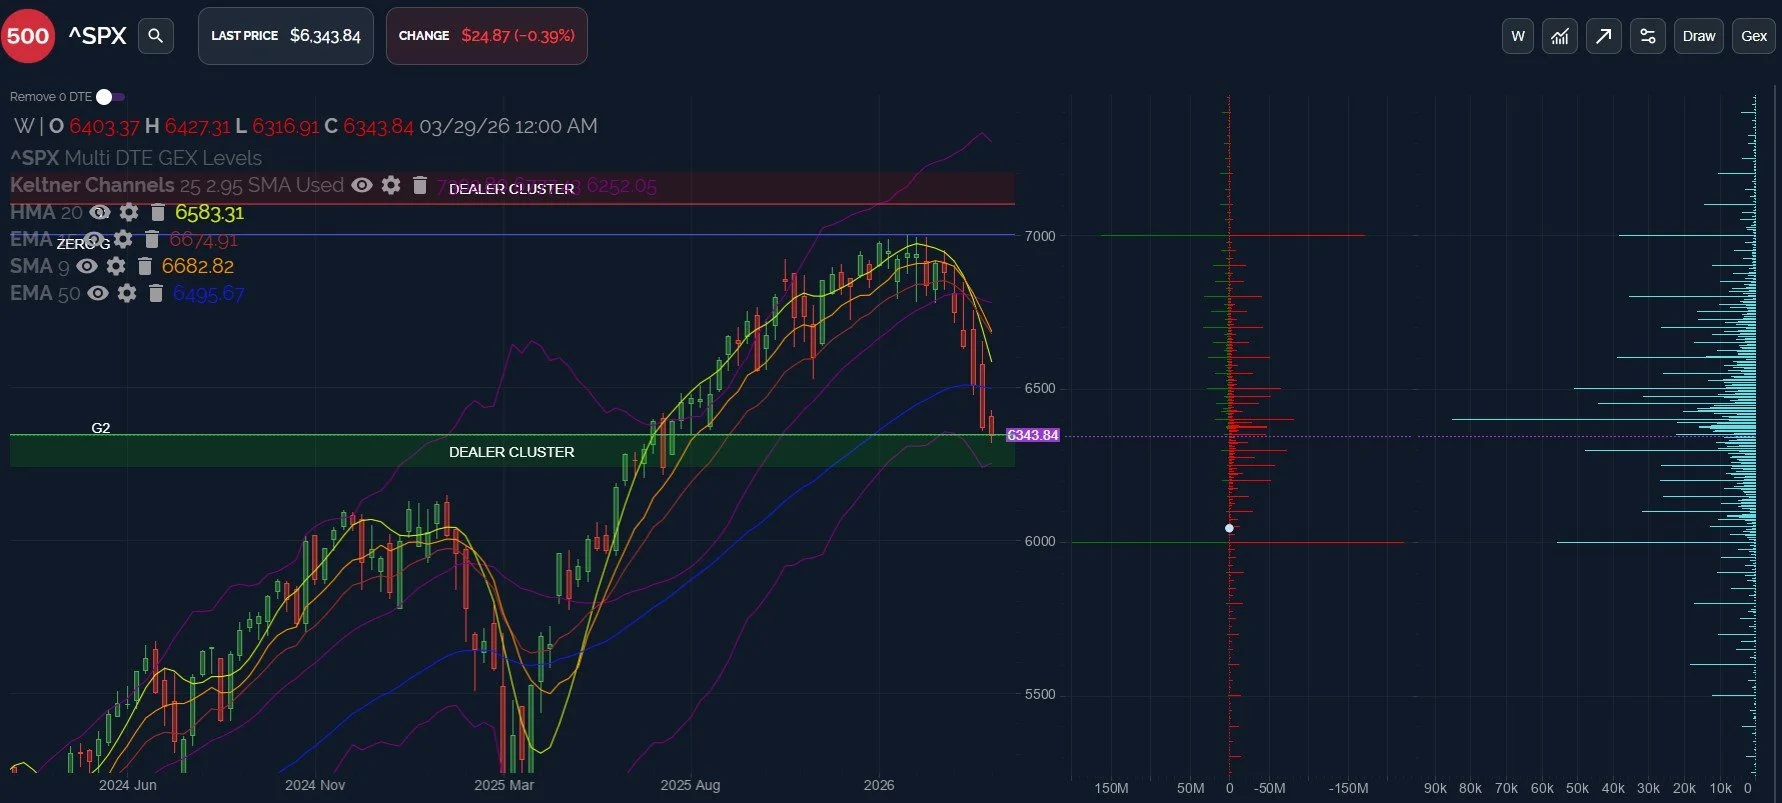
I am confident that a rebound is near, but I am not confident as to whether or not that rebound will be lasting. As I type this, futures are up quite a bit, which isn’t unexpected given SPX’s tag of the lower daily Keltner channel and the extension below the declining weekly HMA and 9 SMA, plus a whole host of other indicators and metrics that reveal oversold conditions.
The weekly candles on the chart below also show price dipping into the lower Dealer Cluster zone, the largest net negative GEX cluster (6000 is clearly now the largest GEX area, but not on a NET basis).
In recent history, we can see that rebounds often favor the bulls: You look back and see that it was “the” low while the Elliott Wave dudes are re-working their waves after not getting that last leg lower (no offense intended, I think there’s some value in certain wave studies).
But in the absence of having a crystal ball, what might clue us in as to whether or not we want to buy the rip or sell the rip?
The weekly lower Keltner channel is merely 89 points away at 6252 (we got here in a hurry, didn’t we).
The declining HMA is merely 17 points away from 6600, almost exactly 250 points north of here.
I personally view a straight down move to 6000 as a likely capitulation event, one that I will buy without having my arm (or other body part, you know, like my ear) twisted.
I actually think the more painful move would be a big rally to retest the weekly moving averages between 6600-6700 before working our way back down to 6000.
If we see 6583 conquered on a daily close, we may have a shot at breaking the downtrend and heading back towards 7000.
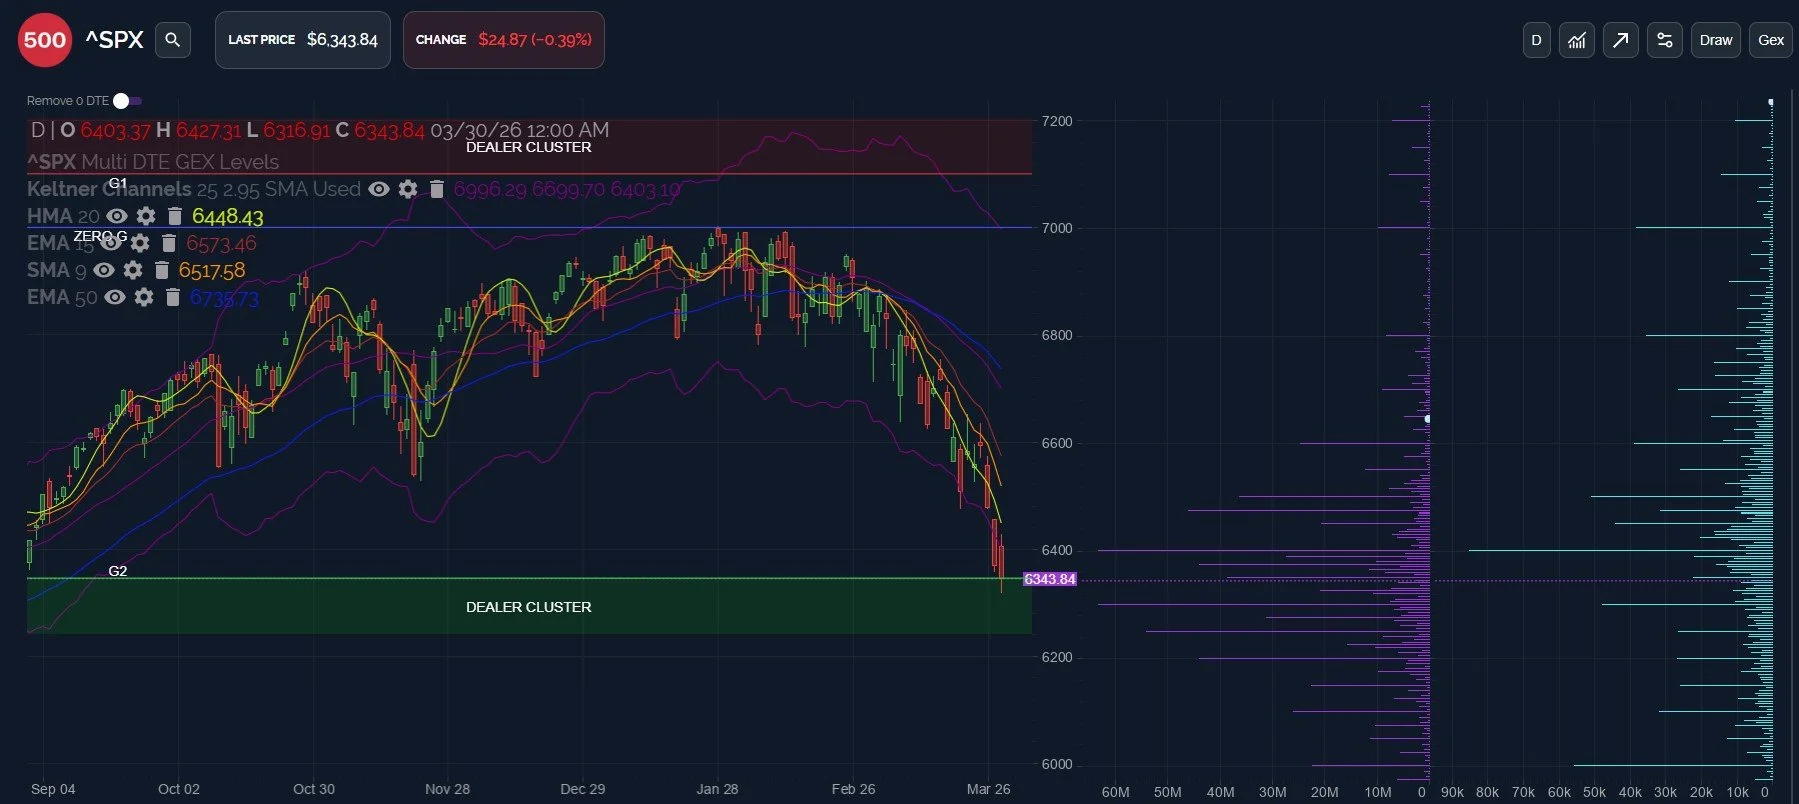
SPX’s daily chart (with net GEX flipped on instead of gross GEX) shows meaningful GEX clusters primarily between 6200-6500, and the daily chart is oversold by a number of metrics, similar to the weekly chart.
We see volume today (excluding 0 DTE contracts) elevated at various strikes between 6000 and 7000, a common theme lately.
Note that the moving averages on the daily chart are at fairly similar areas compared to the weekly chart, which isn’t always the case. I find the overlapping of indicators on different timeframes to be more convincing, with reinforcement that an approach toward SPX 6600-6700 might meet important resistance.
SPX saw net GEX improve as of Monday’s close despite the negative price action, which I view as a positive divergence. We’ll want to watch the previous GEX low from a little over a week ago to see if SPX continues making overall headway toward a positive net GEX position again.
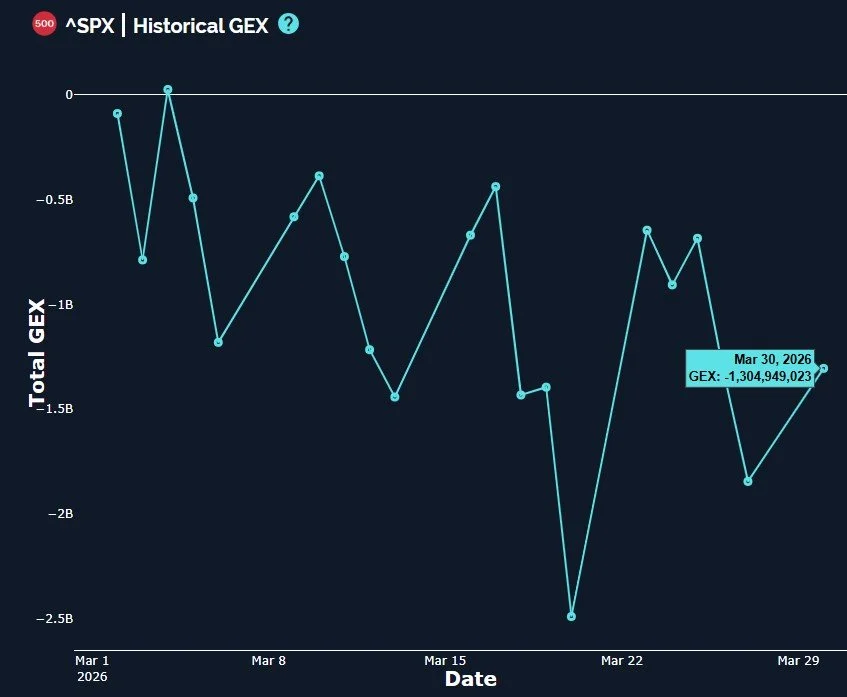
QQQ and IWM both saw improvements in net GEX as of the close as well, a potentially encouraging (yet early) sign despite bearish price action. It’s worth mentioning that all of them still show negative GEX, just less than they reflected on Friday.
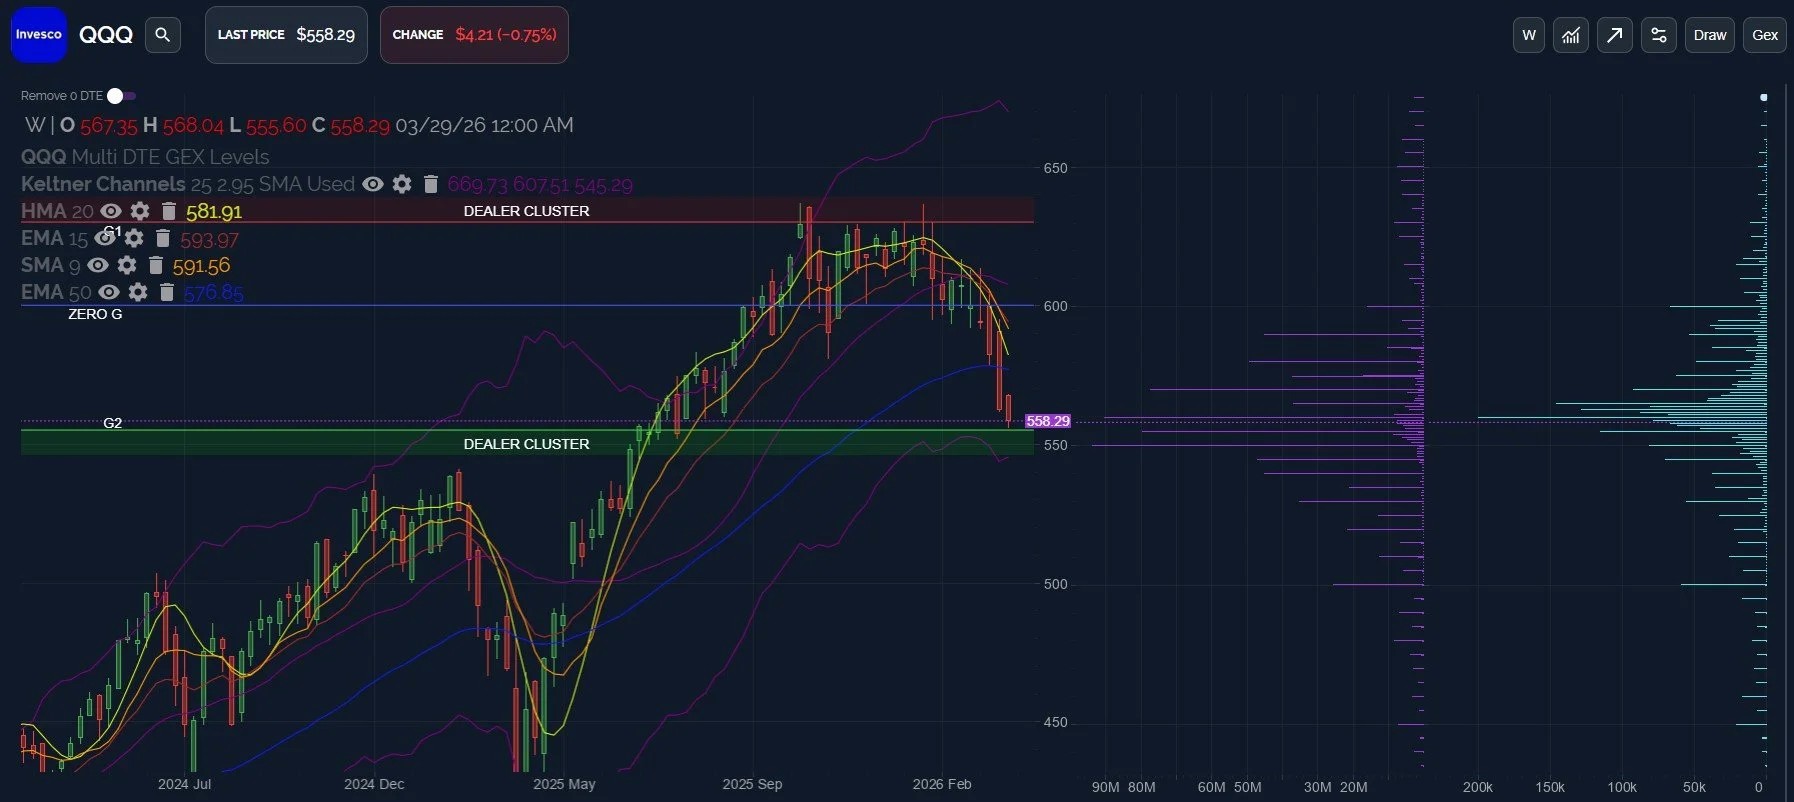
The same bounce scenario for QQQ that I described as a possibility for SPX would see a retest of 580-590.
QQQ’s GEX shifted in a noteworthy manner, with negative GEX clusters really shrinking below 550, and large clusters up to the 590 area.
Just below the 550 GEX cluster, we have the lower weekly Keltner at 545, so 545-550 gives us a zone to watch in the event of continued selling.
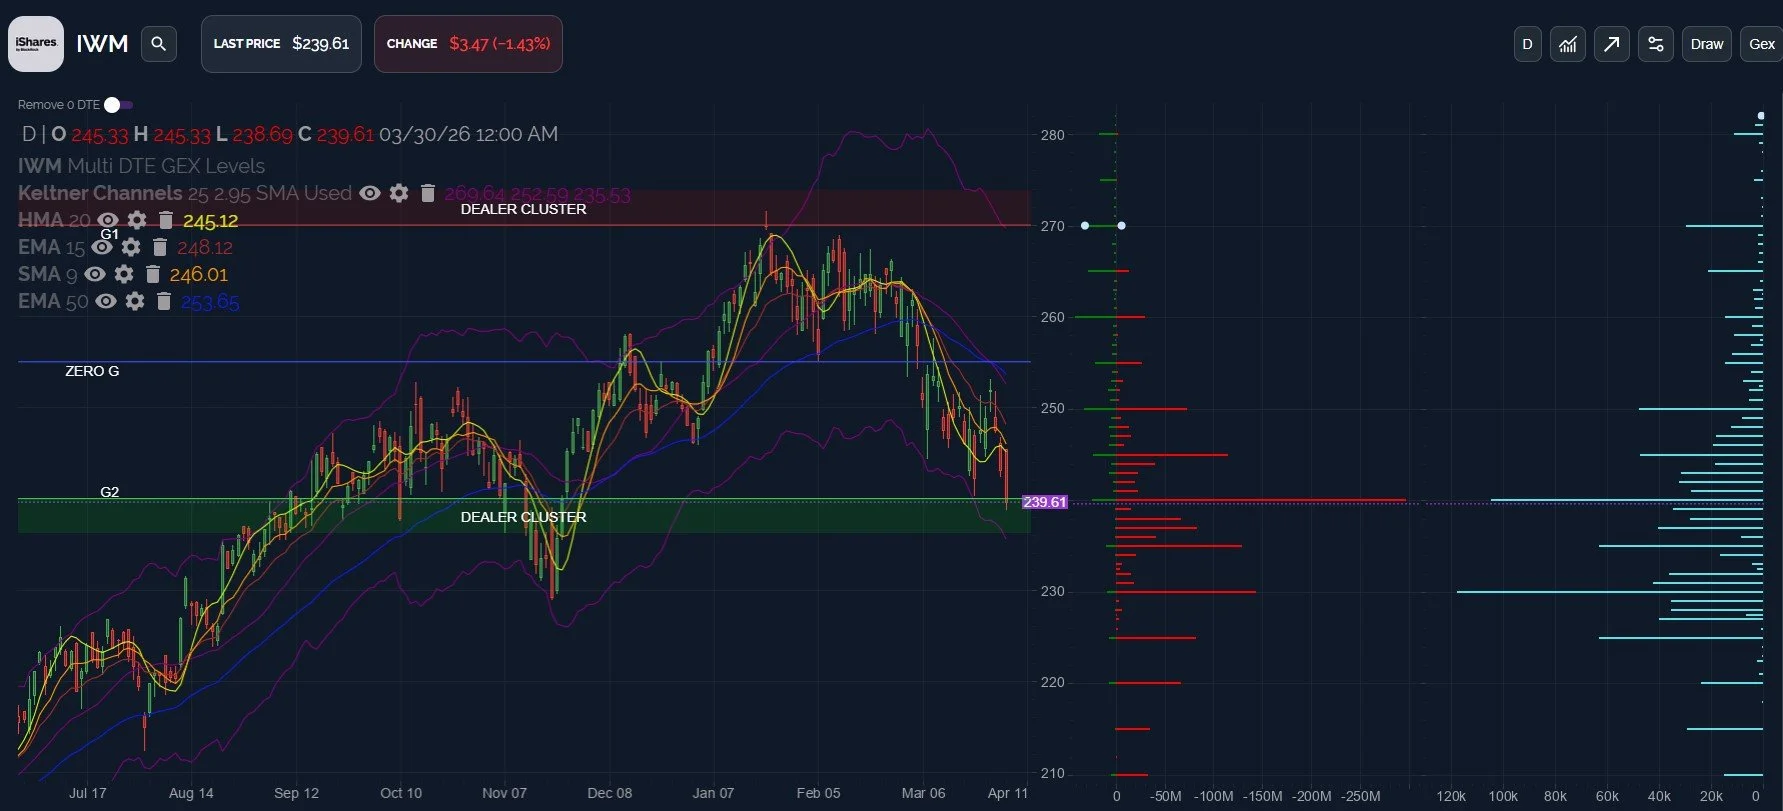
IWM has entered the lower Dealer Cluster zone, tagging the 240 strike where we see a lot of GEX and we also saw a lot of volume for days on end at that strike.
Even today, volume was heavy at 240, we also see a lot of volume at the 230 strike, certainly suggestive of the possibility that we sell off further.
Recapturing 245 may signal a larger bounce is underway, otherwise 230-235 are the next possible targets, in my view.
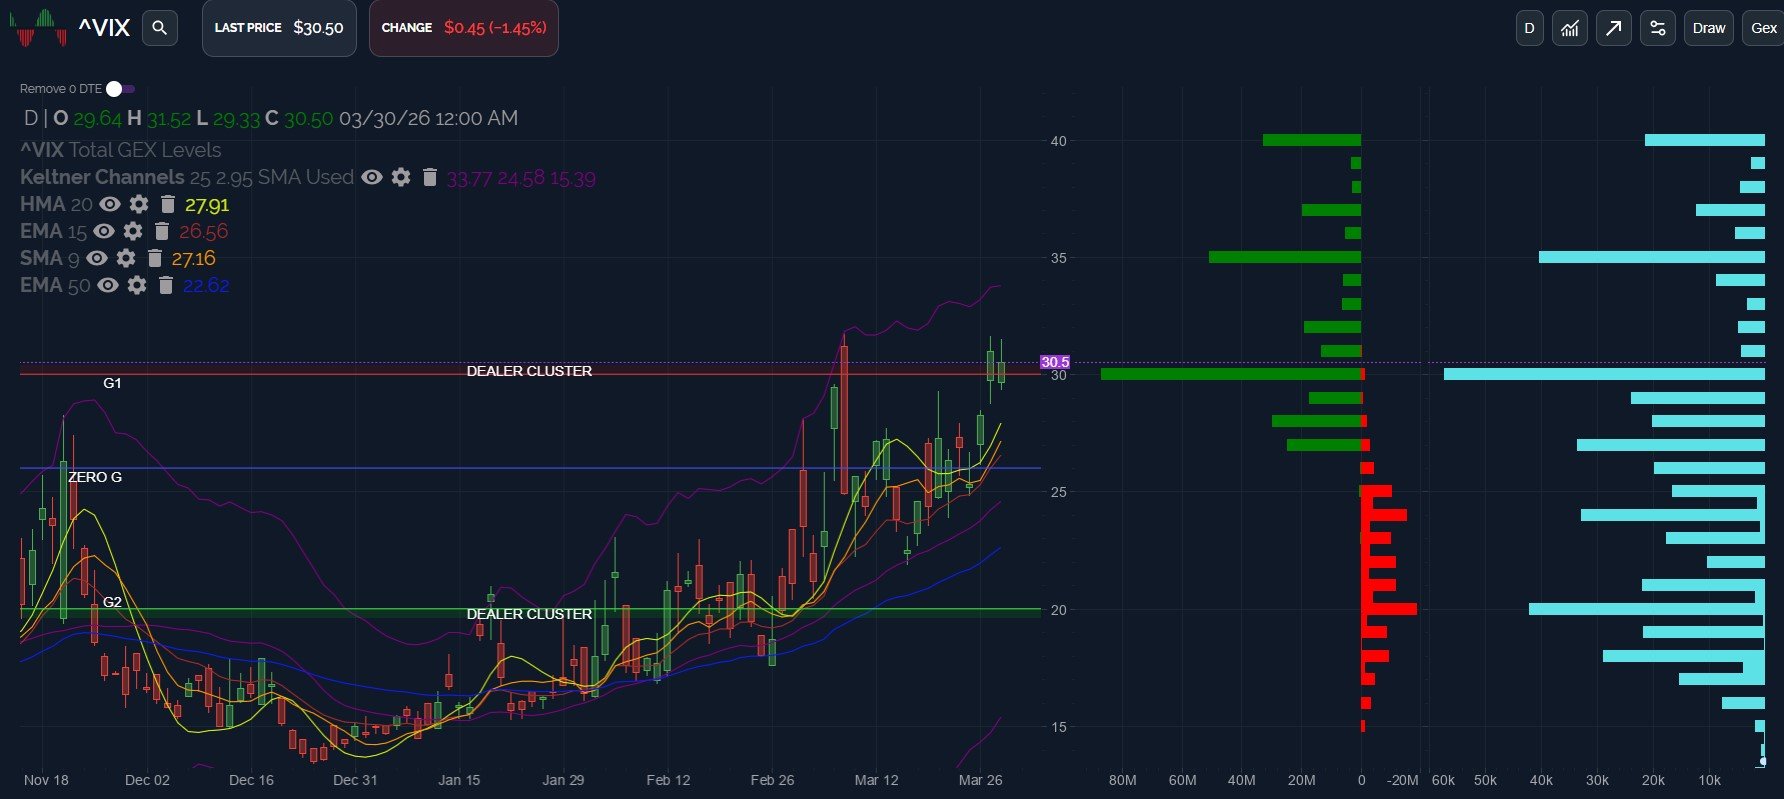
Another offsetting negative factor is the VIX, which maintains a strong climb higher without experiencing a major spike just yet.
GEX is positive, and we see GEX mostly up to the 40 strike, after which GEX drops off a lot.
Without a spike today, the VIX is “floating” above the cluster of rising moving averages.
I would like to see the VIX pullback initially to the HMA at 27.91, then maybe toward 23 in a stronger market rebound scenario.
There are many possibilities that could play out, so we’ll watch intraday developments and react accordingly, also sharing some observations in Discord.
To enter Discord as a non-subscriber, go to our homepage and click on Community to enter our Discord server! First-time guests receive a free 7-day trial of the premium Discord channels and this is where we discuss what’s happening in real-time. Thanks for reading!
We conduct a livestream that is accessible from our homepage every day around 10:30am ET, so feel free to join us there. You can also listen to our most recent livestream any time before the next day’s livestream occurs.
We just started an annual discount for the annual Portfolio Manager subscription, so enter EASTER2026 at checkout for $300 off of the portfolio manager annual subscription!
Thanks for being part of our community and know that we invite and appreciate your feedback!
The information provided by Geeks of Finance LLC is for educational purposes only and is not intended to be, nor should be construed as, an offer, recommendation or solicitation to buy or sell any security or instrument or to participate in any transaction or activity. Please view our Investment Adviser Disclaimer and Risk Disclosure.