
SPX Rallies Into Resistance: March 3 Stock Market Preview
We just started a new $300 discount for the annual Portfolio Manager subscription, which won’t last long. Enter code SPRING2026 at checkout!
Tonight’s YouTube video covers SPX, the VIX, IWM, SLV, GLD, and PLTR, so check it out if you have 10 minutes or so. You can view it by clicking Community at the top of our homepage to find the link to our YouTube channel!
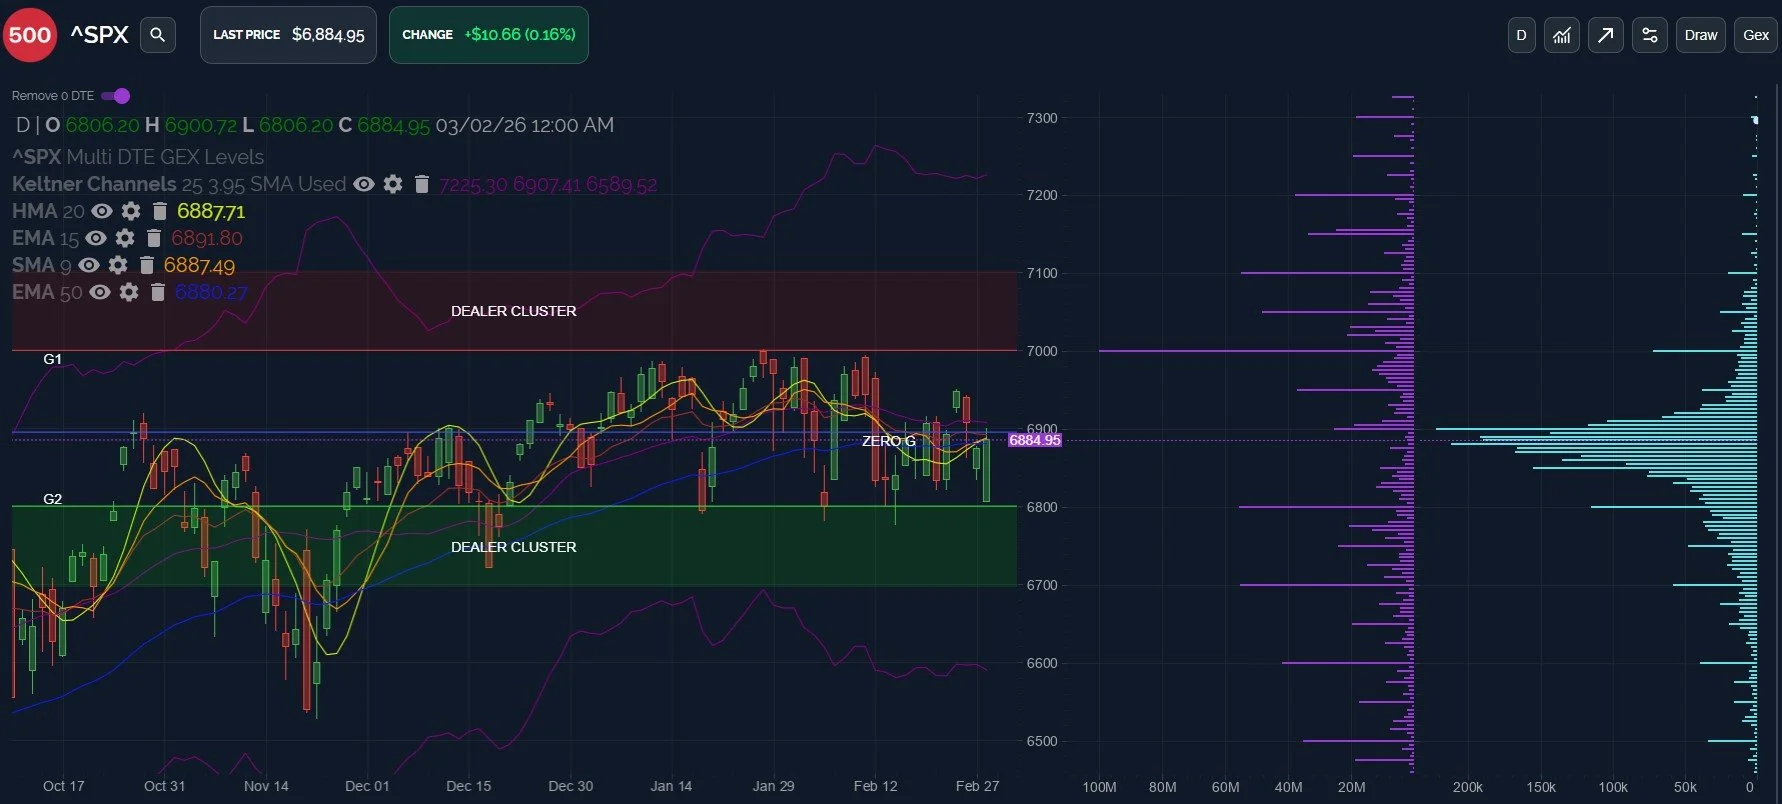
SPX printed the low right at the open today, rallying from 6796 all the way up to 6901 before fading into the close.
0 DTE GEX gave us an accurate picture of the likely target, which also coincides with HMA and 9 SMA resistance on the daily chart.
The impact of today’s rally on the chart shows continuation of a choppy sideways consolidation for SPX, with noteworthy GEX clusters on both sides of 6900.
7000 continues to be the largest net GEX cluster as well as the largest gross GEX area, appearing as a ceiling (for now), and possibly a target, if we see SPX convert 6900 to support. Choppy action on both sides of 6900 makes it difficult to form a high-conviction view of which direction is more likely, at least strictly looking at the chart and GEX, in my view.
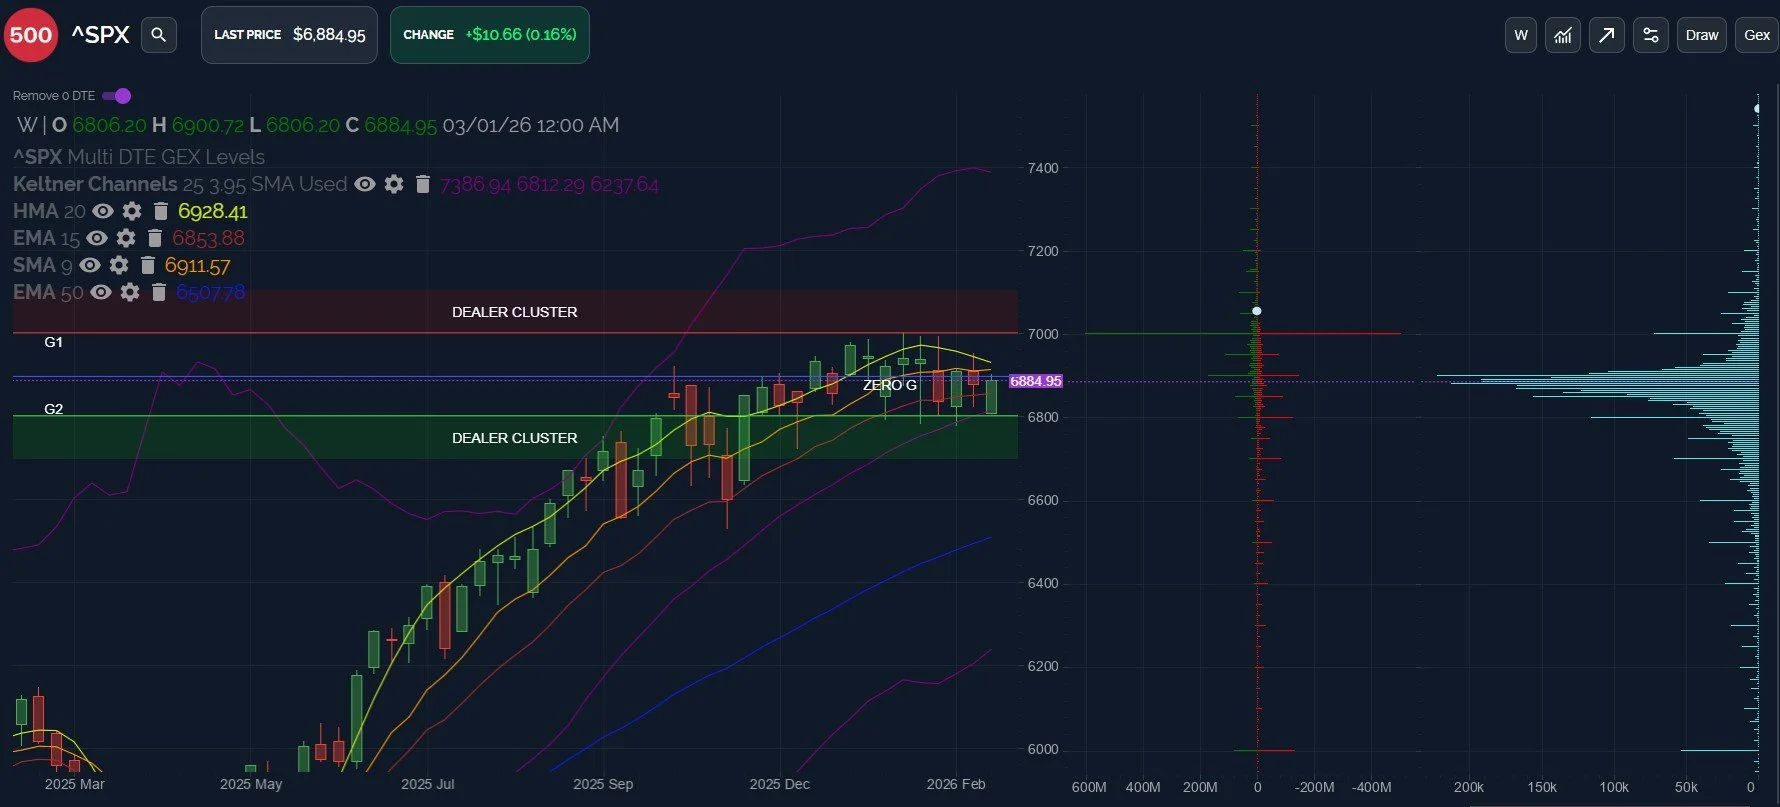
Let’s look at the weekly chart for SPX along with gross GEX instead of net, showing both positive and negative clusters at each strike instead of the sum of those two.
We see the large GEX clusters at the 7000 strike on both sides, and looking down the chain, we see noticeable GEX roughly every 50 points. These GEX clusters may represent support or resistance areas, even if they don’t show substantial GEX on a net basis (we view large net GEX clusters as possible targets).
SPX’s weekly chart shows the 9 SMA at 6911.57 and the HMA at 6928.41 as potential resistance areas overhead, giving us a range of approximately 6900-6930 that may be a significant area of resistance, and a meaningful area for bulls to conquer.
A loss of 6800 on a daily close may imply 6600-6700 may be seen more a more meaningful low point looking forward, in my view.
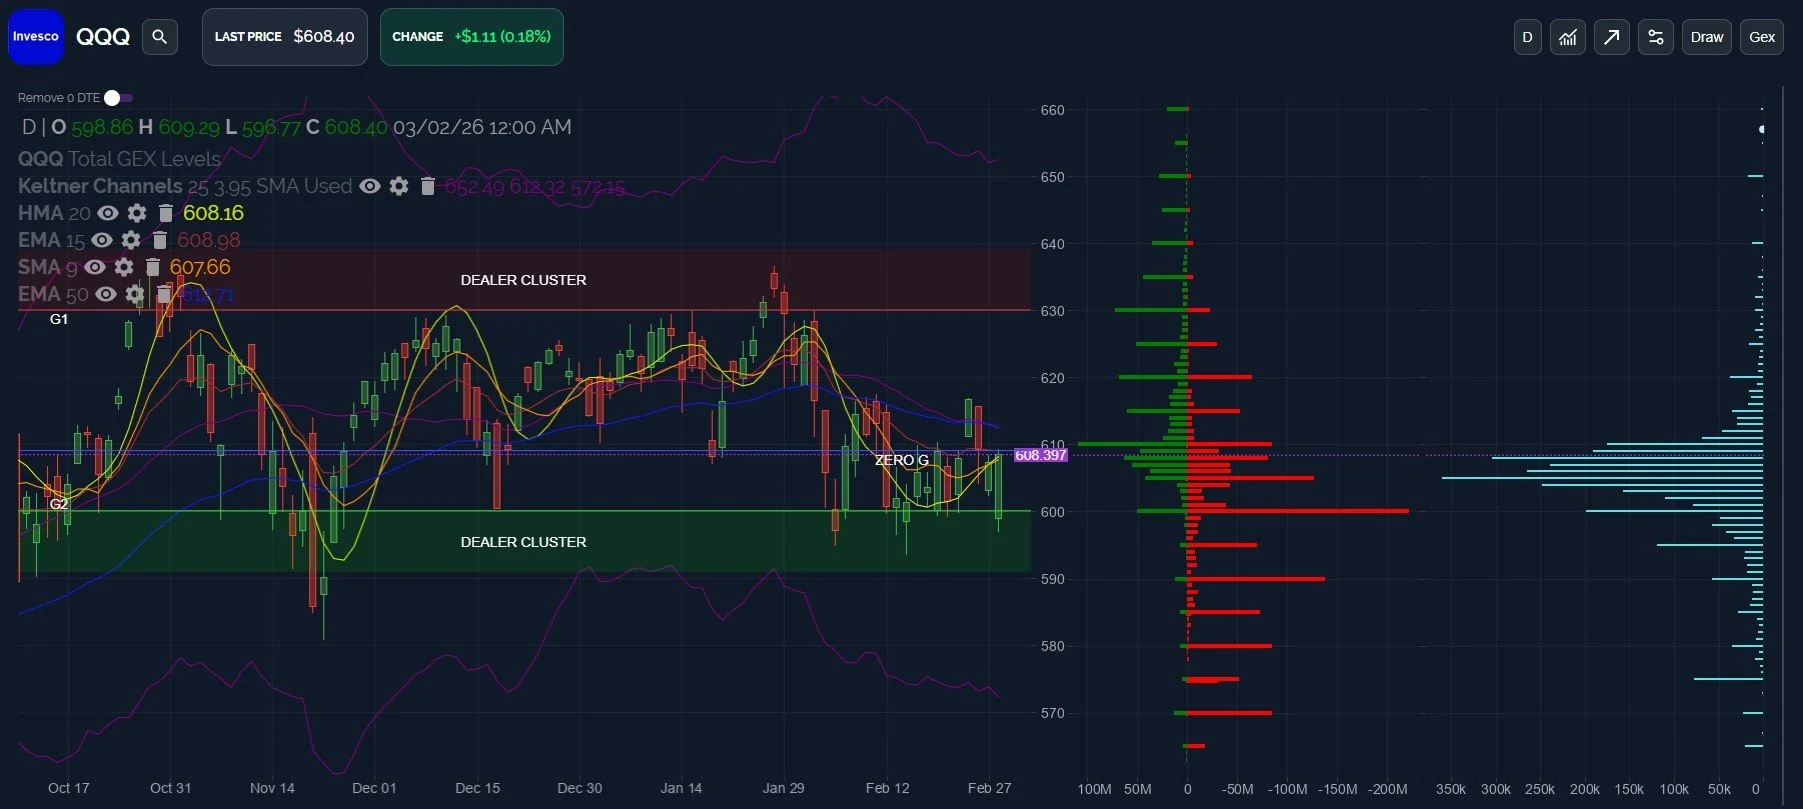
QQQ’s chart has looked less bullish than SPX or IWM since October, though we now have more than two weeks of choppy action similar to what we see with SPX.
QQQ also closed right at daily resistance, with 610, 615, and 620 being the next big GEX areas to watch. Last week’s high at 616.86 is also a level I’ll be watching.
Looking lower, we still have 580-590 that may represent bearish destinations if downside comes into play from this general resistance area.
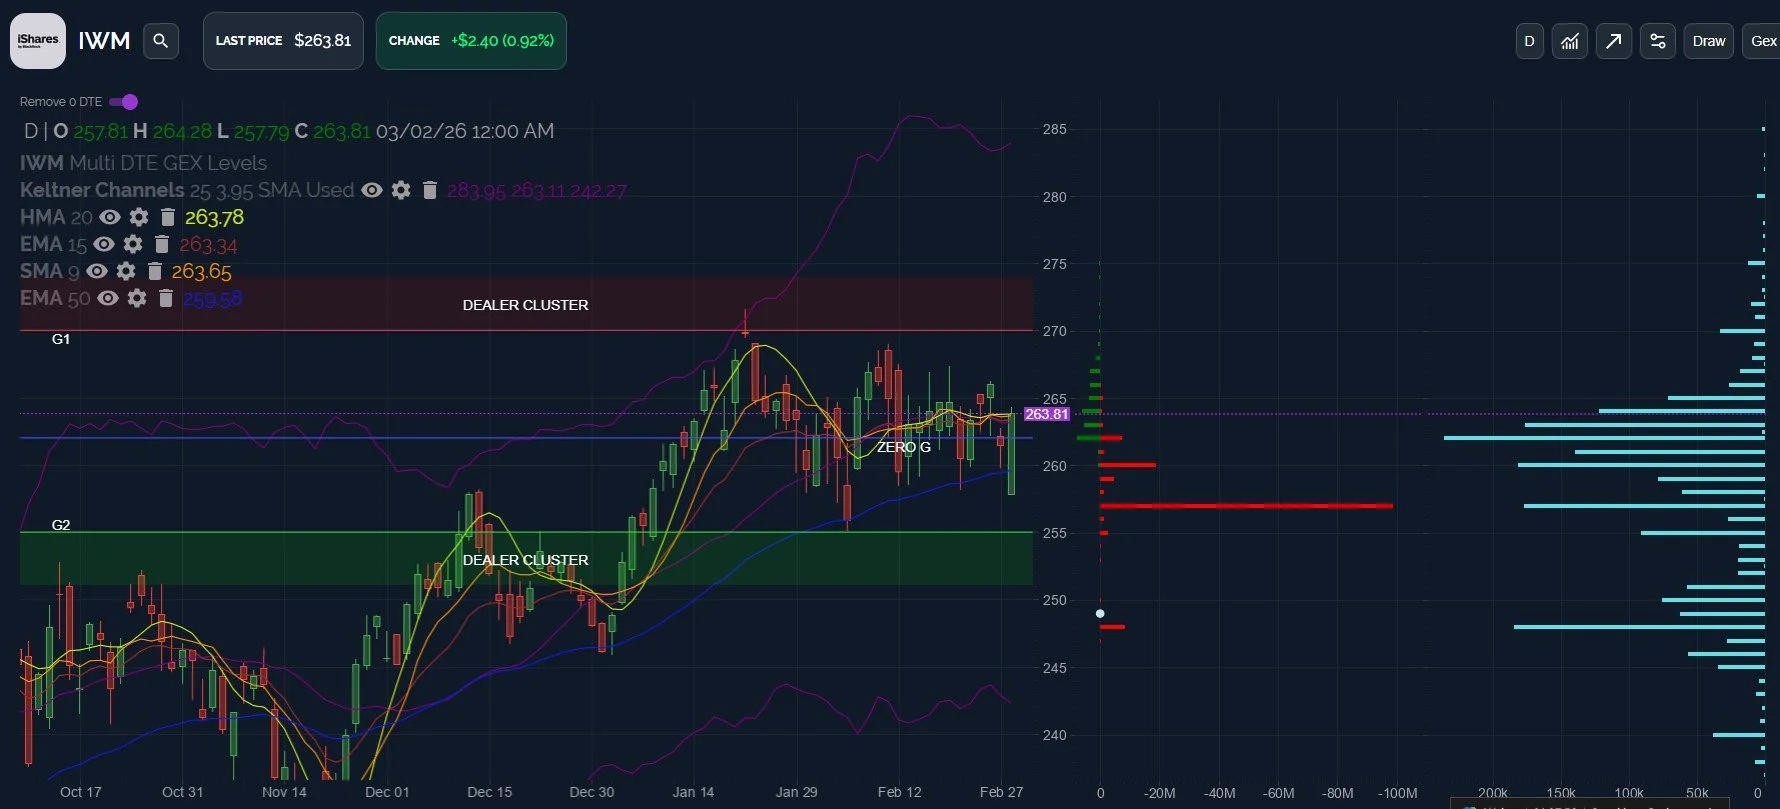
IWM opened up just below 258 before rallying to close at the highs of the day, right at a confluence of potential resistance lines formed by the daily HMA, 15 EMA, and 9 SMA. The move higher during the cash session was impressive to me, and IWM still looks more positive than QQQ.
That said, it’s worth nothing that we barely see any option volume today above the 264 strike, denoted by the light blue lines to the right of the GEX clusters. On the other hand, we see elevated volume all the way down to 247.
We also have an unusually large GEX cluster at 257 expiring tomorrow, introducing the possibility of the entire move up today being erased, if that target comes into play tomorrow.
Bulls will want to capture the moving averages near today’s close and head for 270, which would likely diminish the immediate odds for 257 to come into play, in my opinion.
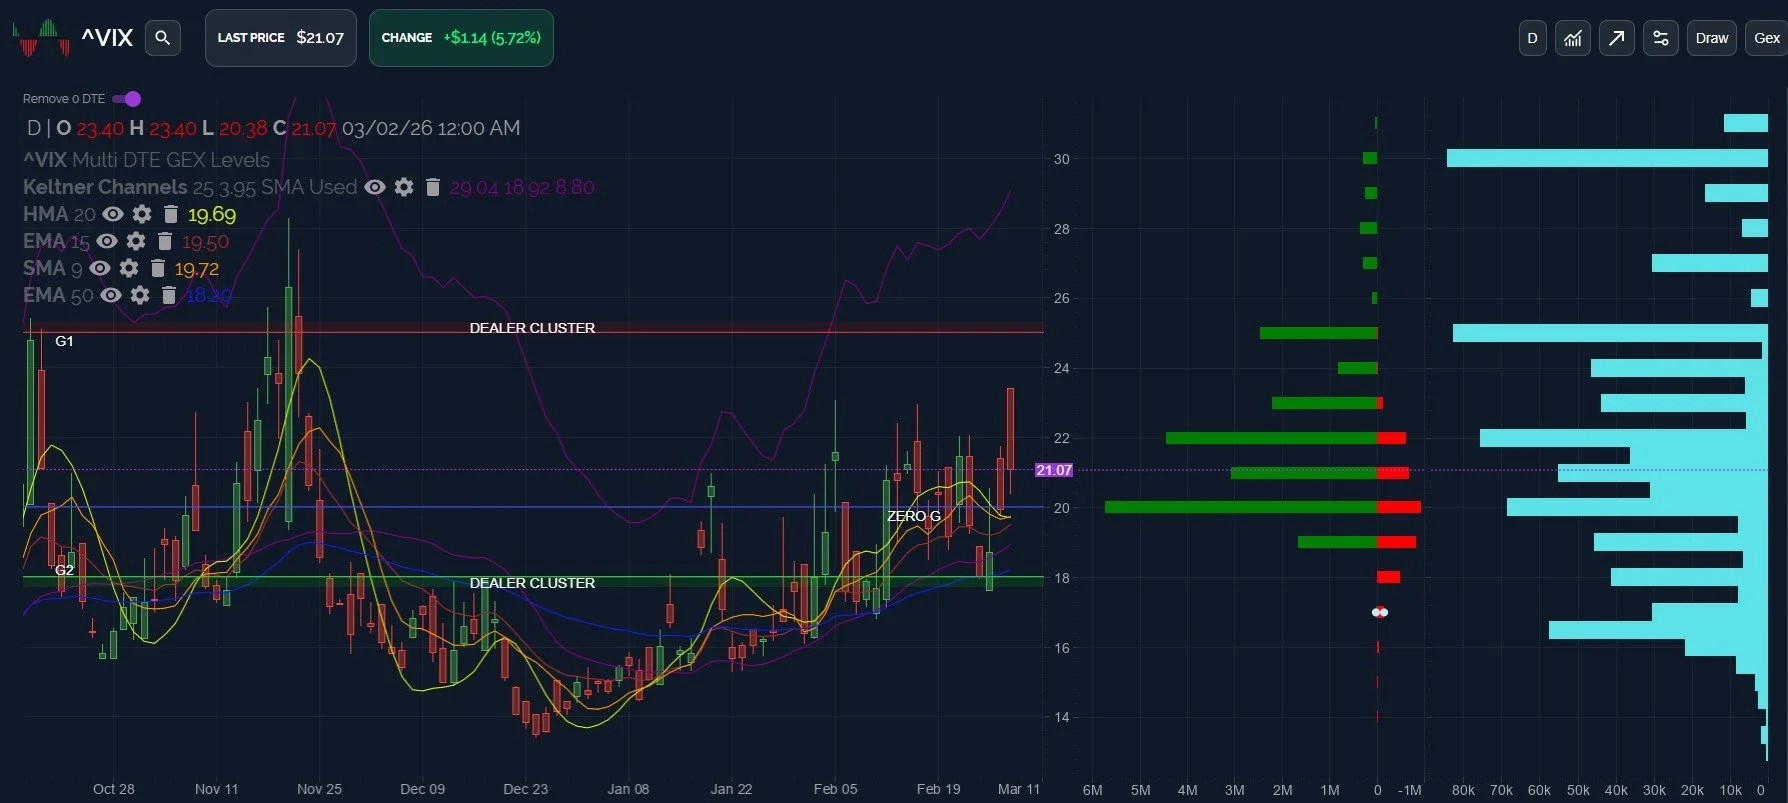
The VIX also showed an unusual strong shift deeper into positive GEX territory, inverse to the large decline that followed the gap up in volatility.
We also see high volume at 25 and 30 compared to other strikes.
In my view, the VIX can retest the 20 strike (or mid 18s) and still maintain the setup for a potential continuation move higher, whether as an uptrend over time, or a quick spike to new VIX highs. The upper Keltner channel is almost at 30, and we continue to see a positive skew for the VIX.
Market bulls may want to see a definitive break below 18 for the VIX to potentially show a breaking of the uptrend and a possible return to lower levels, but for now, the VIX remains in a positive GEX environment in an uptrend, even with today’s big red candle.
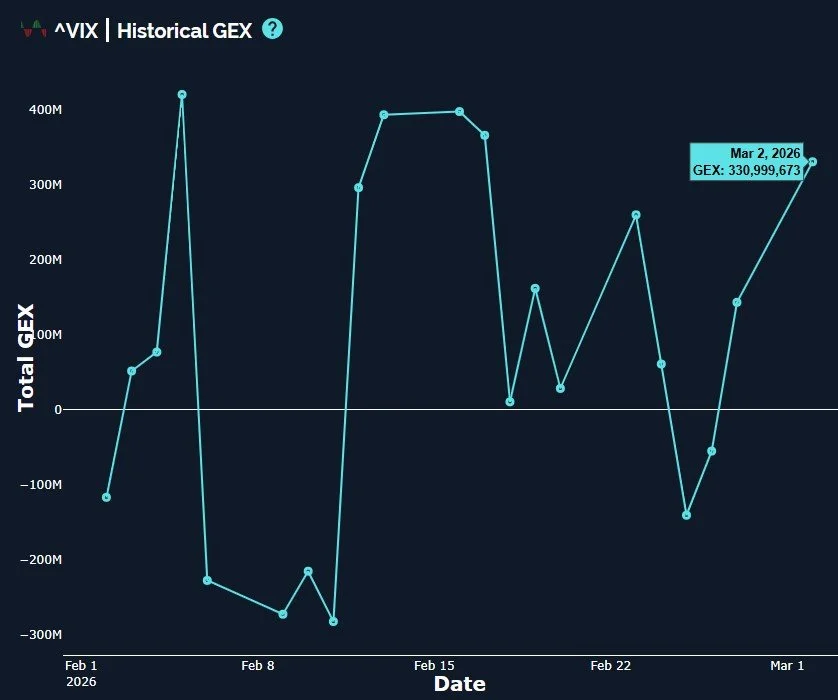
The VIX is reaching a positive GEX reading not far from previous highs in February, so will we see continuation for the VIX, or is this positive move closer to the end? Obviously only time will tell, but we’ll be incorporating a variety of signals across the indices and the VIX to form our own opinion about where we’re likely to go in the next few days.
We’ll share some observations in Discord daily, so we hope you’ll join us there!
To enter Discord as a non-subscriber, go to our homepage and click on Community to enter our Discord server! First-time guests receive a free 7-day trial of the premium Discord channels and this is where we discuss what’s happening in real-time.
We conduct a livestream that is accessible from our homepage every day around 10:30am ET, so feel free to join us there. You can also listen to our most recent livestream any time before the next day’s livestream occurs.
We just introduced an annual discount for the annual Portfolio Manager subscription, so enter SPRING2026 at checkout!
Thanks for being part of our community and know that we invite and appreciate your feedback!
The information provided by Geeks of Finance LLC is for educational purposes only and is not intended to be, nor should be construed as, an offer, recommendation or solicitation to buy or sell any security or instrument or to participate in any transaction or activity. Please view our Investment Adviser Disclaimer andRisk Disclosure.