
The Pullback Is Here..Now What?
THE SPRING PROMO IS HERE- We’re offering $300 off of the annual Portfolio Manager earlier than usual in March as we wrap up the 1st quarter of 2025 and celebrate the release of major updates last week! We now have overlayed chart indicators and several backtested algos complete with notifications and we anticipate more near-term improvements. Your needs are our focus, and we want the platform to become indispensable for your trading! Enter code SPRING2025 at checkout to take advantage of this limited time offering.
Yesterday’s VIX/VVIX divergence played out quickly, with a drop in indices today and a spike in the VIX. This divergence sometimes takes days to result in a reaction, so the divergence between the two can be helpful for swing traders, but it’s not an exact indicator for day traders. The real momentum didn’t even start until after the cash session started, so even day traders had time to position for the decline in this case, backed by intraday GEX data that we shared in Discord. Let’s take a look at what today’s action is telling us about the next few days, and we also recorded a YouTube video, which you can view by clicking here. A few different tickers are discussed that you won’t see in the newsletter.
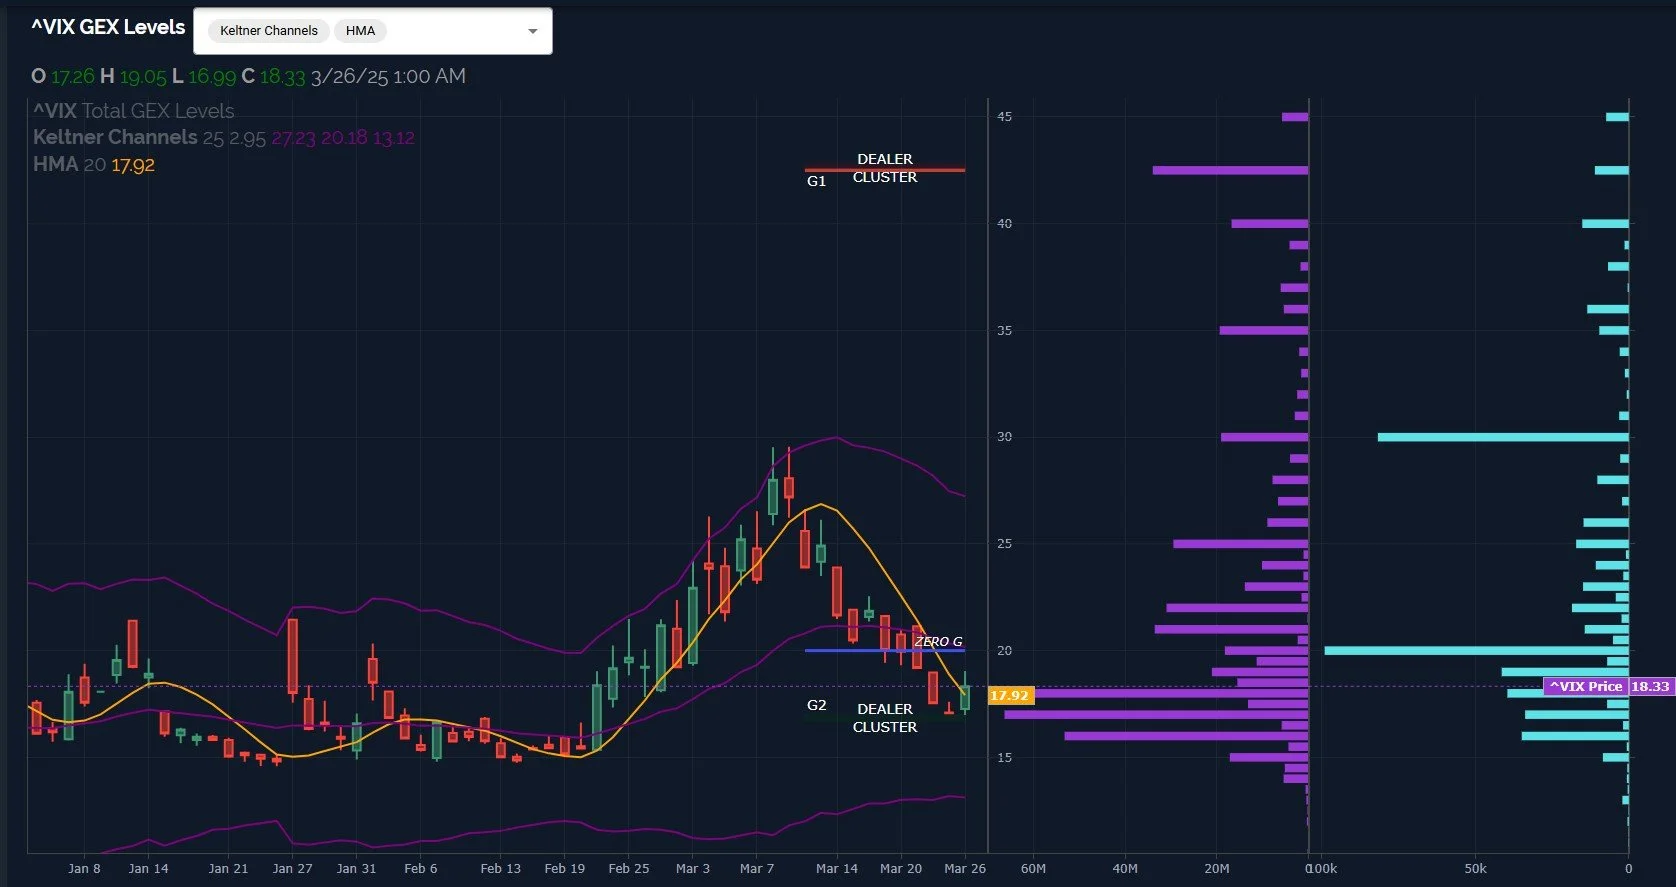
The VIX bounced nicely off of the big lower dealer cluster at 17, as seen on the chart above, achieving a daily close above the Hull moving average, something that hasn’t happened since March 11. Closing above the Hull is a long signal according to my methodology, which might not be great for market bulls. To caution that the inverse of what we saw when the market was declining (occasional closes right at the line that failed the following day) might happen, an immediate market rally tomorrow will likely invalidate this signal. But notice the elevated volume at VIX 20 and VIX 30. We noted elevated volume yesterday, as well, and we have virtually nothing but higher VIX GEX above 15. So downside is likely limited for the VIX, while upside is potentially expansive, in the very big picture.
Looking at SPX below, in one day we saw a big shift back in the negative direction, with a lot of GEX disappearing from higher strikes while 5500-5700 saw more interest and sizable GEX clusters either remaining or increasing Technically, we see SPX almost touching the Hull, and holding it for now, so we have a conflicting long signal for the VIX yet also a long signal for SPX. With the Hull below the SPX currently sitting at 5684, at least we have a fairly tight “stop” to watch to potentially reduce longs for those tactically watching the Hull as an indicator.
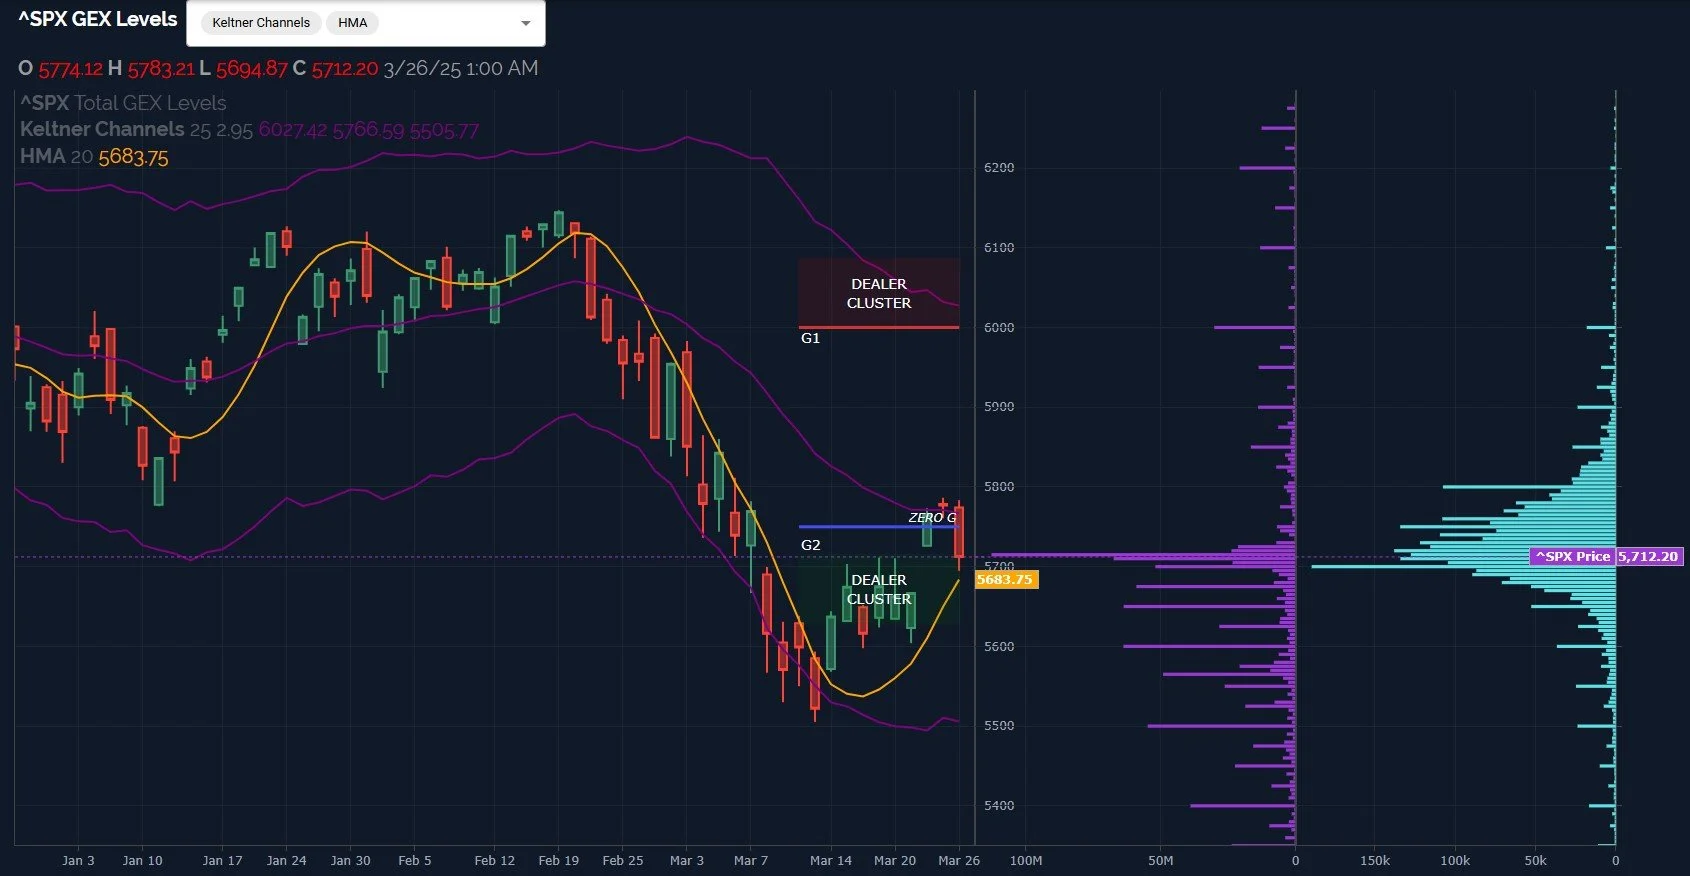
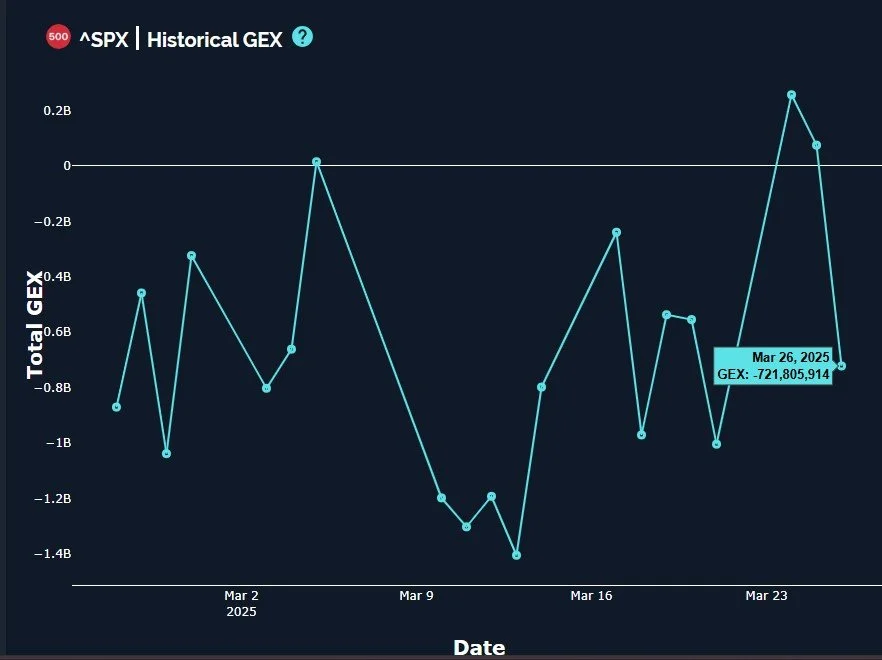
SPX net GEX dropped sharly, a change of roughly -800M, sending GEX back down to what seems to be an approximate average since the drop started. Is this an overreaction and a setup for a rally into quarter end? I truly don’t know, and so far, the only scenario I laid out two days ago that is invalidated is the last one where we make a straight shot toward 6000 and decimate puts. Given the action over the last two days, I wouldn’t be surprised by a more bearish outcome, but the rebound scenario is still a possibility as well.
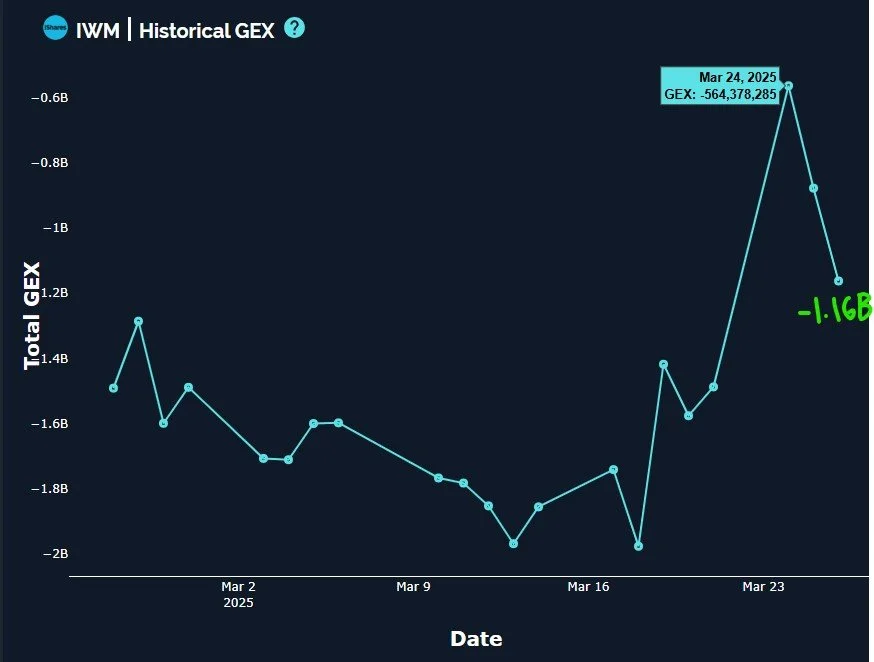
I wish I had better news for IWM, but I don’t. The mysterious disappearance of GEX at 215 may not be so mysterious, but it still remains, with virtually no positive GEX visible except a few tiny clusters spread out up to 220 and beyond. Volume was noteworthy at lower strikes, especially 195, and IWM closed below the Hull, a bearish signal. Perhaps the best news for IWM is that the lower Keltner has slightly turned, lessening the trajectory to the downside for the Keltners, and the GEX clusters look a bit extreme, maybe too one-sided toward the negative.
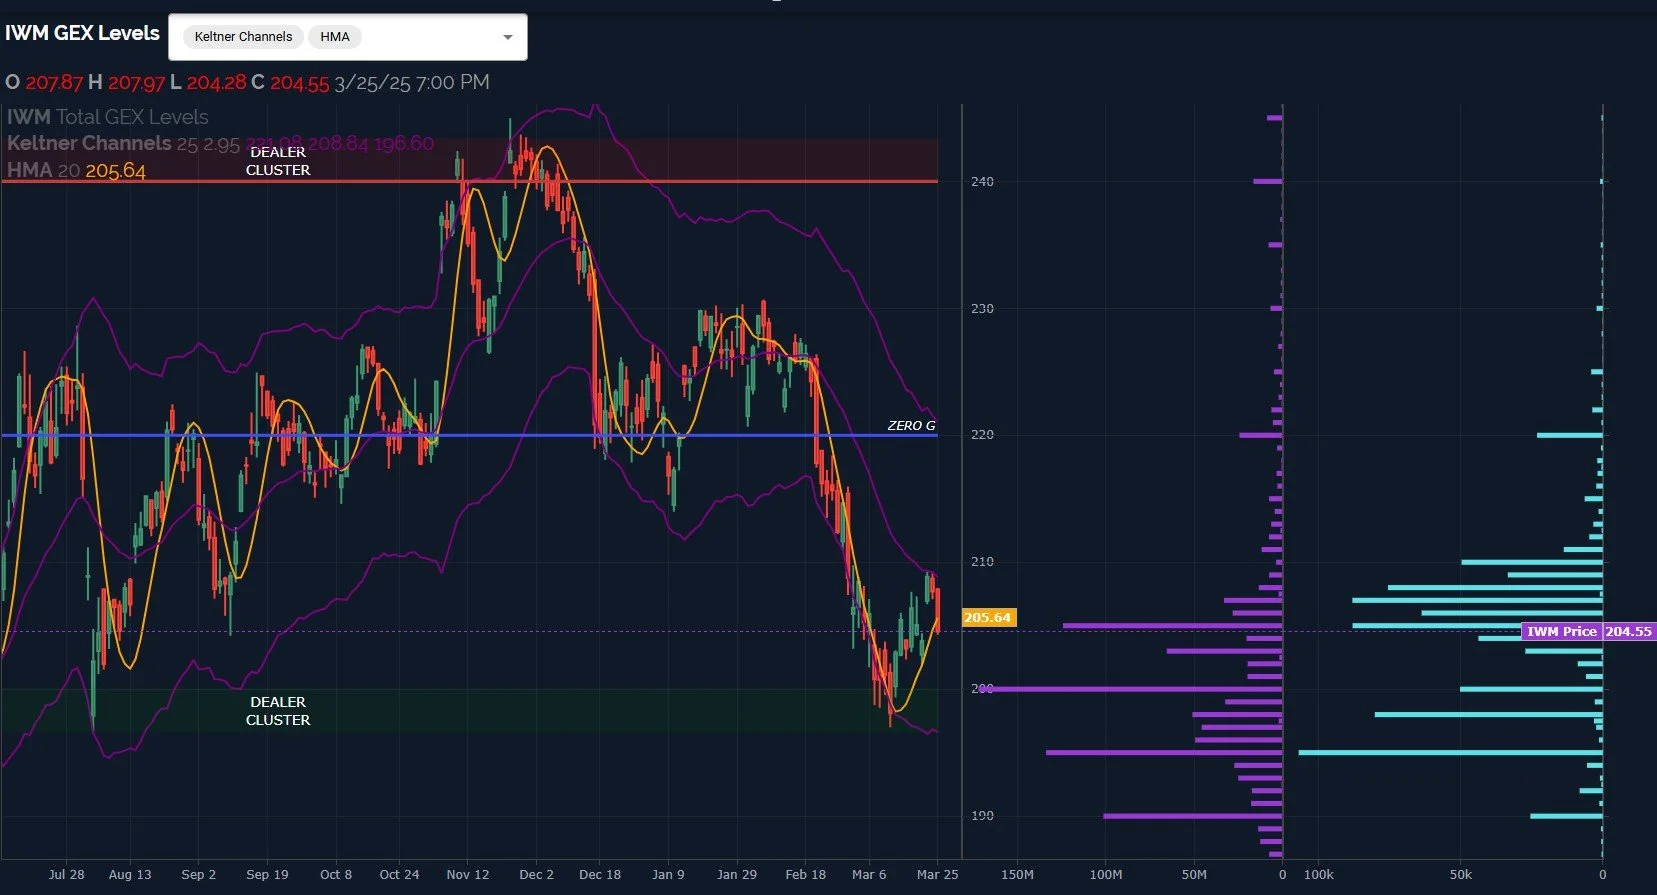
IWM GEX isn’t at an extreme though, it simply had a nasty decline to -1.16B and looks negative. I don’t know how to put lipstick on that pig, sorry!
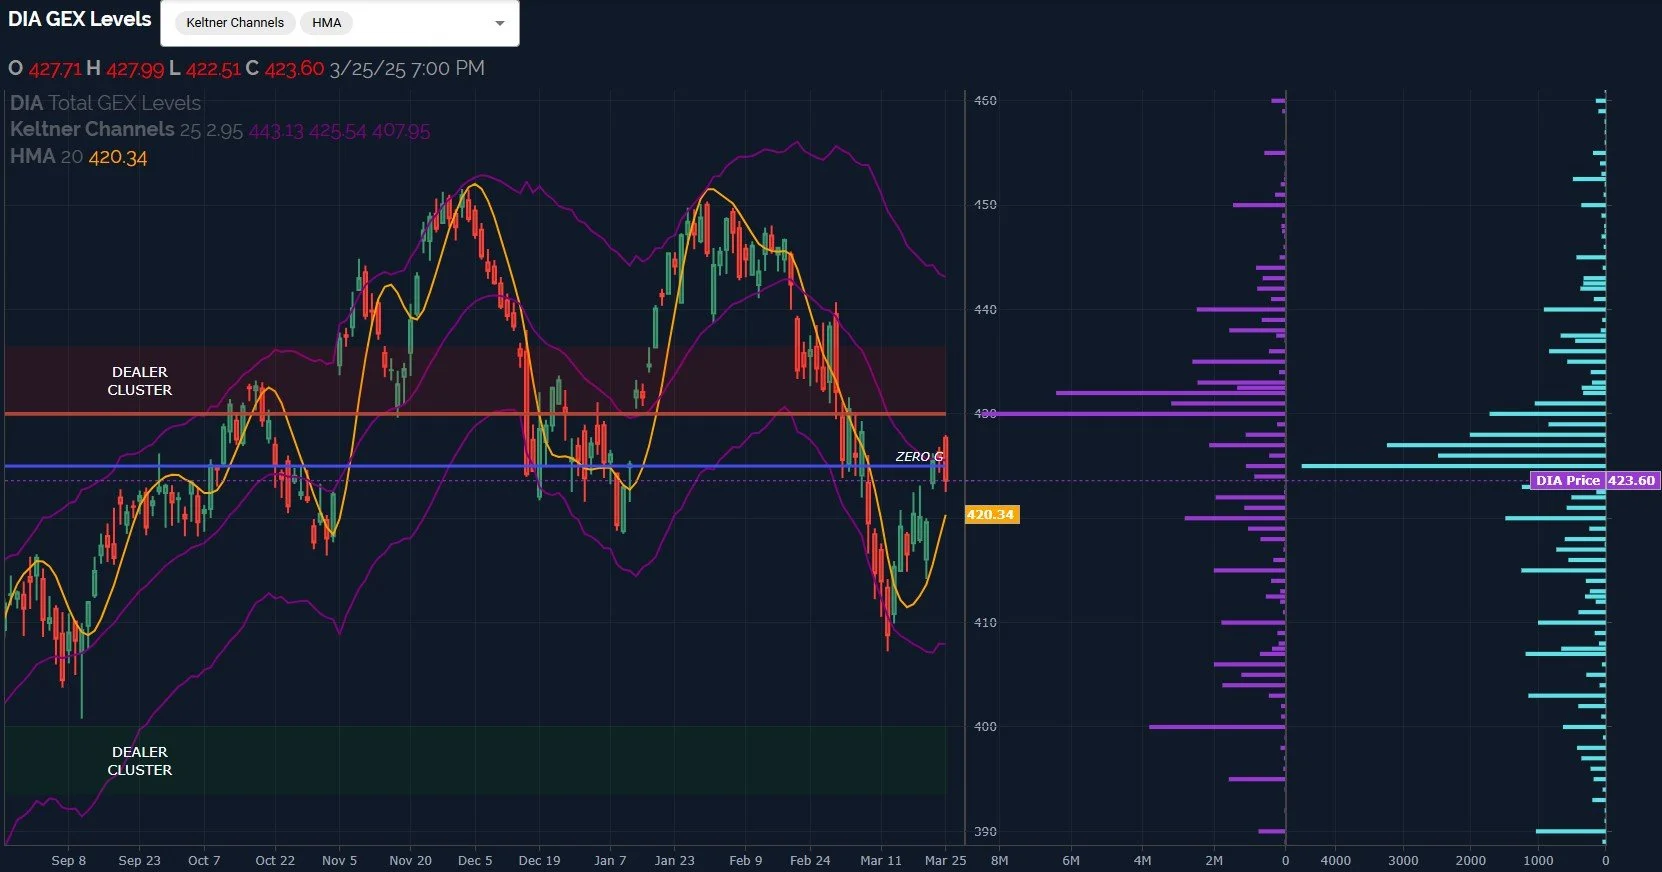
Alright, let’s not all go to bed wondering why we didn’t accumulate more hard assets like Bic lighters and bullets (or bullion?), let’s end with something positive for bulls. At least DIA is still looking like the strongest game in town, not quite declining to the rapidly rising Hull, and the lower Keltner channel has turned up. I still see 430+ as a solid target that hasn’t been reached, with large GEX clusters present. The angle and trajectory of the Hull itself means staying above it will require immediate reaction from price, but at least we will have the answer as to where we go next relatively quickly. Join us in Discord and we’ll do our best to share any clues presented by 0 DTE GEX.
Here’s the Discord link if you haven’t joined us yet! Access is free for some channels, and new members have a 7-day trial within Discord to see how we operate. We have an active community of thoughtful traders who chime in throughout the day, sharing ideas and opportunities as we see them.
If you’re interested in accessing our tools and analytics, be sure to check out our website! We rolled out backtested algos and chart indicators and we have more improvements on the way!
If you’re interested in learning more about our strategy and approach, we address all of these topics in our Geek University course which is included in all memberships.
We recently posted a YouTube video after the market close today, and we have many other short videos, so give our channel a look if you’re curious about recent market commentary and ideas as well as gamma (GEX) concepts explained.
Thanks for being part of our community and know that we invite your feedback!
The information provided by Geeks of Finance LLC is for educational purposes only and is not intended to be, nor should be construed as, an offer, recommendation or solicitation to buy or sell any security or instrument or to participate in any transaction or activity. Please view our Investment Adviser Disclaimer and Risk Disclosure.