Divergences Form: False Alarm?
THE SPRING PROMO IS HERE- We’re offering $300 off of the annual Portfolio Manager earlier than usual in March as we wrap up the 1st quarter of 2025 and celebrate the release of major updates last week! We now have overlayed chart indicators and several backtested algos complete with notifications and we anticipate more near-term improvements. Your needs are our focus, and we want the platform to become indispensable for your trading! Enter code SPRING2025 at checkout to take advantage of this limited time offering.
Today was a mixed bag, with some positive developments and some potentially negative divergences. Yesterday we went over 4 potential scenarios that might play out into quarter end, though not an exhaustive list, and today gave clarity to zero of those possibilities. That said, we need to address a few potential concerns that may imply downside before more upside. Given that we’re dealing with a fairly short timeframe of several days, validation or invalidation will be fairly immediate as we approach Wednesday and Thursday. We discuss various tickers not covered in the newsletter and complementary points on broader indices in our YouTube video posted this evening, so give it a view by clicking here in addition to what we say in the newsletter. You’ll notice some overlap, but each video is 8-10 minutes long, so it’s not a lot of time committed either way (don’t tell us your hourly rate!).
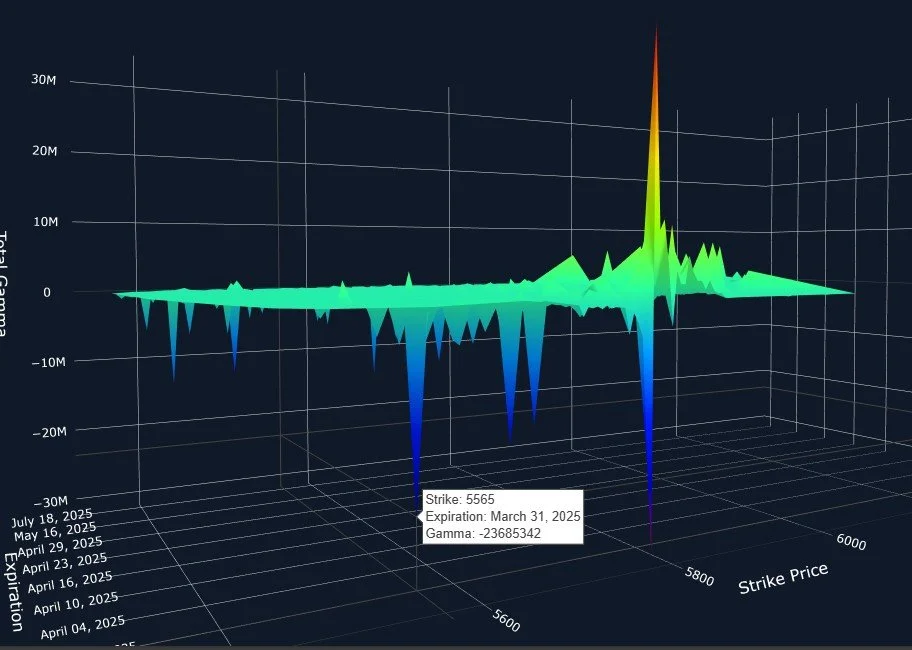
To start with the positive, SPX GEX has noticeably increased at positive strikes, ranging from 5850 all the way up to 6100. This at least equalizes the GEX clusters at lower strikes. We also still saw volume at higher strikes, though negative strikes saw a little more action once we look beyond the next 100 points up or down. The upper dealer cluster zone remains between 6000-6100, which is definitely bullish in light of the overall increase in GEX in recent days as well as the price action. We can also make a somewhat neutral point, that SPX is still holding the middle Keltner channel while GEX has grown at higher levels. But the candle today was a red indecision candle or doji, and while the Hull moving average has turned up, it’s still at roughly 5650, quite a distance below the current price. As the graph below demonstrates, we also saw a modest reduction in positive GEX to less than 100M, within the neutral zone overall, yet barely above zero.
I am also drawn to a consistent data point that has lingered for a few days: Besides the 0 DTE clusters that expired today, the largest cluster for 3/31 is at 5565, a negative GEX cluster. Why hasn’t that cluster disappeared if we’re going to 6000? I don’t see a corresponding positive cluster that might tell us we’re dealing with a hedge situation, though that’s not the only explanation.
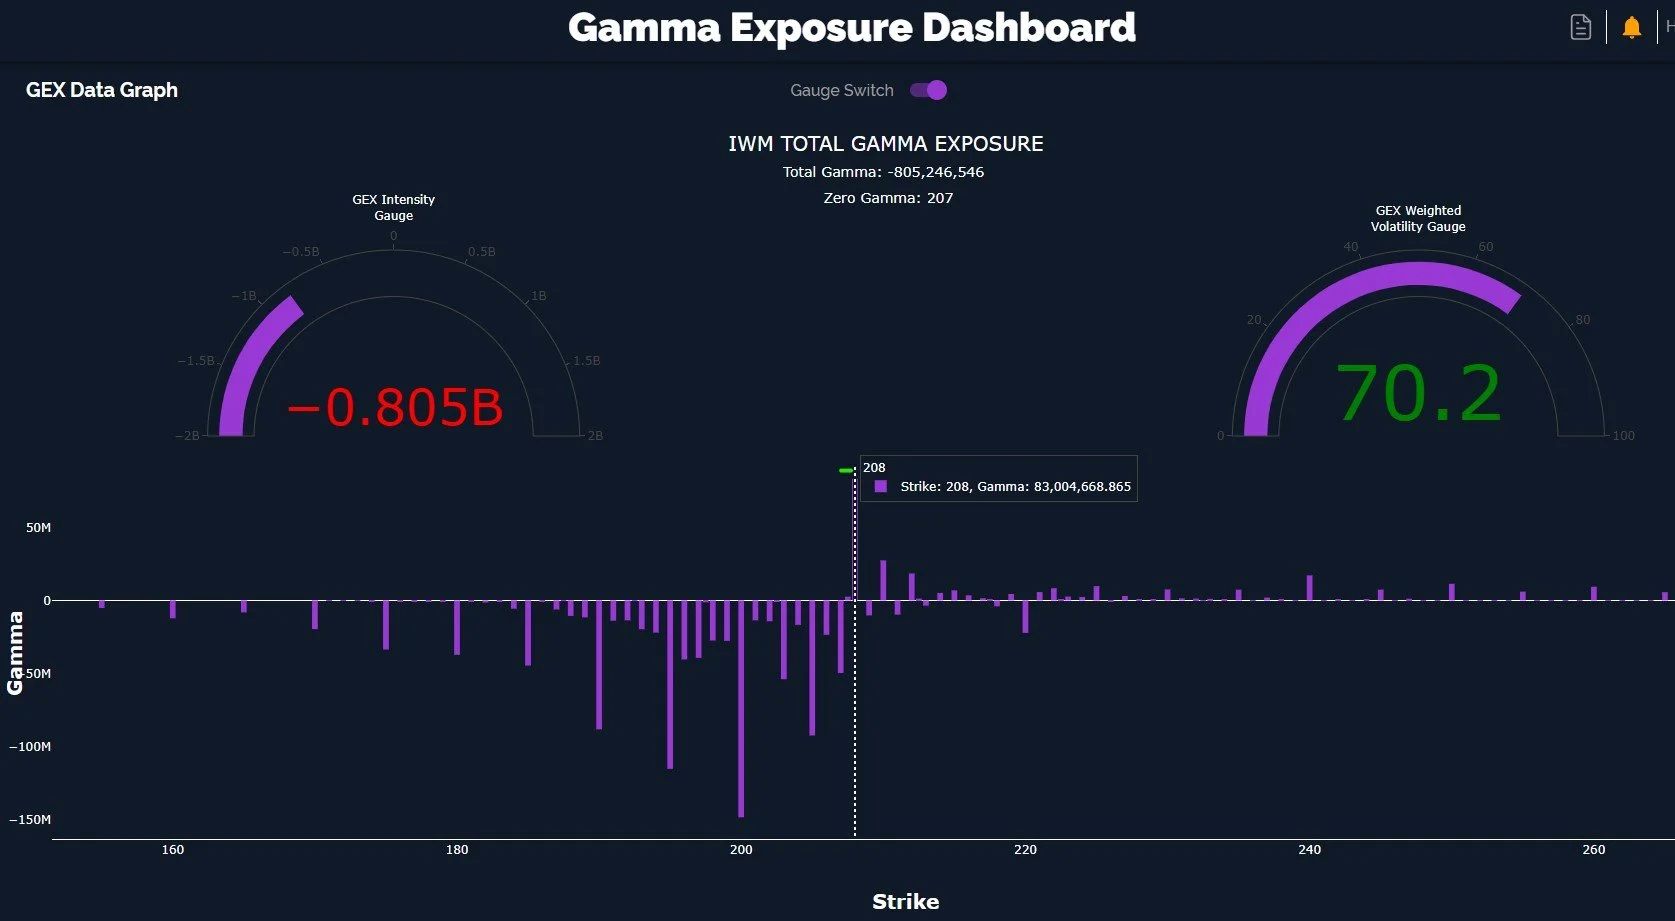
IWM was even worse, gapping down today, though closing higher than the cash session opening price. But even the closing price today was lower than yesterday’s close, so IWM is lower, right at the rapidly rising Hull. A loss of 203 on a daily close and tactically I’ll flip bearish on IWM. A subtle yet potentially important shift today- the GEX at 215 that I’ve mentioned and watched over the last week is gone. You can see the volume in light blue, but the GEX is almost nothing. 199 and 198 saw elevated volume today compared to every strike except those between 206-210, why? I also don’t like the lower Keltner continuing to dive even lower with each passing day. This (sadly for bulls) makes sense if the SPX 5565 cluster on 3/31 is live and a high probability target. We still have enough time to see the picture shift, or for divergences to expand for a few days while the market stays “propped up,” so don’t take my questions and points as a guarantee that we immediately drop.
Another way of showing IWM’s current position- we have negative GEX, well off of the extremes, and 208 is now the largest positive cluster. Bears remain stubborn at lower strikes, especially down to 190.
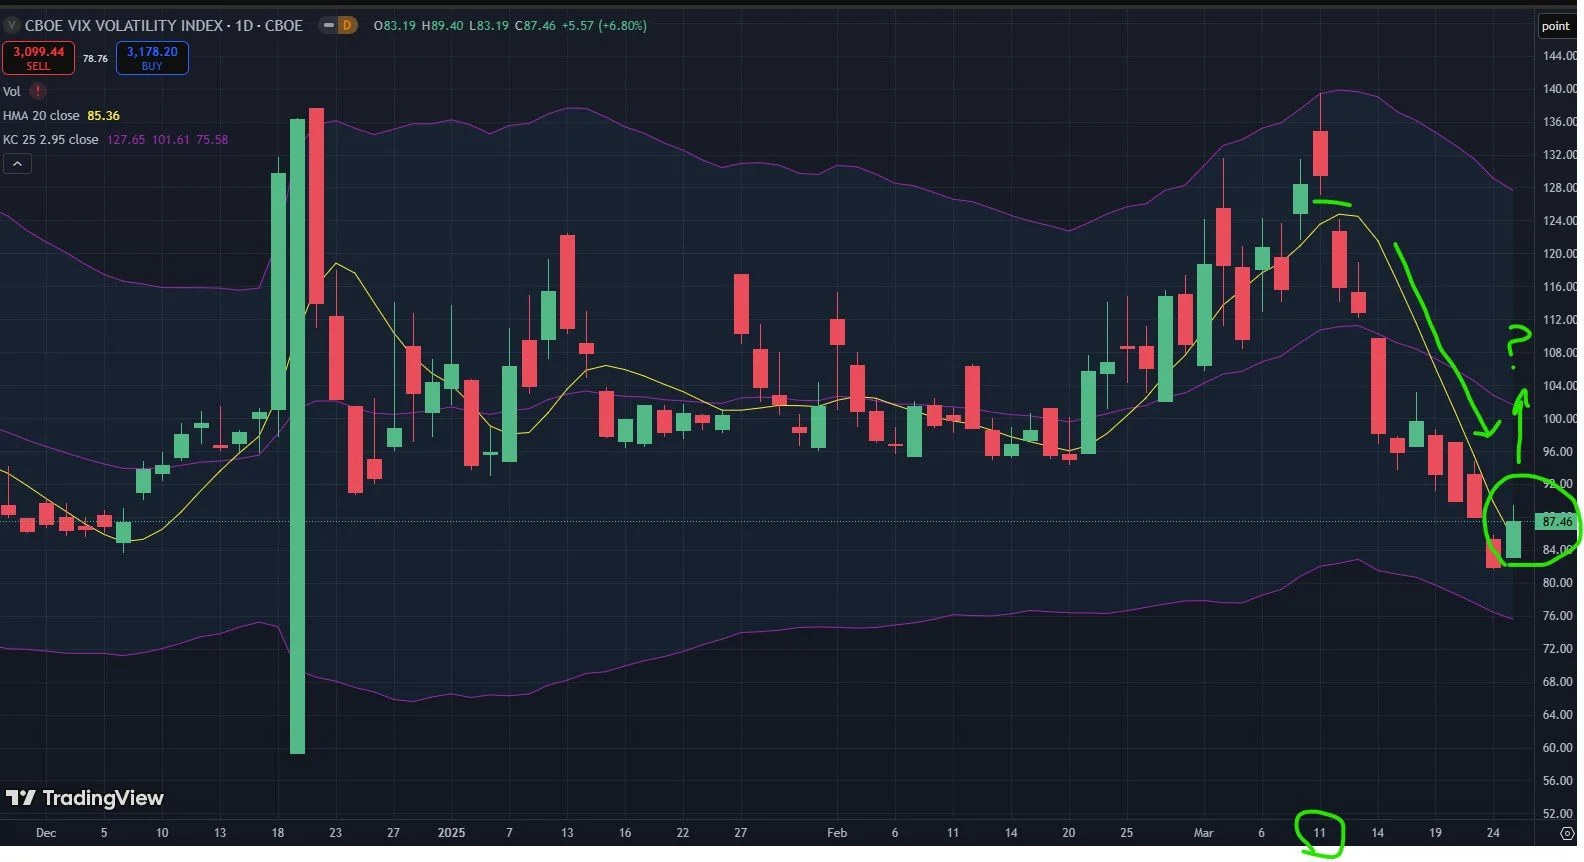
I also want to point out that today not only saw VVIX (the index measuring the future expected volatility of the VIX itself) rise almost 7% while the VIX was down, but the VVIX also closed above the Hull for the first time since its high on March 11. Keep in mind VVIX can rise while the VIX continues dropping for a period of time, or both VVIX and the VIX can rise together while the market also rises, so this observation isn’t a slam dunk..But the eventual resolution is usually not too kind to bulls with blinders on.
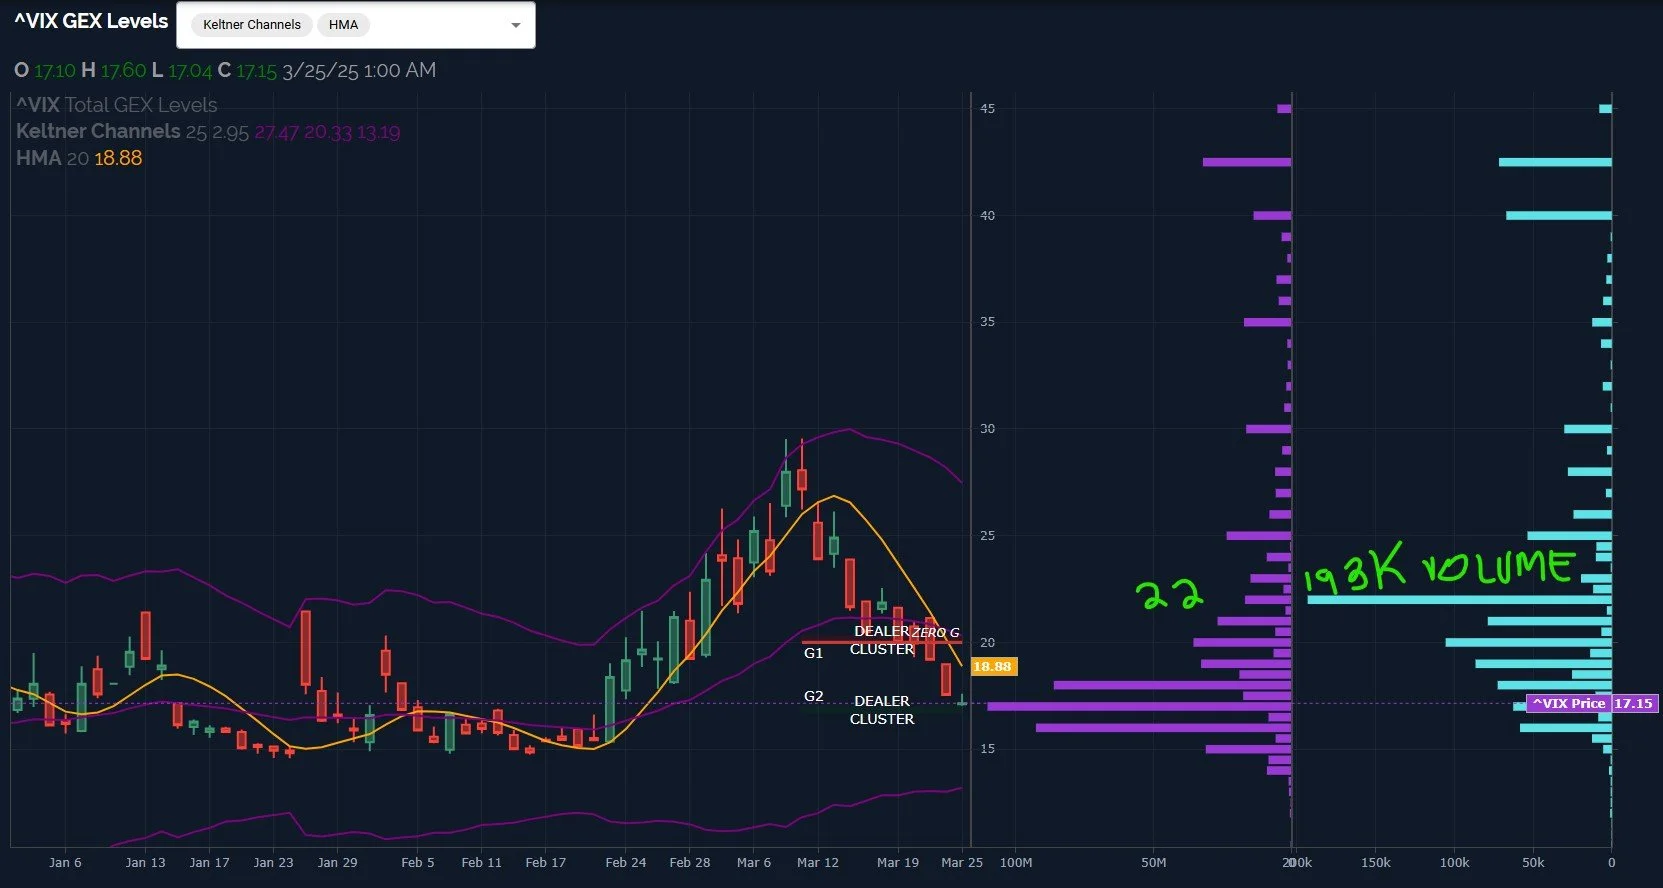
The VIX can continue to drop while VVIX rises, but today saw a curious development, the VIX is now above the Hull and closed higher than 5 sessions ago.
We also see the VIX in a lower dealer cluster zone at 17, with very elevated volume at 22, and even some activity at 40 and 42.5 (a theme we’ve seen repeatedly in recent days). I’ve highlighted some contradictory bearish points in the newsletter that are focused on what I view as near-term risks, not necessarily a conclusion of whether or not the rebound in totality is over, but we do need to be mindful of the risk of at least a backtest to 480 QQQ or potentially 5650 SPX. The behavior at the time of such a backtest will more definitively set my expectations of reaching 6000 (which is entirely possible- even if it takes until late April) or heading toward 5565 by Monday and possibly lower. Join us in Discord where we’ll discuss new developments throughout the week.
Here’s the Discord link if you haven’t joined us yet! Access is free for some channels, and new members have a 7-day trial within Discord to see how we operate. We have an active community of thoughtful traders who chime in throughout the day, sharing ideas and opportunities as we see them.
If you’re interested in accessing our tools and analytics, be sure to check out our website! We rolled out backtested algos and chart indicators and we have more improvements on the way!
If you’re interested in learning more about our strategy and approach, we address all of these topics in our Geek University course which is included in all memberships.
We recently posted a YouTube video after the market close today, and we have many other short videos, so give our channel a look if you’re curious about recent market commentary and ideas as well as gamma (GEX) concepts explained.
Thanks for being part of our community and know that we invite your feedback!
The information provided by Geeks of Finance LLC is for educational purposes only and is not intended to be, nor should be construed as, an offer, recommendation or solicitation to buy or sell any security or instrument or to participate in any transaction or activity. Please view our Investment Adviser Disclaimer and Risk Disclosure.


