
Un”bear”able Rebound In Play
THE SPRING PROMO IS HERE- We’re offering $300 off of the annual Portfolio Manager earlier than usual in March as we wrap up the 1st quarter of 2025 and celebrate the release of major updates last week! We now have overlayed chart indicators and several backtested algos complete with notifications and we anticipate more near-term improvements. Your needs are our focus, and we want the platform to become indispensable for your trading! Enter code SPRING2025 at checkout to take advantage of this limited time offering.
Today was a classic gap & go to the upside, perhaps a pattern not remembered by anyone given the brainwashing of the last month’s price action. In all seriousness, nice follow through after Friday’s rally. Indices are now approaching important initial resistance, so we will be watching price action and gamma exposure (GEX) closely for clues regarding the next move. With 5 trading sessions still remaining until conclusion of next Monday’s final day of the quarter, we have a lot of time and a variety of possible scenarios that can still play out. I would categorize 4 potential scenarios as follows, in no particular order:
1) Choppy up and down sideways action after a test of 5800, down on the final day
2) Down to retest the Hull on SPX at 5610, then up to 5800-5850 or slightly higher by Monday (5881 would let CNBC say “the market is flat on the year”)
3) Down to 5400-5500 by Monday, marking an important short-term low
4) Scorched earth for put options, we gap up and climb 4-5% over the next few days and reach 6000 by Monday’s close, what correction?
Now that I’ve covered most of the main scenarios, we can say we were right no matter what! I’m kidding, of course. In today’s YouTube video, we discuss some overlapping and some different aspects of SPX and QQQ as well as other tickers not covered in the newsletter, such as PLTR and SMCI, so give it a view by clicking here.
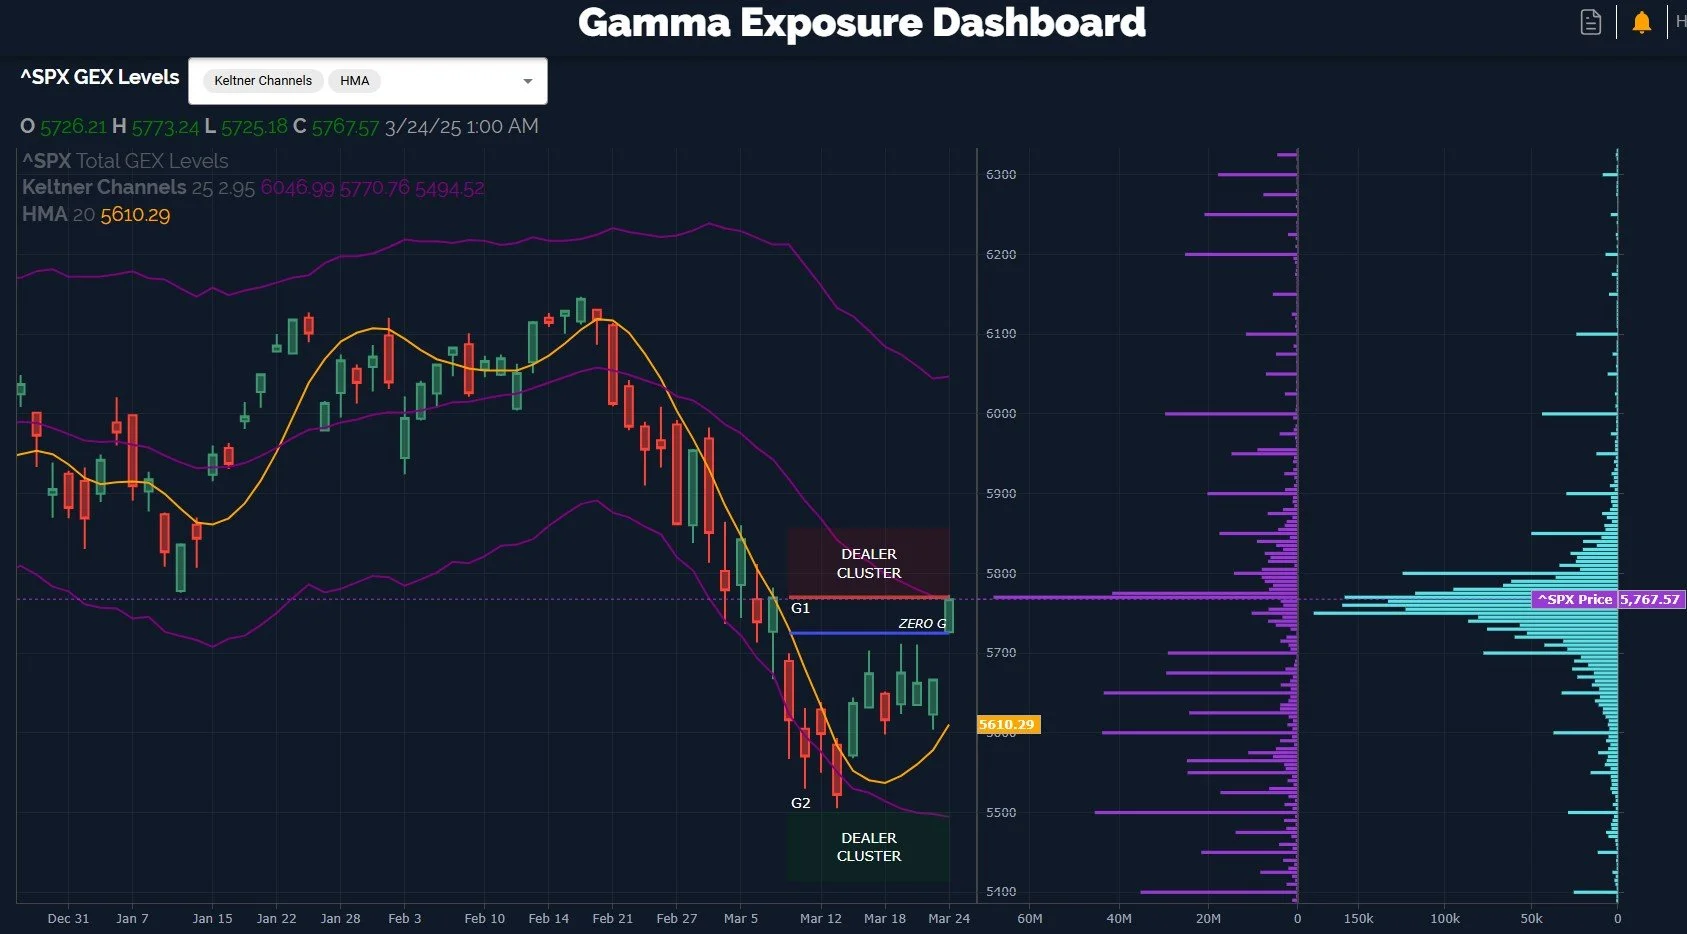
Starting with SPX, the above GEX Levels chart from our website shows higher volume in light blue at higher strike prices, particularly 5800, 5850, and 6000. Last week I mentioned that the lack of substantial GEX between 5700 and 6000 could result in a fast elevator ride toward higher prices if upward momentum continued, though we actually saw a sizable reduction in negative GEX and an increase in positive GEX today that brought 5900 to the table, so we are starting to see some other potential destinations emerge.
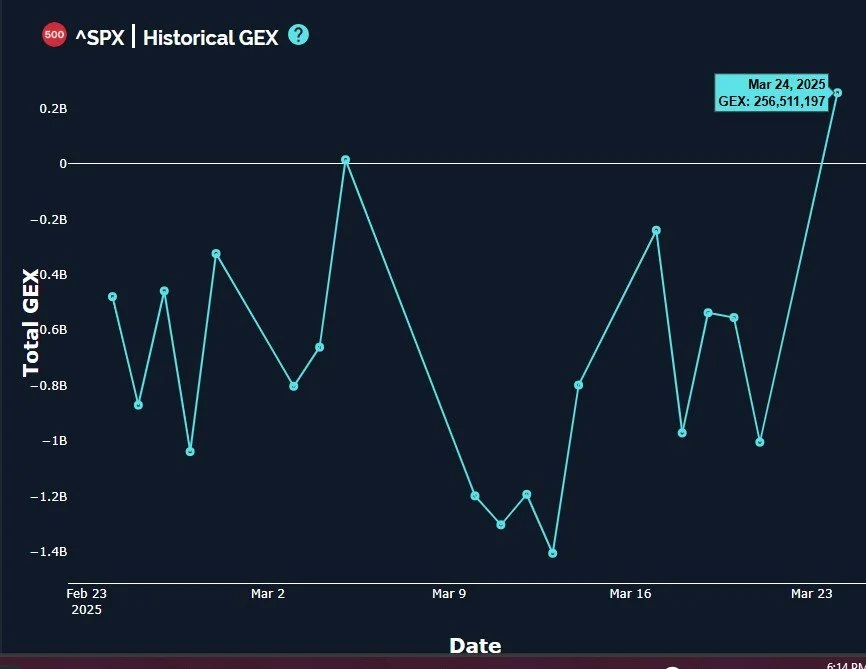
To visualize this increase in GEX, look at the graph below, what a move. Over 1.2B in a straight line!
We see essentially the same attributes when we look at QQQ, so I won’t cover QQQ in depth in the newsletter, but you can watch our YouTube video for more analysis on QQQ. Both SPX and QQQ show price entering the upper Dealer Cluster zone, which means we’re already at a spot where bears might find relief. That said, we also need to watch price action, and whether or not GEX itself continues to shift toward higher strikes. But generally, even if that does happen, we expect initial resistance and/or consolidation in the current general area. As far as SPX goes, the upper Dealer Cluster stretches to 5850, so we can still see more upside within the parameters we see at today’s close.
I wanted to include AAPL as just one of several examples within the Magnificent Seven complex showing the reactive bounce out of the lower Dealer Cluster and the presence of higher targets. While SPX and QQQ’s upper Dealer Cluster is basically right where we closed and extends up somewhat, AAPL and others are still not quite to their own upper zones. Understanding the contribution of large tech to the broader indices, this potentially implies more upside for indices toward the 225+ area for AAPL. The alternative-which is also worthy of consideration- is that tech is even weaker than broader indices because we’re in real trouble and a larger decline is imminent. I certainly don’t like that the Hull is only barely curling higher, creating greater distance between today’s closing price and the Hull, allowing more room for decline. But declining to the Hull would still maintain the possibility of a rebound, as long as that level is held (only according to my own methods and rules), so even that scenario keeps alive a rebound following a temporary decline.

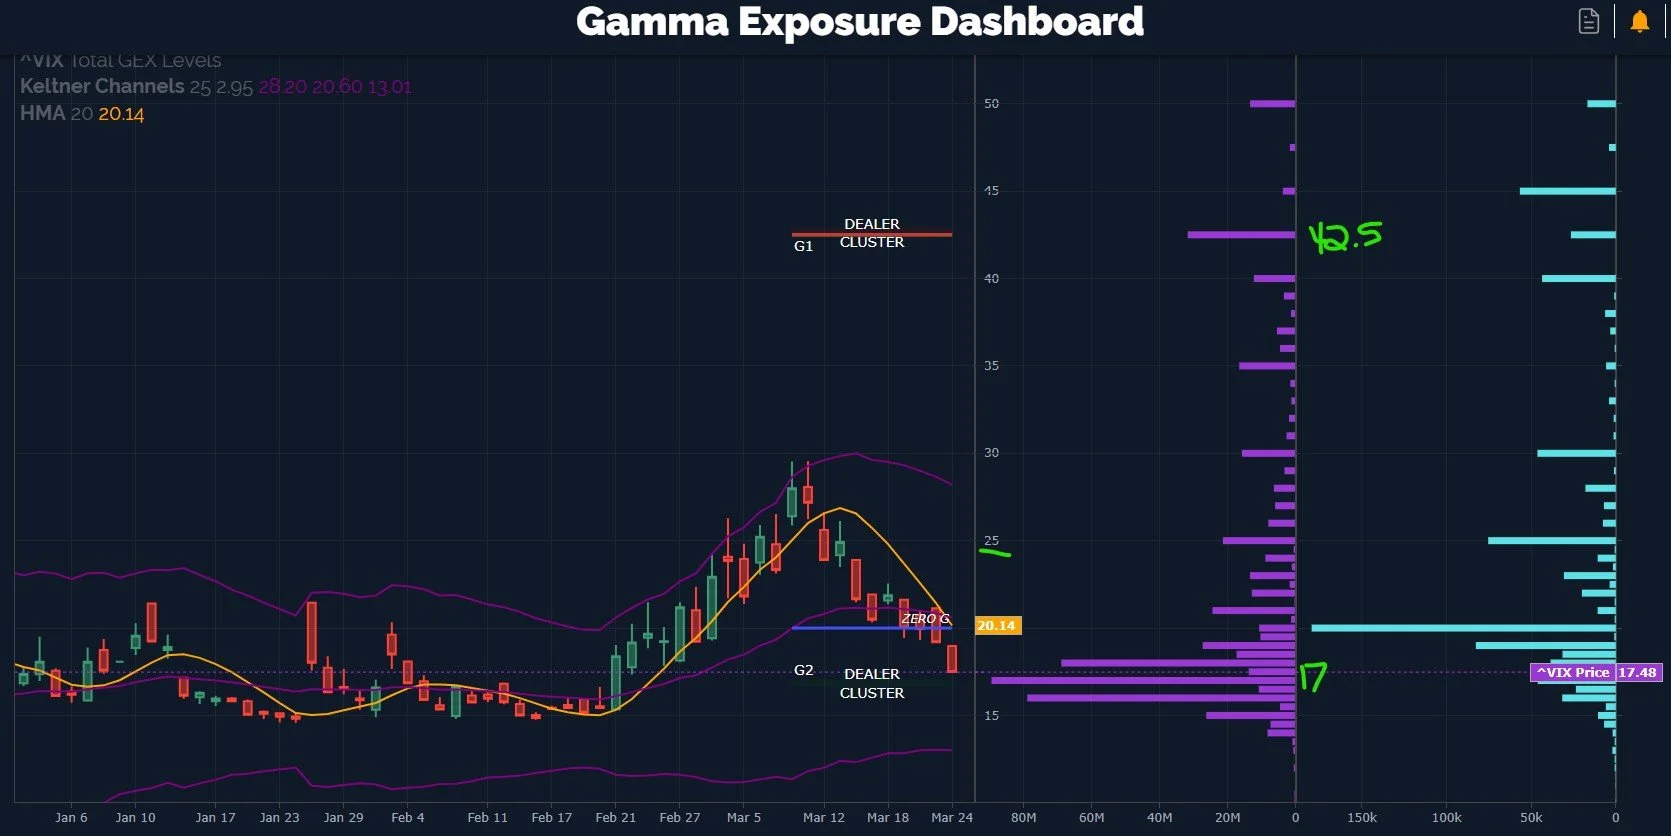
One other sign of caution- the VIX is rapidly deflating, giving us a great signal in advance when we started noticing its decline March 11 and 12 (while QQQ was making an important short-term low), and it’s quickly reaching the bottom of the 4-hour Keltner channel and the big lower Dealer Cluster zone at 17. If bulls really go wild, we would still expect the VIX to hold the 15-area given its strong support in recent months. Obviously a huge shift can occur and the VIX can drop to 12, but we’re dealing with probabilities and not grand predictions of major cycle shifts. So for now, the VIX rapidly approaching 17 while we see daily volume at higher strikes is a cautionary observation, whether a temporary rally in volatility or a resumption in the correction that began recently.
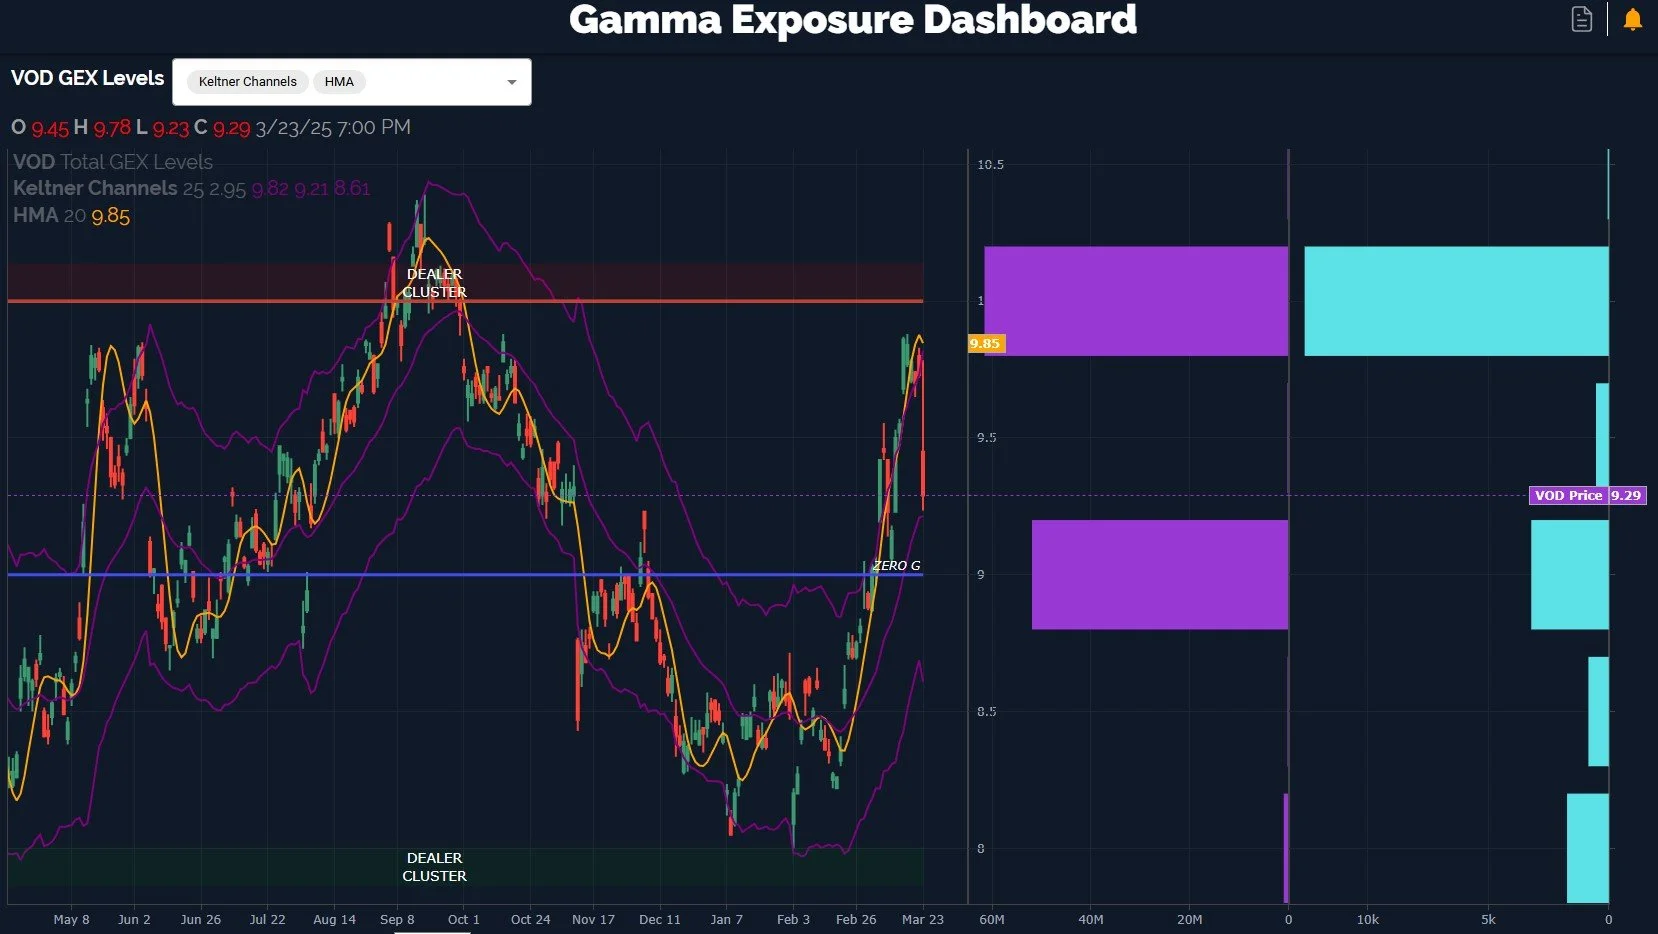
We are always looking at the ongoing battle of broader market bulls and bears, but we can often find opportunity regardless of the underlying market trend, and VOD may be a ticker that warrants further research. GEX recently spiked dramatically, as you can see on our Historical GEX graph.
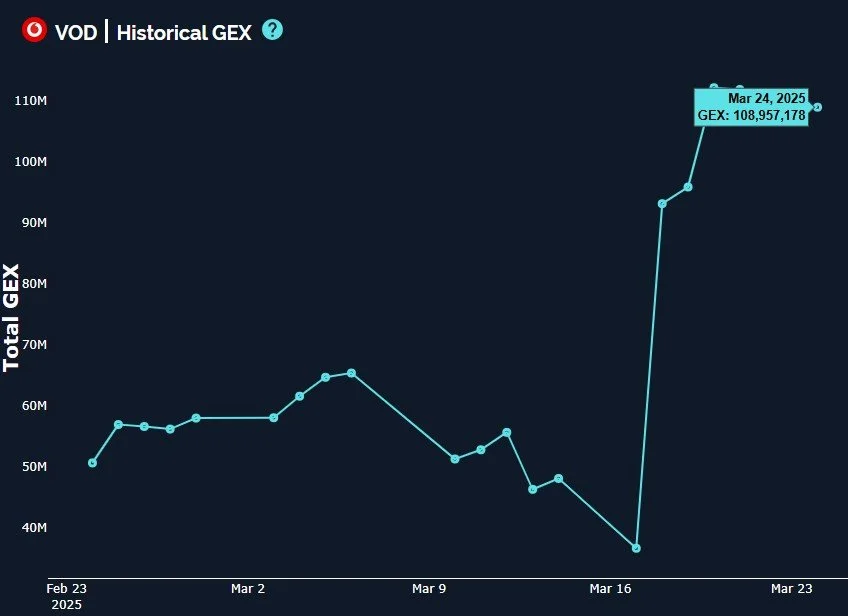
Not everything was positive today, and VOD certainly took a hit to the chin, dropping significantly from highs. We just looked at the rapid increase in positive GEX, but I also like that the dividend is greater than 7% (beneficial to long term investors) and we see the Keltner channels in an ascending pattern. Based on the increase in GEX and the presence of higher targets, 10 still seems like a valid target if we find support at this 9-9.25 area.
As we navigate what may be a volatile week ahead, we hope you’ll jump into our Discord channel where we’ll share some observations as we wrap up the first quarter of 2025.
Here’s the Discord link if you haven’t joined us yet! Access is free for some channels, and new members have a 7-day trial within Discord to see how we operate. We have an active community of thoughtful traders who chime in throughout the day, sharing ideas and opportunities as we see them.
If you’re interested in accessing our tools and analytics, be sure to check out our website! We rolled out backtested algos and chart indicators and we have more improvements on the way!
If you’re interested in learning more about our strategy and approach, we address all of these topics in our Geek University course which is included in all memberships.
We recently posted a YouTube video after the market close today, and we have many other short videos, so give our channel a look if you’re curious about recent market commentary and ideas as well as gamma (GEX) concepts explained.
Thanks for being part of our community and know that we invite your feedback!
The information provided by Geeks of Finance LLC is for educational purposes only and is not intended to be, nor should be construed as, an offer, recommendation or solicitation to buy or sell any security or instrument or to participate in any transaction or activity. Please view our Investment Adviser Disclaimer and Risk Disclosure.