
The End of Q1 Already?
THE SPRING PROMO IS HERE- We’re offering $300 off of the annual Portfolio Manager earlier than usual in March as we wrap up the 1st quarter of 2025 and celebrate the release of major updates last week! We now have overlayed chart indicators and several backtested algos complete with notifications and we anticipate more near-term improvements. Your needs are our focus, and we want the platform to become indispensable for your trading! Enter code SPRING2025 at checkout to take advantage of this limited time offering.
OpEx is behind us, and the market staged a pretty impressive rebound after a relatively large gap down Friday. The closing price made a lot of sense when measured against the GEX located at 5650 and 5700, and the accompanying volume (the light blue horizontal bars on the chart below) was also elevated. All of the calls at 5700 expired worthless as well as the puts at 5650 and below. We discuss SPX and QQQ in today’s YouTube video, as well as other tickers not covered in the newsletter, so give it a view by clicking here.

Let’s take a quick look at SPX, DIA, and QQQ, starting with SPX above: We are still in an overall negative gamma exposure (GEX) environment, and the pattern forming certainly looks like a bear flag consolidation, at least on the surface (and maybe the surface appearance is correct). In the short run, tactical bulls can focus on SPX’s price being above the yellow Hull moving average, which has turned up as well, an encouraging sign that potential upside remains. We also have a tighter potential stop on any downside moves in the high 5570s. The lower Keltner channel appears to be flattening out as well, though it’s still early. Volume was very elevated at 6000 as well, which coincides with the largest positive GEX strike.
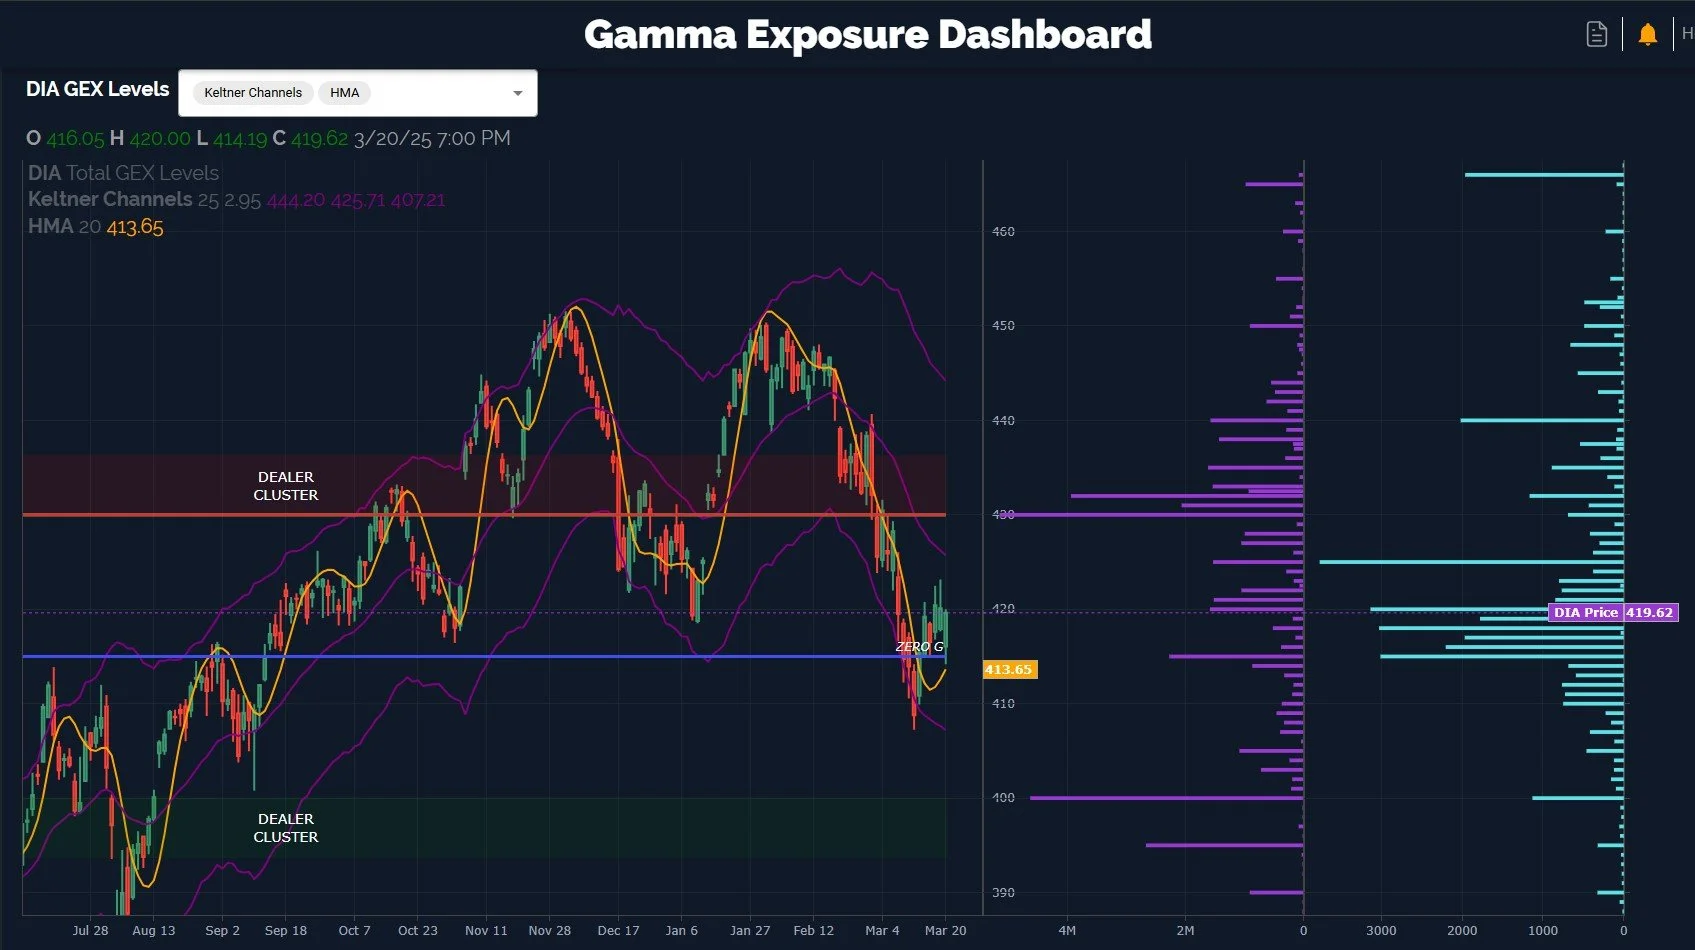
Turning to DIA, we see a similar picture in terms of holding above the Hull, breaking the steep downtrend line, and volume is elevated at higher strikes. The largest GEX is currently at 430, though we see elevated volume at 440 and even 466. For now (and pretty much always), we’ll continue respecting where GEX says to expect possible consolidation or rejection, that happens to be at 430, about 2.5% higher.
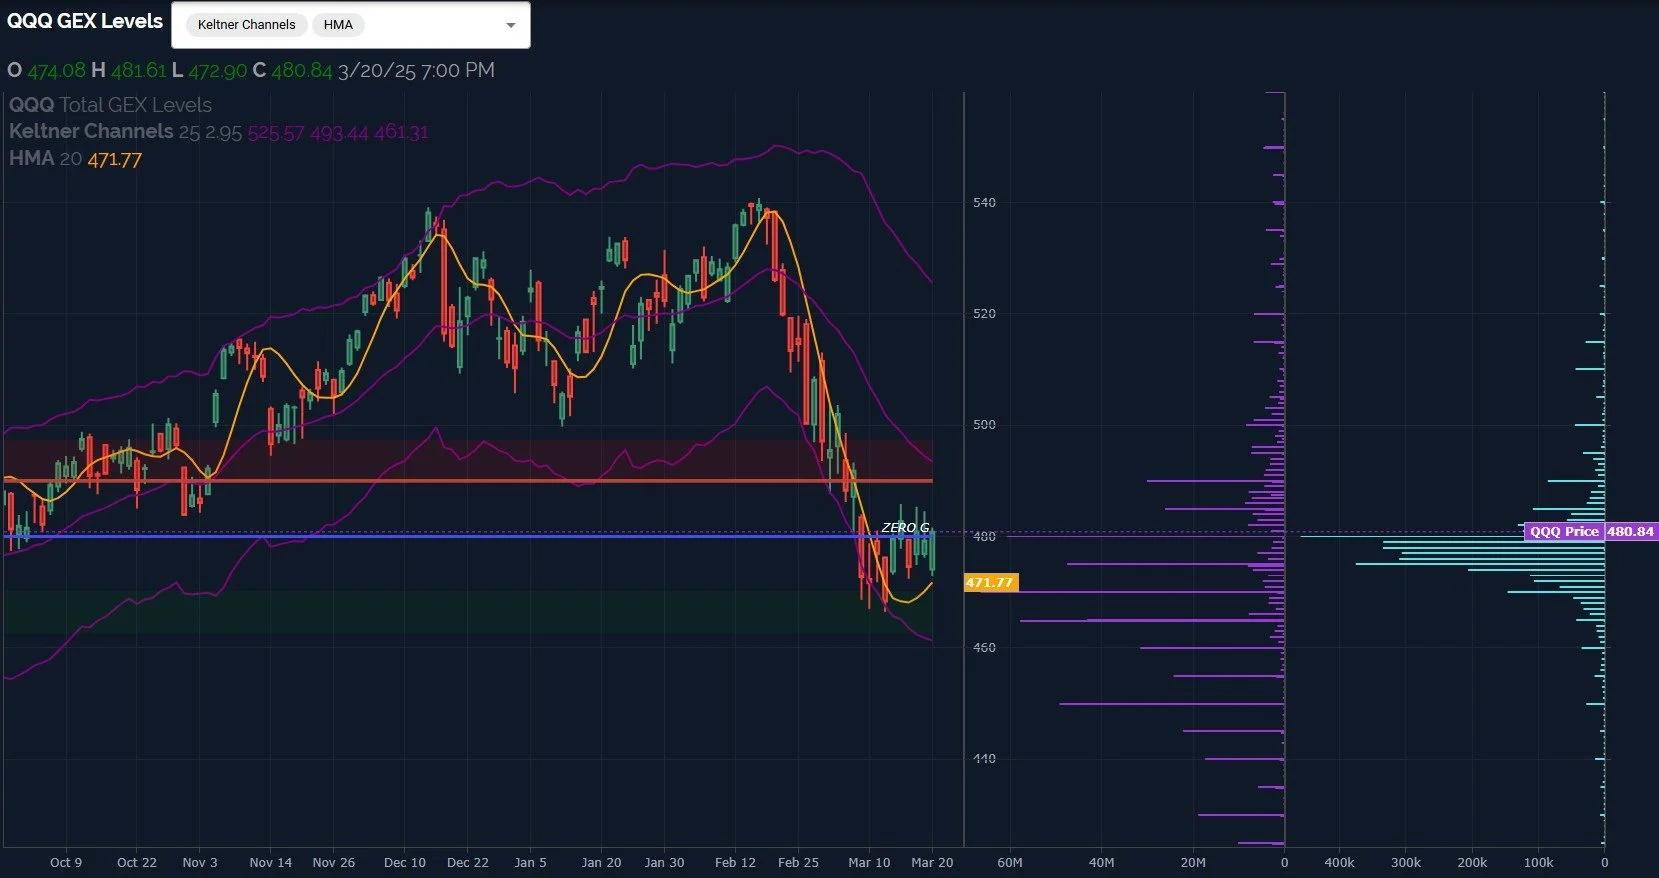
QQQ also looks very similar, and to make another point about recurring similarities, I notice a lot of green candles recently that really didn’t end up making a lot of net positive progress. This can be interpreted either as buyers eagerly buying these levels with expectation of a larger rally, or possibly buyers using a lot of “dry powder” to get the market green without much accompanying results to show. I am not sure whether a “U” recovery has merit here or if this will prove to be a bear flag, at least not strictly using the chart, so I remain open to possibilities. 490 is currently the upper Dealer Cluster zone for QQQ.
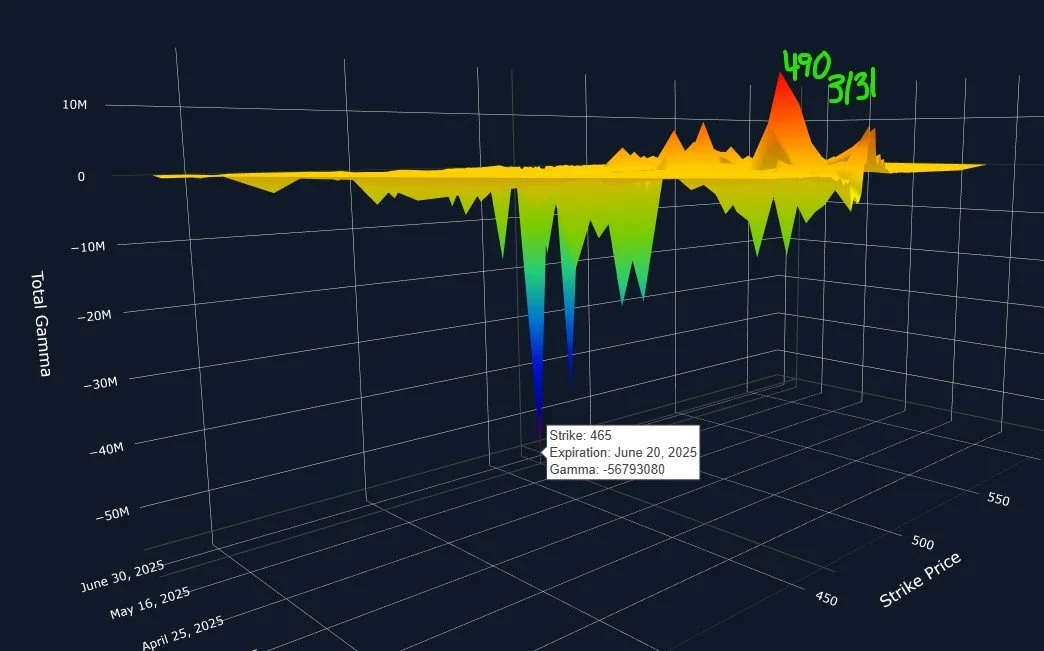
Taking a quick look at QQQ’s 3D graph, I see some interesting observations that may play into how we finish the quarter and what comes next. That said, keep in mind that we are just now looking at post-OpEx data that doesn’t include the next trading session, so I think the best way to consider potential conclusions is to require validation of the general picture remaining by the end of the day Monday, at least that’s my personal opinion. QQQ’s 3D GEX graph shows most of the remaining negative GEX clustered anywhere from April 17 to June 20, with the largest positive cluster at the end of the month, 3/31. This suggests higher odds of a positive move to 490 by Friday, then more downside.
The VIX is currently signaling to stay long stocks given the Hull being above the current level, though a close above 21.42 may signal that the market rally is just about done, or at least a short-term VIX spike. Friday did see elevated volume at the 40 strike. For now, short-term momentum is higher for indices and lower for the VIX. Check in with us in Discord and we’ll update what we’re seeing as the trading day progresses starting Monday.

Here’s the Discord link if you haven’t joined us yet! Access is free for some channels, and new members have a 7-day trial within Discord to see how we operate. We have an active community of thoughtful traders who chime in throughout the day, sharing ideas and opportunities as we see them.
If you’re interested in accessing our tools and analytics, be sure to check out our website! We rolled out backtested algos and chart indicators and we have more improvements on the way!
If you’re interested in learning more about our strategy and approach, we address all of these topics in our Geek University course which is included in all memberships.
We recently posted a YouTube video after the market close today, and we have many other short videos, so give our channel a look if you’re curious about recent market commentary and ideas as well as gamma (GEX) concepts explained.
Thanks for being part of our community and know that we invite your feedback!
The information provided by Geeks of Finance LLC is for educational purposes only and is not intended to be, nor should be construed as, an offer, recommendation or solicitation to buy or sell any security or instrument or to participate in any transaction or activity. Please view our Investment Adviser Disclaimer and Risk Disclosure.