
New Highs- Out Of The Woods?
THE SPRING PROMO IS HERE- We’re offering $300 off of the annual Portfolio Manager earlier than usual in March as we wrap up the 1st quarter of 2025 and celebrate the release of major updates last week! We now have overlayed chart indicators and several backtested algos complete with notifications and we anticipate more near-term improvements. Your needs are our focus, and we want the platform to become indispensable for your trading! Enter code SPRING2025 at checkout to take advantage of this limited time offering.
The idea of OpEx maximum pain continues to rein, with yesterday’s drop being countered with today’s FOMC rally. We discuss broader markets and the VIX expiration as well as QQQ in today’s YouTube video, so give it a view by clicking here.
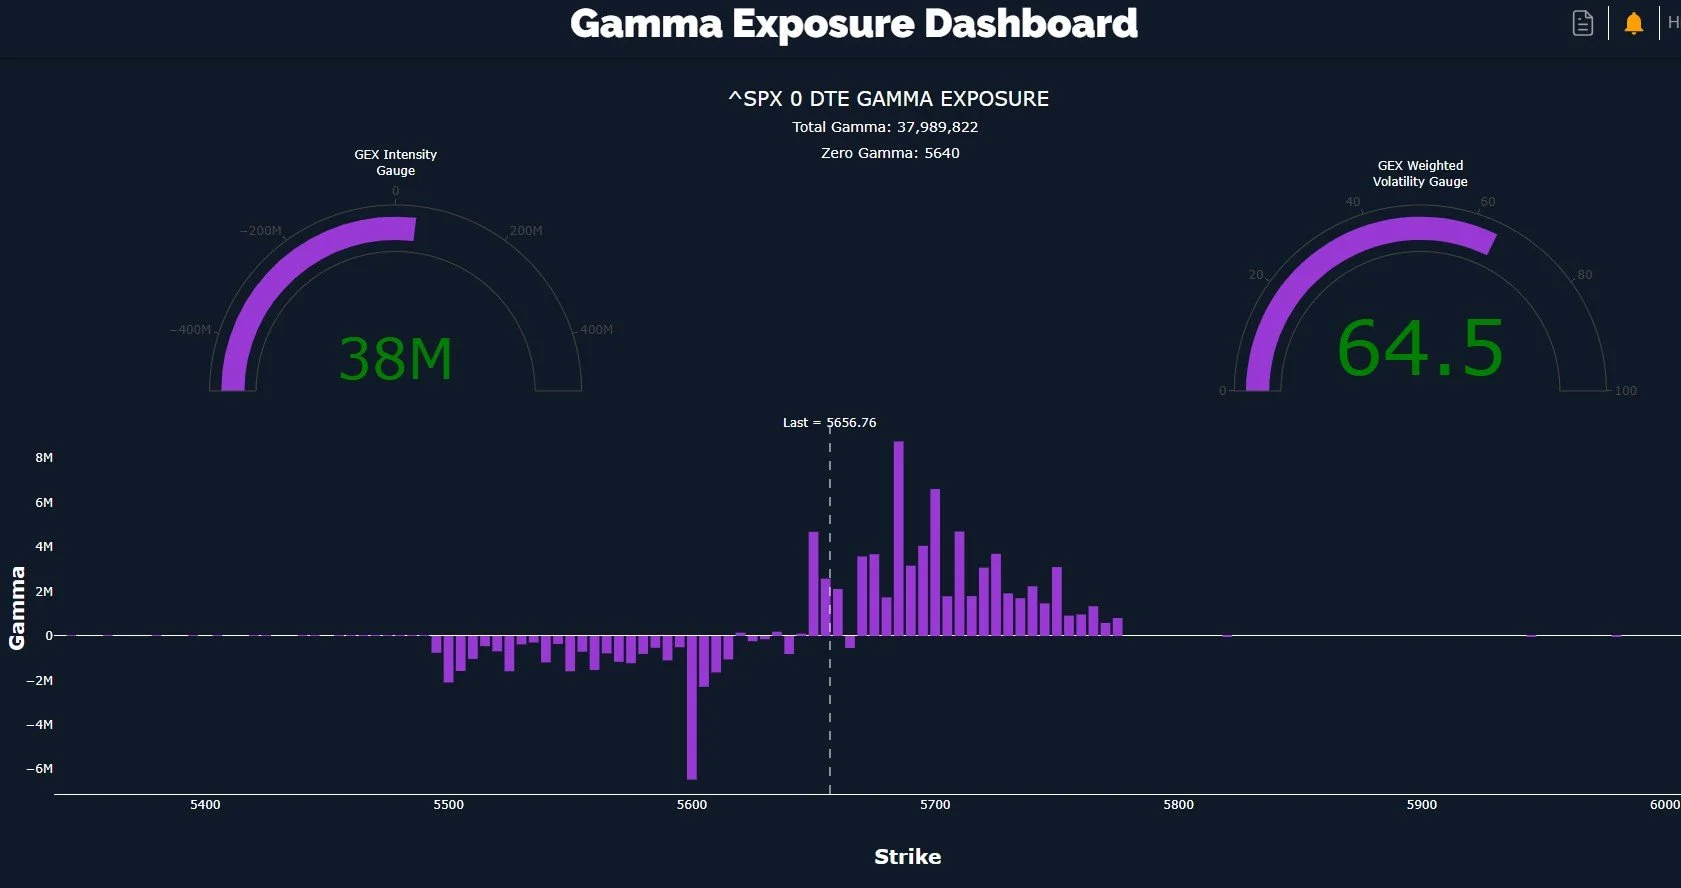
Overall, I’ve been quite pleased with the intraday/0 DTE gamma exposure (GEX) readings, which have given us valid targets every morning so far, even on a traditionally difficult to predict FOMC day. Our initial read within the first hour of trading in the cash session pointed at positive GEX and SPX 5685 as the largest GEX cluster. It took some time, but this level hit, and as you probably know, we surpassed that early target and ended up reaching 5715 before fading back down.
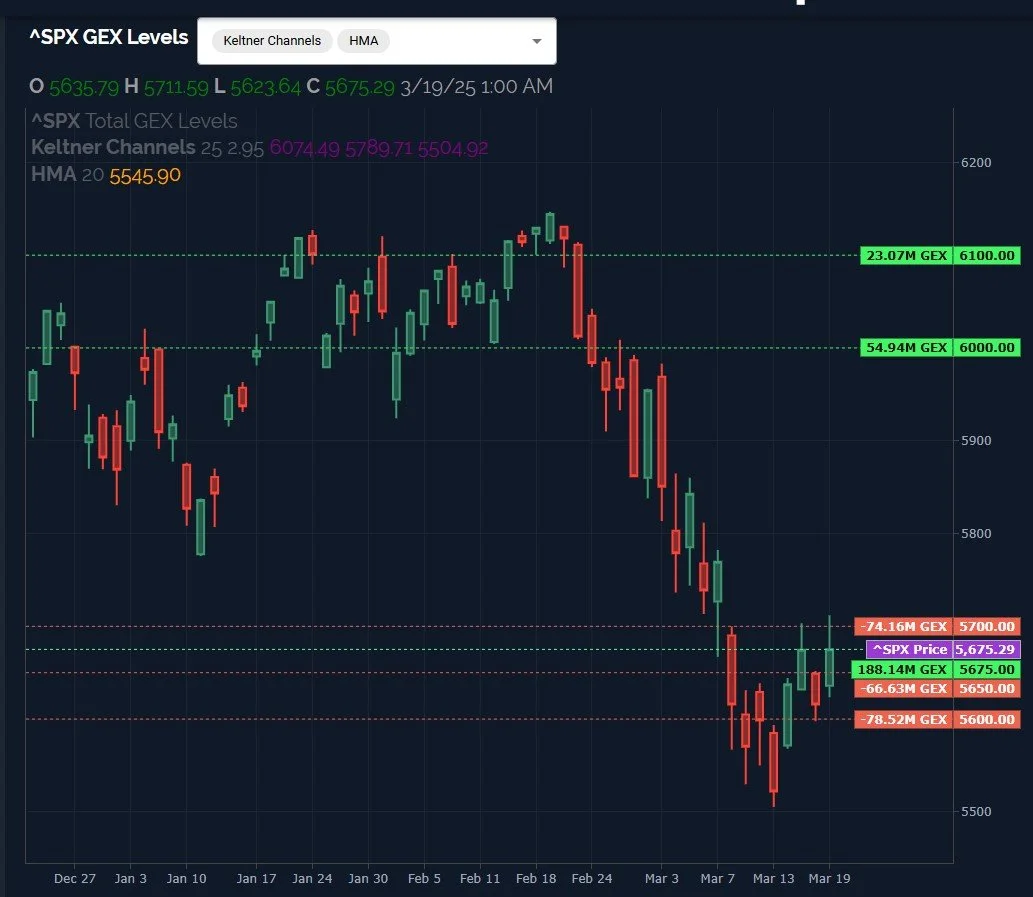
SPX made a higher high relative to 2 days ago and SPX also closed higher, though amazingly it closed higher by a fraction, 5675.29 compared to 5675.12 Monday. I guess that counts! Our GEX Levels chart below shows one of the toggles our subcribers can use that shows the 3 largest positive and negative clusters for any given ticker symbol. In SPX’s case (and most major indices for that matter), we see large negative clusters that are all relatively close to the current price, but interestingly, the positive clusters are quite far away and fairly meaningful in size, especially the big 6000 cluster. Though 6000 seems very far away after suffering an intense drop that had no bounces, I see the logic in 6000 being a potential upside target, since that area represents a retesting of January support.
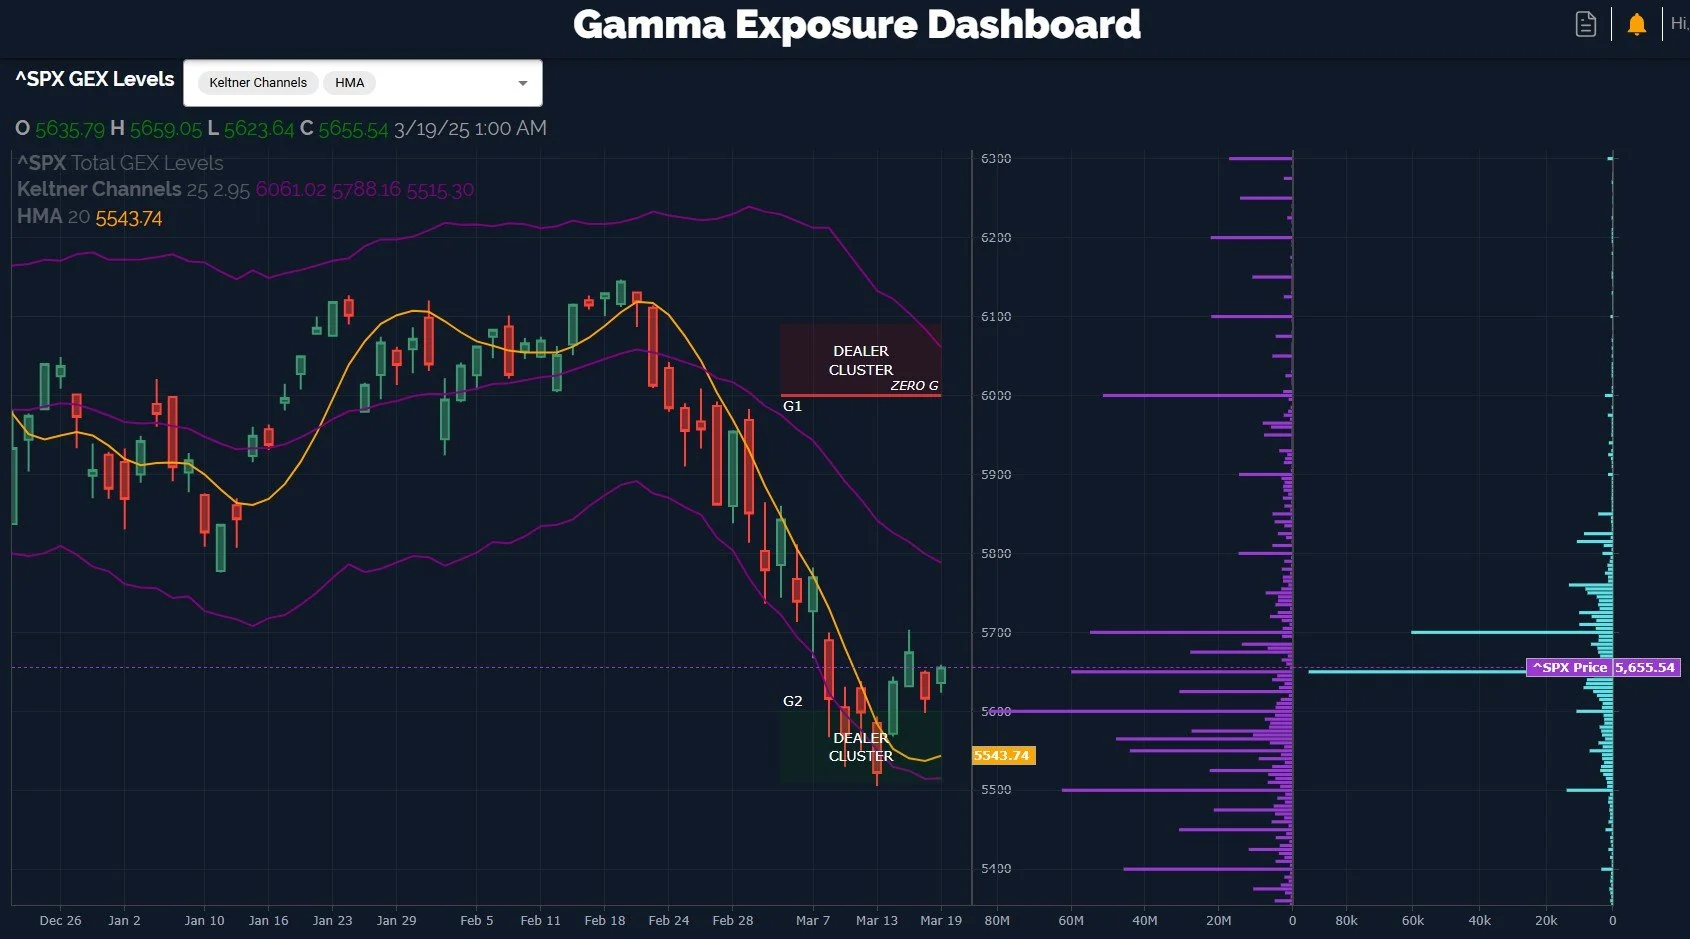
Switching gears and looking at a different chart we make available, we see the purple GEX clusters reflecting 6000 as well as the lower clusters from 5400-5600. Looking at the purple Keltner channels on the chart itself, and the Hull moving average in yellow, we see that my long signal above the Hull is working out alright so far, though we are some distance above the Hull. I still wouldn’t be surprised to see yet another attempt lower before the week is over, though the 5600 retest appears successful as of now. Will we see 5800 first or 5550?
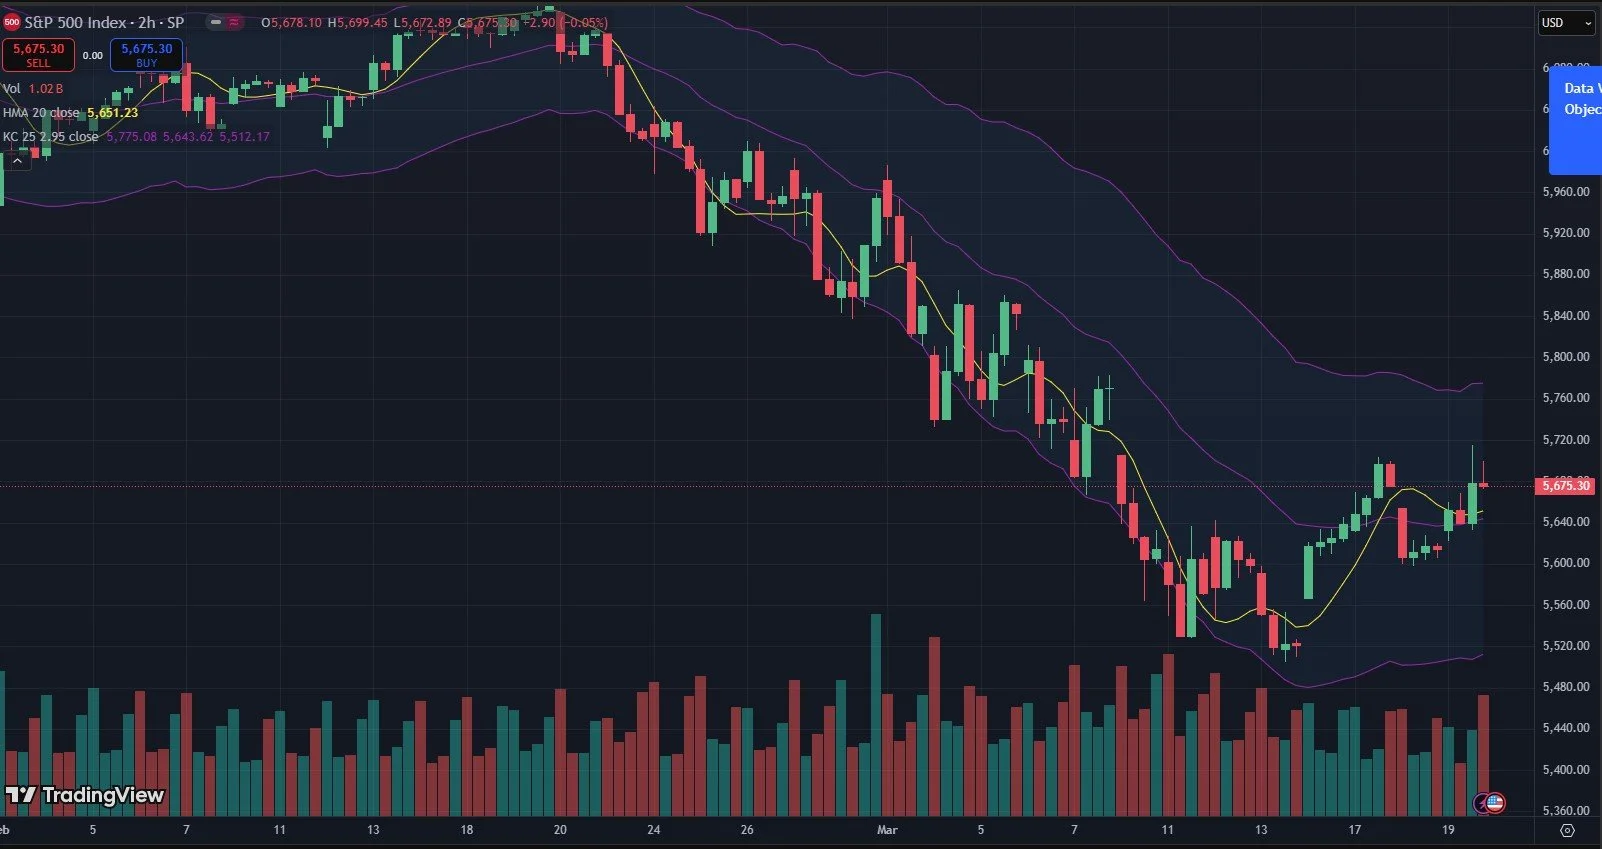
Before we go further, let’s not forget that SPX is still in negative GEX territory, though technically what we consider neutral at less than 1B negative (-537M at today’s close), so we do have a situation of potentially heightened volatility and a chance of failure for any rally attempt. We’ve looked at the larger view, so now let’s look at smaller timeframes. Often we see indicators on smaller timeframes turn up before the trend has shifted in a broader sense. In this case, we’re looking for a potentially larger rally at some point, even if we are now in a larger downtrend, so it’s all about timeframe. The 2-hour chart is the first one we’ll look at, and it’s in a slight uptrend, I would call it neutral at the moment. It’s positive that price is above the middle Keltner as well as the Hull, opening the door toward the upper Keltner at 5775.
The 4-hour chart doesn’t quite look ready for a sustained rally, based on the lower Keltner, but we are still holding above the Hull and the upper channel appears to have turned up ever so slightly. Today’s rejection of the middle Keltner is potentially concerning in the short run, but bulls have the Hull at 5640 (also close to the middle Keltner on the 2-hour chart) to potentially use as a line-in-the-sand.

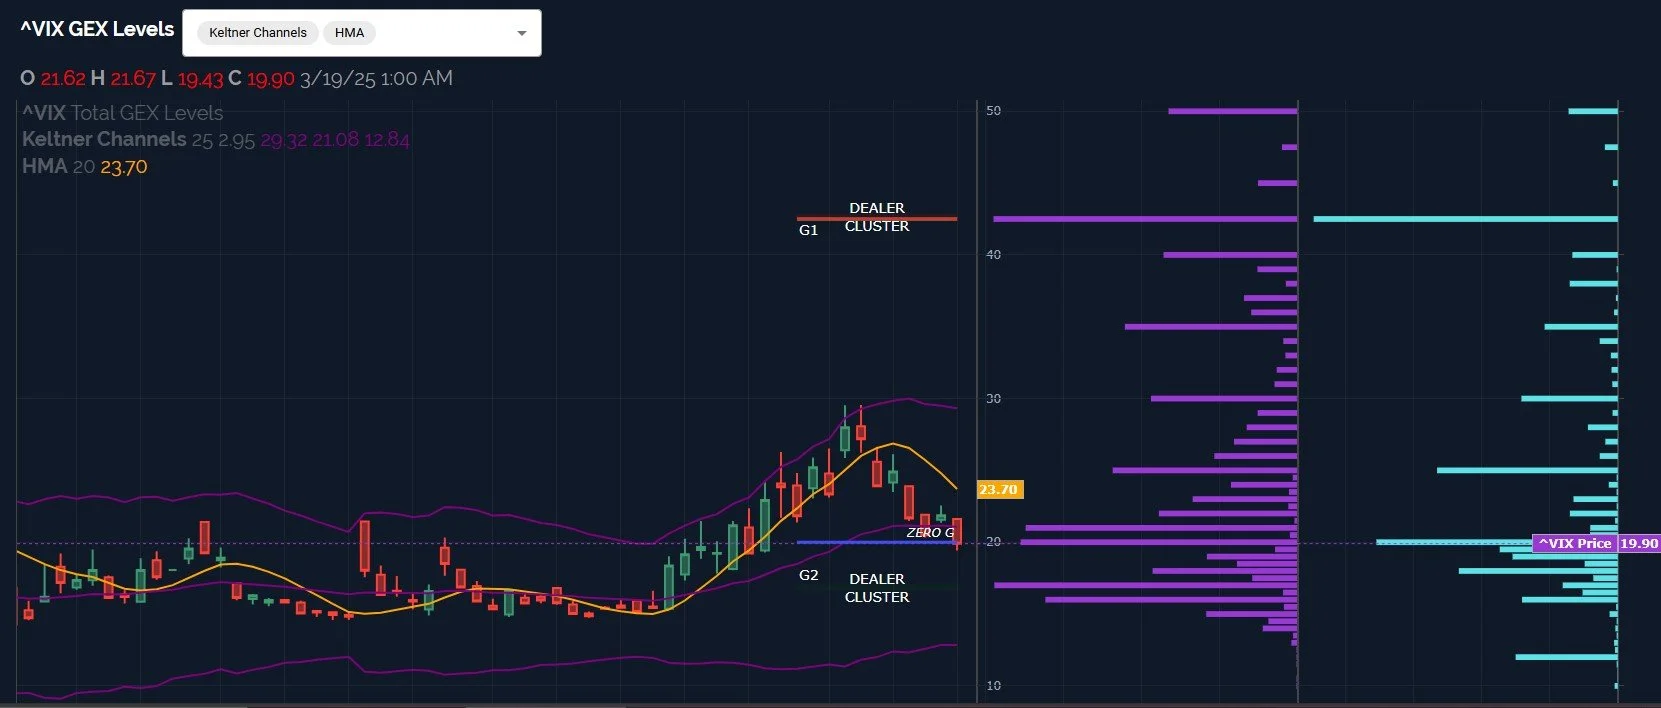
So SPX is showing us that the 2-hour chart has at least leveled out, but the 4-hour chart still leaves us with uncertainty. The VIX also gives pause from a contrarian perpective- we closed below VIX 20 for the first time since February 28. We can certainly continue lower, and we have been noting the volume and shifting in GEX toward 15-16, but it wouldn’t surprise me to see a bounce higher for volatility from here. We also see a relatively new and large GEX cluster at 42.5 with accompanying volume today. Join us in Discord tomorrow and we’ll see if GEX is signaling another “Opposite Day” or not. Thanks for reading!
Here’s the Discord link if you haven’t joined us yet! Access is free for some channels, and new members have a 7-day trial within Discord to see how we operate. We have an active community of thoughtful traders who chime in throughout the day, sharing ideas and opportunities as we see them.
If you’re interested in accessing our tools and analytics, be sure to check out our website! We rolled out backtested algos and chart indicators and we have more improvements on the way!
If you’re interested in learning more about our strategy and approach, we address all of these topics in our Geek University course which is included in all memberships.
We recently posted a YouTube video tonight, and we have many other short videos, so give our channel a look if you’re curious about recent market commentary and ideas as well as gamma (GEX) concepts explained.
Thanks for being part of our community and know that we invite your feedback!
The information provided by Geeks of Finance LLC is for educational purposes only and is not intended to be, nor should be construed as, an offer, recommendation or solicitation to buy or sell any security or instrument or to participate in any transaction or activity. Please view our Investment Adviser Disclaimer and Risk Disclosure.