
VIX & VVIX: Forward Indicator Or Fakeout?
THE SPRING PROMO IS HERE- We’re offering $300 off of the annual Portfolio Manager earlier than usual in March as we wrap up the 1st quarter of 2025 and celebrate the release of major updates last week! We now have overlayed chart indicators and several backtested algos complete with notifications and we anticipate more near-term improvements. Your needs are our focus, and we want the platform to become indispensable for your trading! Enter code SPRING2025 at checkout to take advantage of this limited time offering.
The CPI report showed a lower increase than expected (yes, ridiculously, prices are still increasing), though markets overall made a fairly weak effort at a bounce. What was more impressive was how deflated VVIX and the VIX became as the day went on. Is this a precursor to the market rallying more, or is volatility simply resting and recharging for its next big day at the VIXlympics? Let’s look at a few different angles in the newsletter tonight. Our YouTube video (which can be viewed by clicking here) also discusses the odds of SPY sustaining a rebound as well as BTC and more.
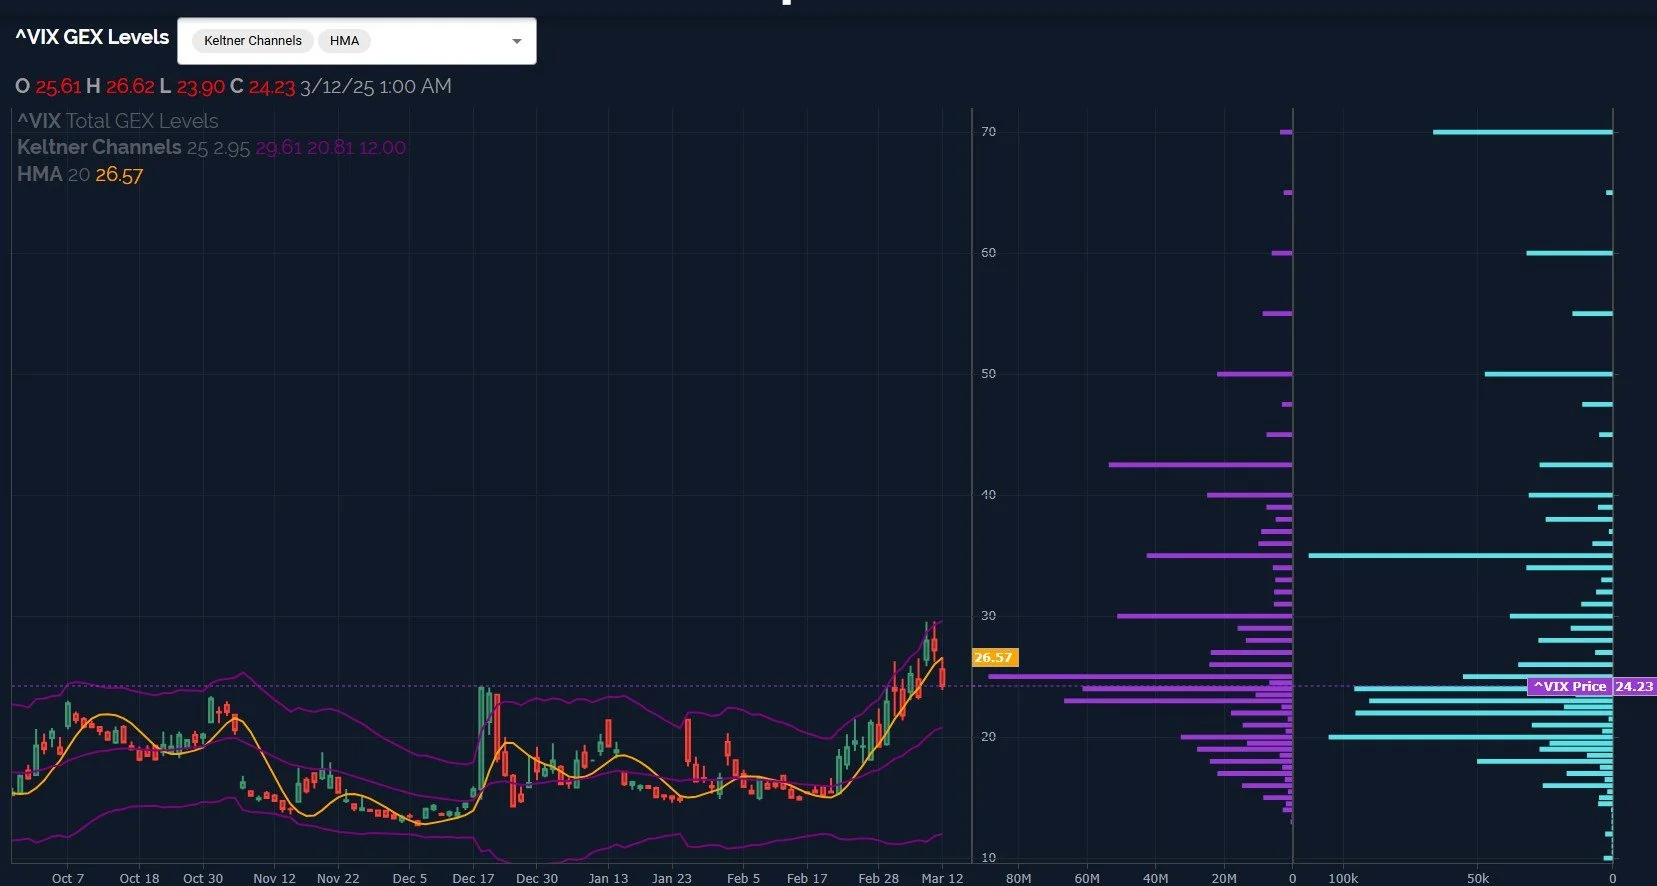
Let’s start with VVIX above, the index that measures the future expected volatility of the VIX itself. VVIX was down almost 14 points, one of the biggest one-day declines this year. To obey my own rules, I see we closed far below the Hull moving average, so my bias is for VVIX to drop further. This doesn’t mean VVIX won’t have up days, and maybe in the next day or two we’ll see VVIX retest the Hull from below this time, which would be quite natural. But as long as we’re below the yellow line, my bias is to expect VVIX to have a downward trajectory.
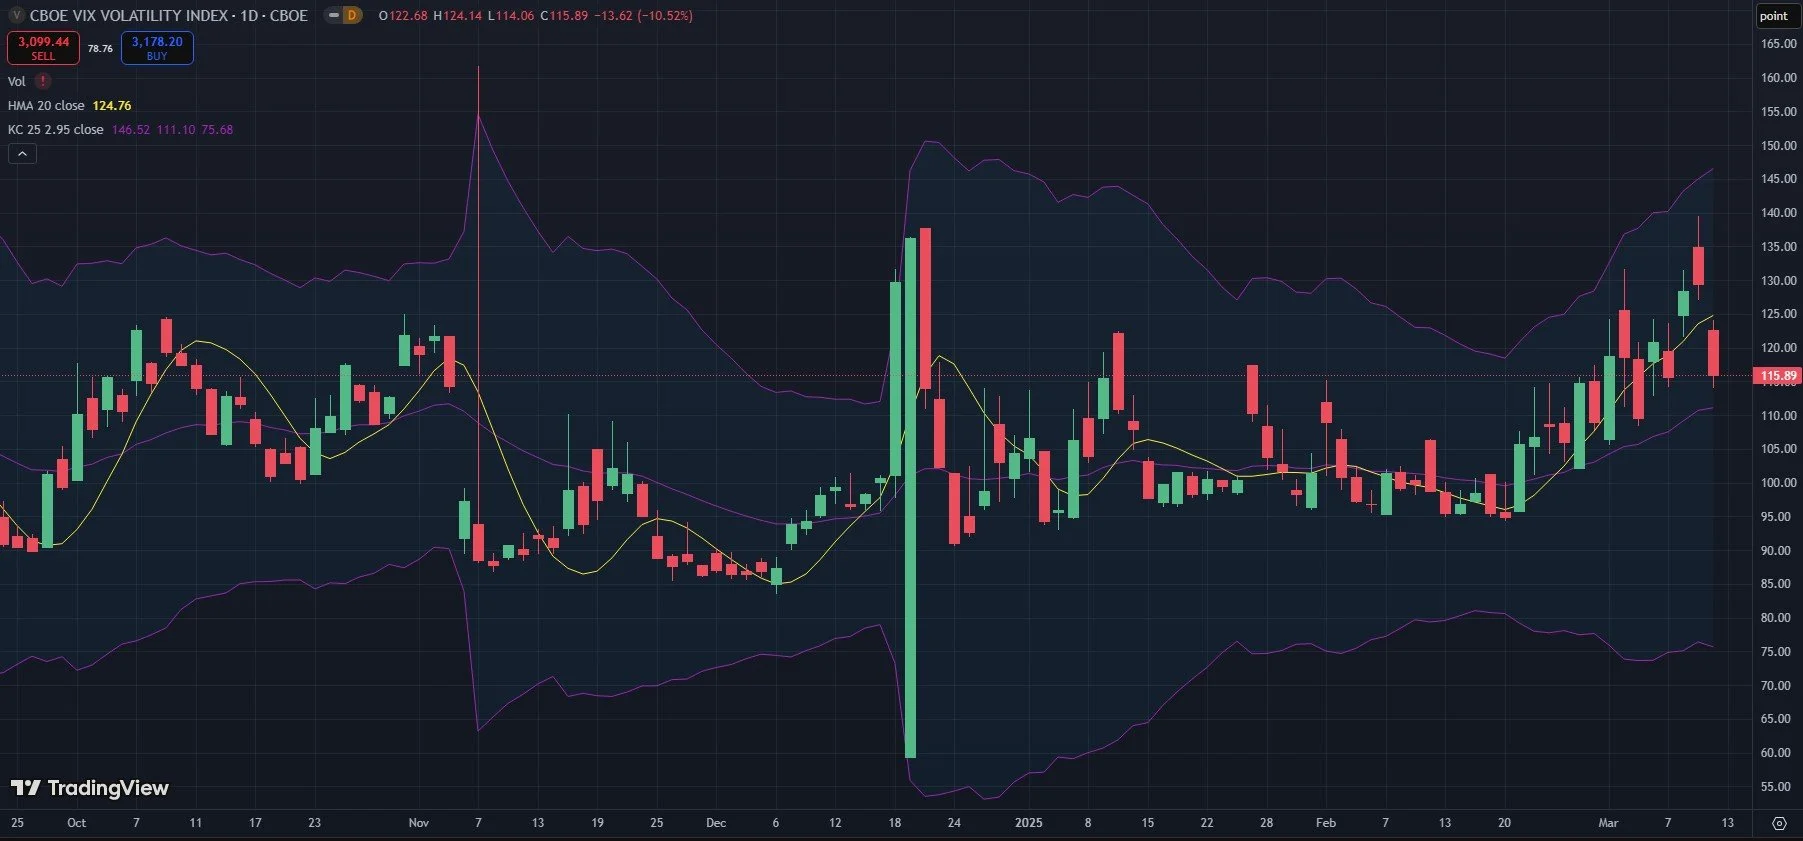
We see a similar pattern with the VIX below, breaking under the Hull and closing near lows of the day. This potentially opens the door to VIX 20, which I would hope might mean the market bounces further to give a chance for early longs to exit with their money back and recent longs to make a nice profit. We saw volume at lower strikes for the VIX over the last couple of days, and we still see volume at lower strikes today, but we also see significant volume at 35 and even way up at 70. Caution is still warranted, though market bulls have an encouraging signal from the VIX.
Do indices agree with the VIX as of today’s close? Let’s take a look, because it’s a mixed bag (no intent to spoil the mystery). SPX retested the Hull, but couldn’t quite get above it at 5633. For what it’s worth, SPX didn’t make a new low today, amazingly the first day it didn’t make a new low in 6 trading sessions. A bit negative much? We see volume at 6000 today, probably just another kid with a dream (and a lot of option buying power), and we did see the lower Dealer Cluster zone improve somewhat, placing price in the zone. Overall GEX (not shown here) is still firmly in negative territory for SPX.

QQQ gets a bit more interesting, closing above the Hull, ever so slightly, which triggers a long signal for my own personal trading style. It’s still negative that we see such negative GEX clusters below the current price, down to 450, actually, so we aren’t projecting a resumption of the bull market as much as the likelihood of a larger upward bounce soon. This bounce may be temporary and simply a bear market rally, but we won’t draw such a conclusion until we reassess after the beginning of a move.
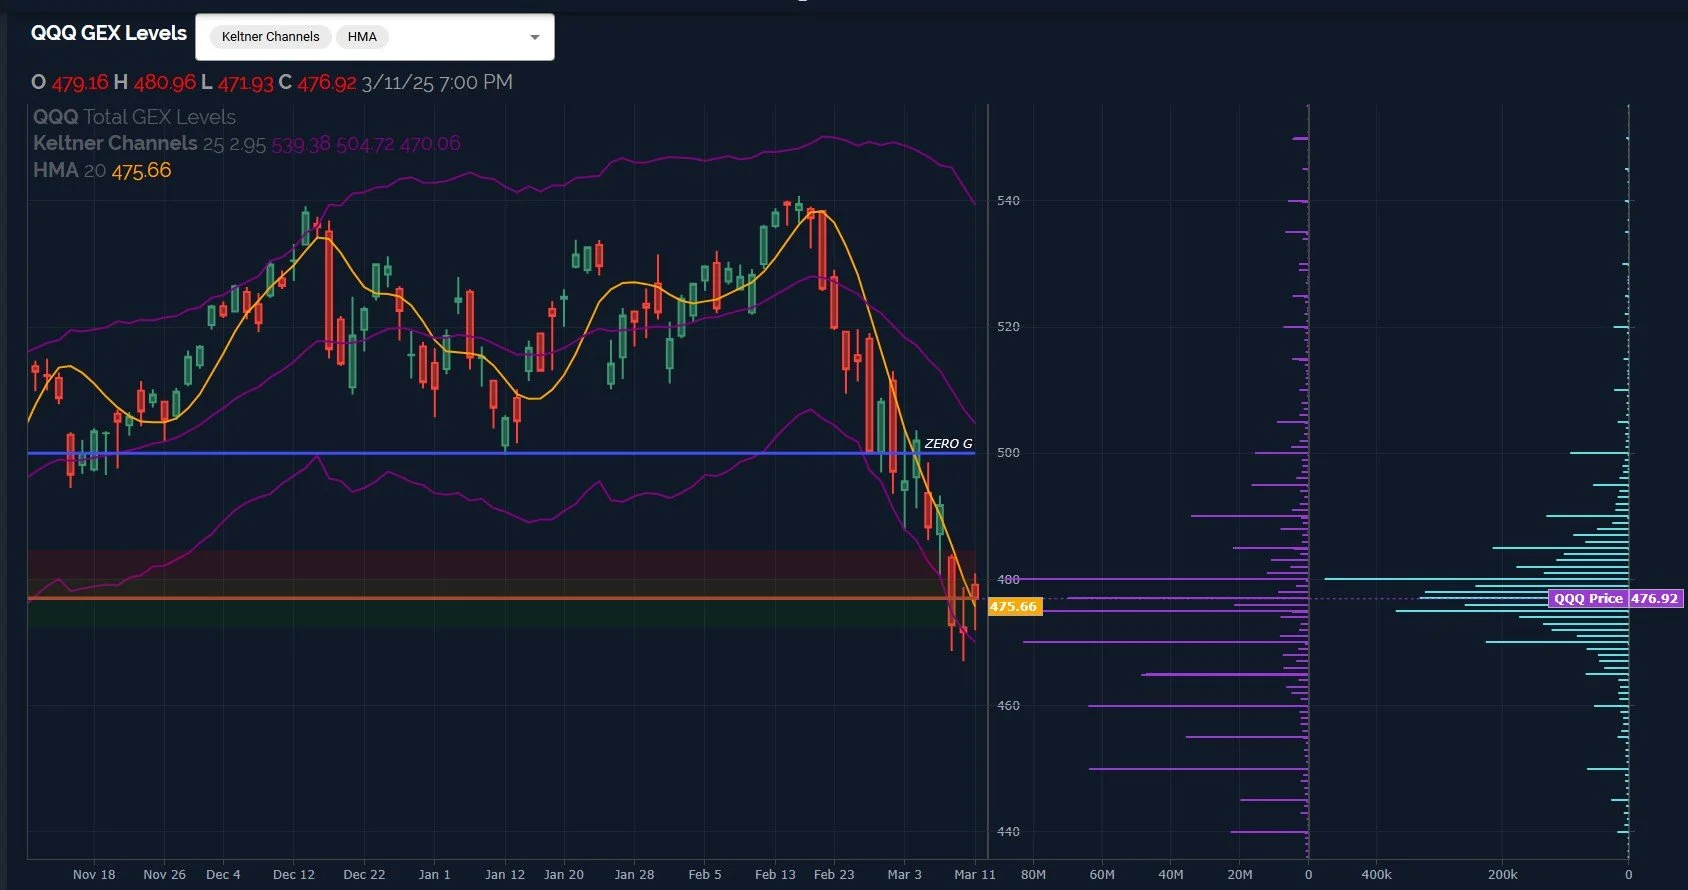
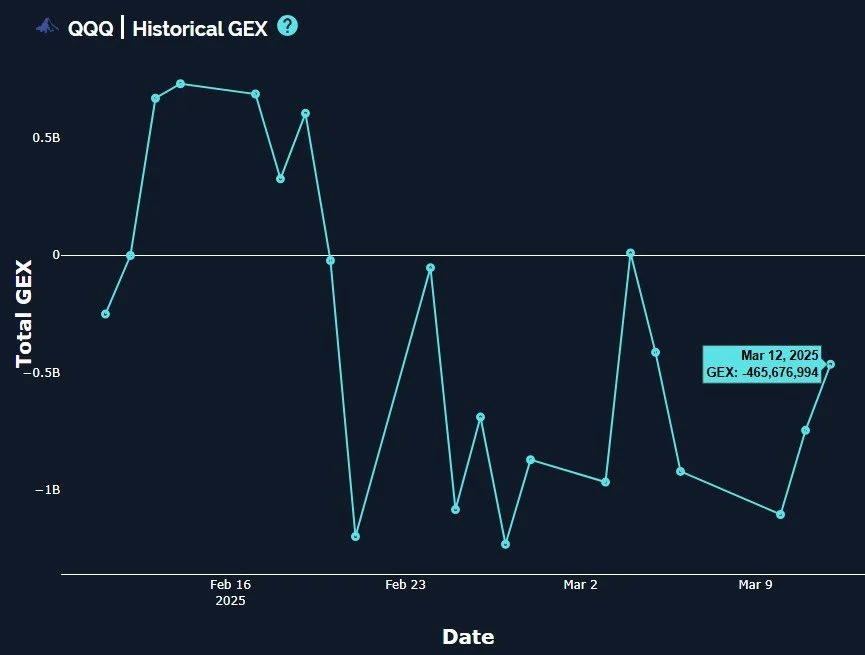
QQQ also saw total GEX improve for the 2nd day in a row, a positive factor, despite GEX still being negative overall.
IWM showed early strength, but that strength didn’t last, eventually seeming even weaker than SPX and QQQ. That said, IWM did close above the Hull, so we have a similar long signal as we saw with QQQ. IWM is still toward a negative GEX extreme, and in fact, negative GEX increased further today, reaching even closer to the negative extreme. This can be seen as a short-term contrarian signal, and coupled with closing above the Hull and sitting in the lower Dealer Cluster, we have improving odds of a larger rebound ahead.

www.x.com
Here’s the Discord link if you haven’t joined us yet! Access is free for some channels, and new members have a 7-day trial within Discord to see how we operate. We have an active community of thoughtful traders who chime in throughout the day, sharing ideas and opportunities as we see them.
If you’re interested in accessing our tools and analytics, be sure to check out our website! We rolled out backtested algos and chart indicators and we have more improvements on the way!
If you’re interested in learning more about our strategy and approach, we address all of these topics in our Geek University course which is included in all memberships.
We recently posted a YouTube video, and we have many other short videos, so give our channel a look if you’re curious about recent market commentary and ideas as well as gamma (GEX) concepts explained.
Thanks for being part of our community and know that we invite your feedback!
The information provided by Geeks of Finance LLC is for educational purposes only and is not intended to be, nor should be construed as, an offer, recommendation or solicitation to buy or sell any security or instrument or to participate in any transaction or activity. Please view our Investment Adviser Disclaimer and Risk Disclosure.