
No Bounces Allowed
THE SPRING PROMO IS HERE- We’re offering $300 off of the annual Portfolio Manager earlier than usual in March as we wrap up the 1st quarter of 2025 and celebrate the release of major updates last week! We now have overlayed chart indicators and several backtested algos complete with notifications and we anticipate more near-term improvements. Your needs are our focus, and we want the platform to become indispensable for your trading! Enter code SPRING2025 at checkout to take advantage of this limited time offering.
The incredibly one-sided market continued pushing lower today after yet another false start across the Hull moving average yesterday, bewildering the bulls and bounce-inclined “better be the bottom!” buyers. Apparently bulls haven’t had enough pain, despite stats such as the following:

www.x.com
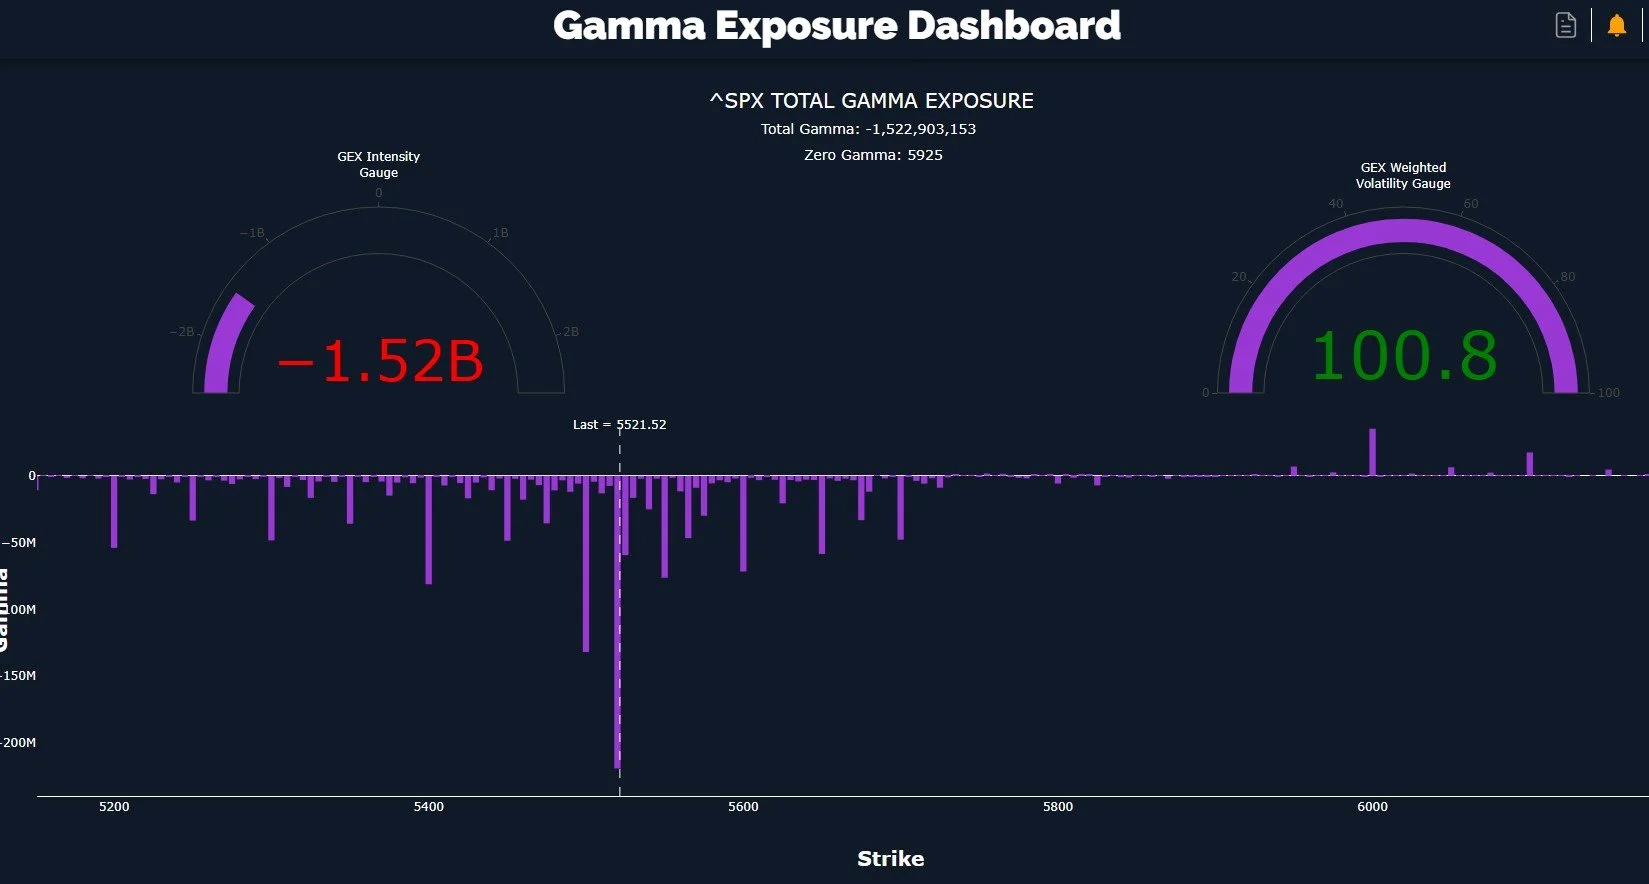
Fortunately for our gaggle of geeks, we were able to adjust to the fairly obviously one-sided gamma exposure (GEX) picture that formed by late morning, allowing some of us to profit from the drop to nearly 5500 for the intraday low. We posted the following in our 0 DTE Discord channel: “With 5540 the current battleground, losing this increases the odds of reaching 5500. 5520 and 5500 are the current favorites given the negative GEX and lack of meaningful remaining positive GEX clusters.”
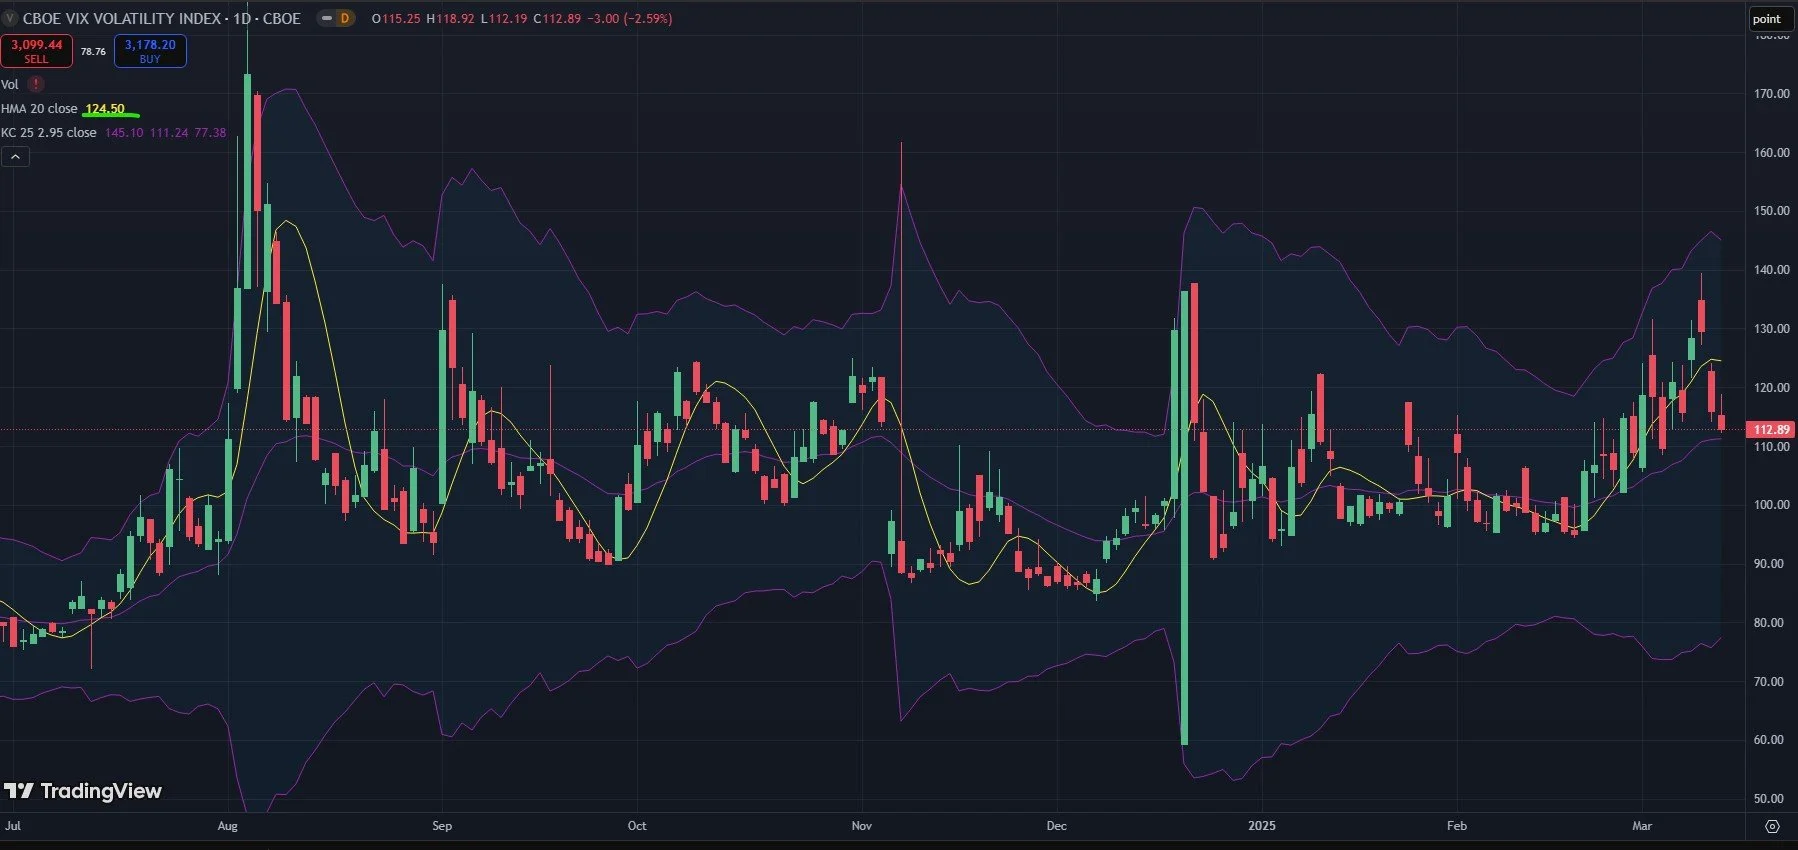
I am starting to see some posters on X.com (who happen to be my favorite contrarian indicators) going full-macro bear, and I’ve been told to never go full macro anything..And another potentially bullish signal, our VVIX, which tracks the expected future volatility of the VIX, declining for the 2nd day in a row, solidly below the Hull. The VIX also closed lower than its pre-market opening level. At this point for VVIX, any rally need to stop at the Hull around 124.50 to continue supporting the idea that volatility declining is a precursor of the market actually rallying. We could easily see a spike in volatility tomorrow, given how negative the first half of this week was, but there’s a lot of put premium to potentially kill and next week is OpEx week, so we need to consider the factors at play while also respecting the underlying trend. It’s not easy, is it?
SPX has been pressed below the Hull with seeming intention, right into the lower Dealer Cluster zone. This zone was shifting lower over the last week or two, but the last few days have seen a more steady reflection of 5500-5600 as an area where dealers may potentially flip to becoming buyers amidst the carnage. Today did see option volume more weighted toward higher strikes for both SPX and QQQ, which is a change in recent character.

SPX inches closer to a negative GEX extreme, with 5500 remaining as a negative cluster worth mentioning, but I notice we don’t really see as many sizable clusters below 5500 as we see above 5500 at this point. A lack of large negative clusters below a certain strike may indicate that the target to watch is the last relatively large strike visible. 5400 is definitely noteworthy, but it’s very close in size to 2 other strikes that are above our current price, so I don’t have high conviction that 5400 is in the cards just yet.
IWM continues to frustrate bulls, though I will say the multiple days of volume at 190 and 195 at least gave us a warning that lower prices may be in the cards despite a number of contradictory factors (mostly contrarian). We see big GEX at 190 and 195 and our highest volume today was at 189. IWM has been very contrarian in the past at various times, so the full picture is still one that warns of a potential rally at virtually any time. We also see IWM in a lower Dealer Cluster zone, and we had more volume spread across a greater number of higher strikes today despite the highest volume affecting a smaller number of strikes at lower prices, at least partly offsetting factors to consider.
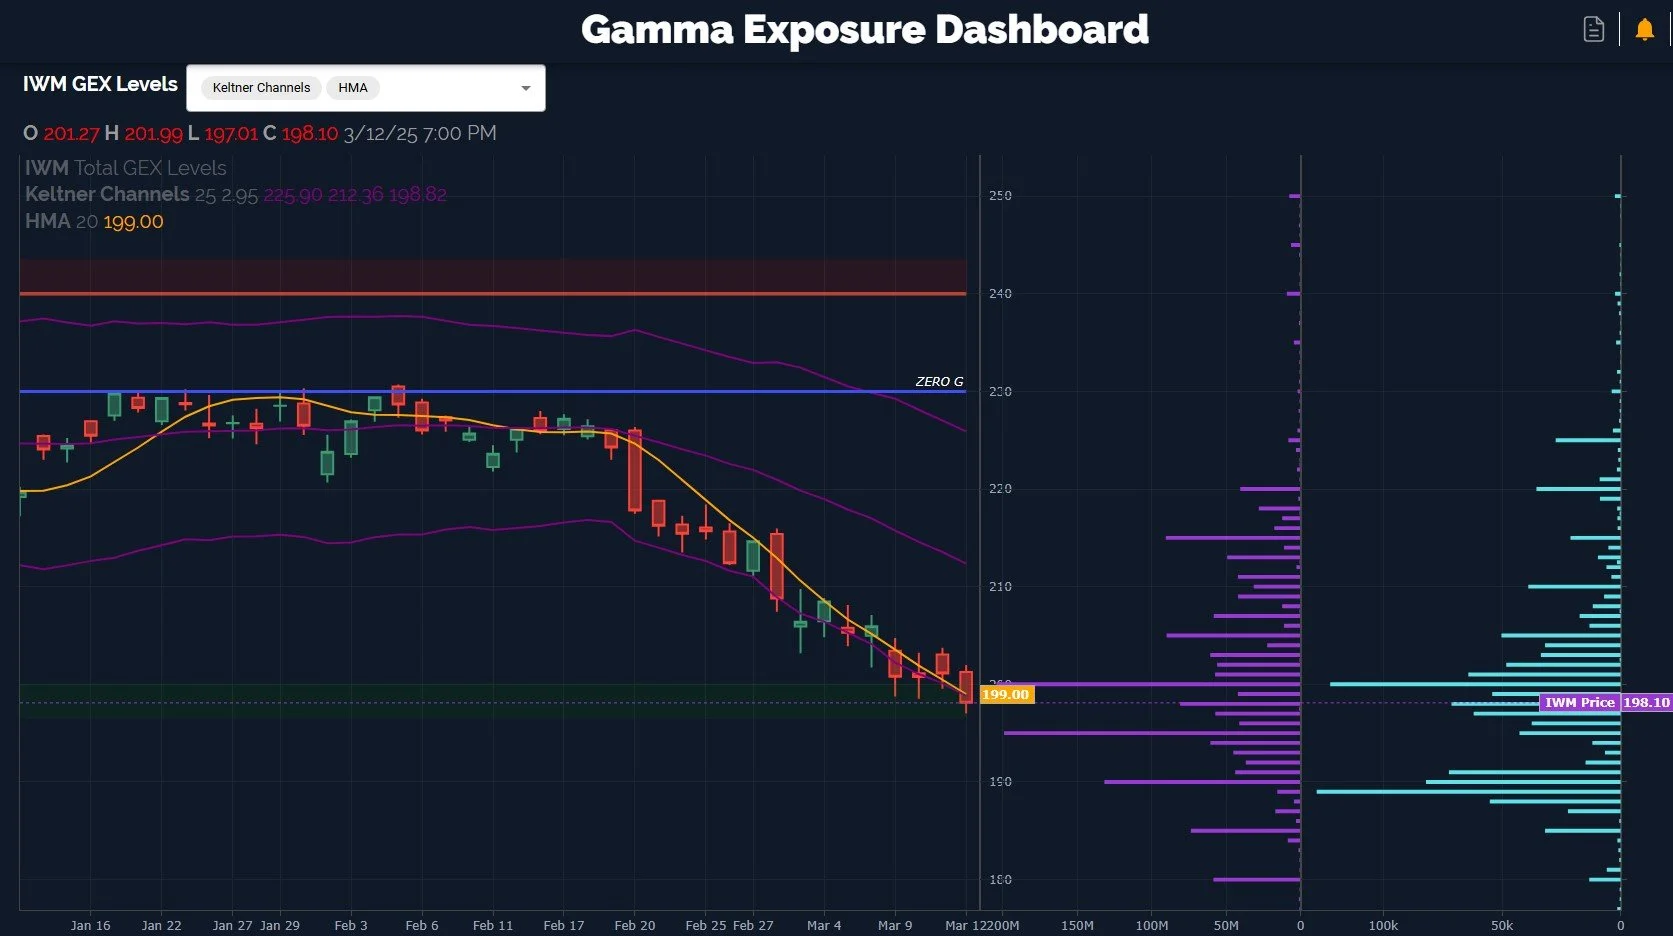
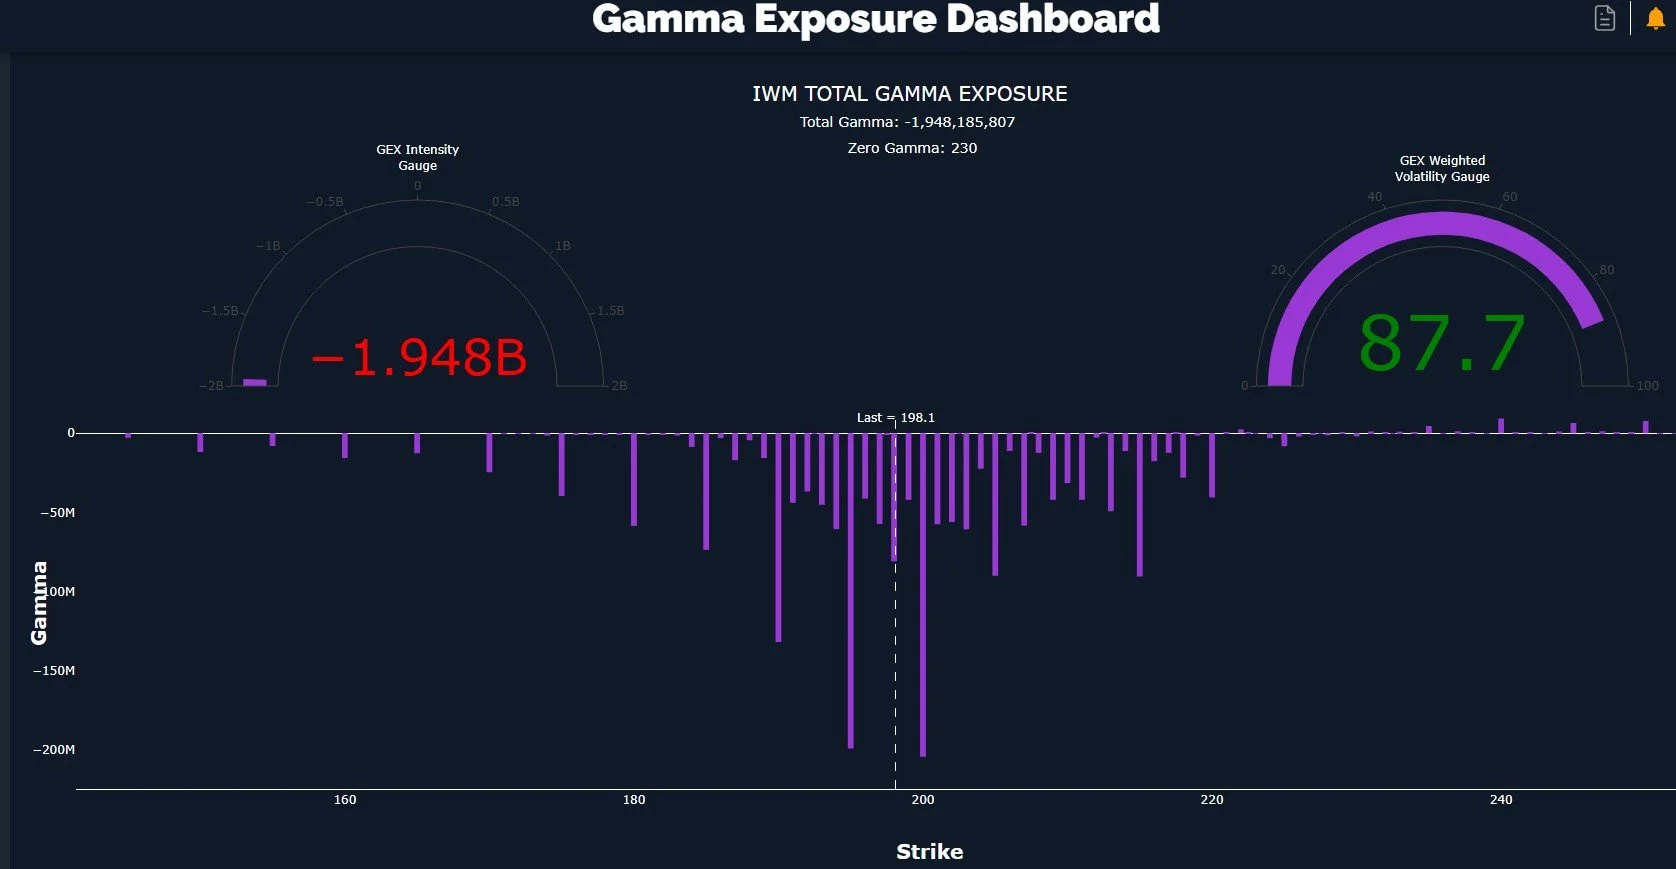
IWM is also barely a hair away from a GEX extreme on the negative side, over 100M more negative than the last time we looked. As mentioned earlier, IWM simply doesn’t show a lot of negative interest below 190, and really 195 looks like it may be the more formidable defense against a drop to even lower strikes. It’s pushing on a string, in my opinion.
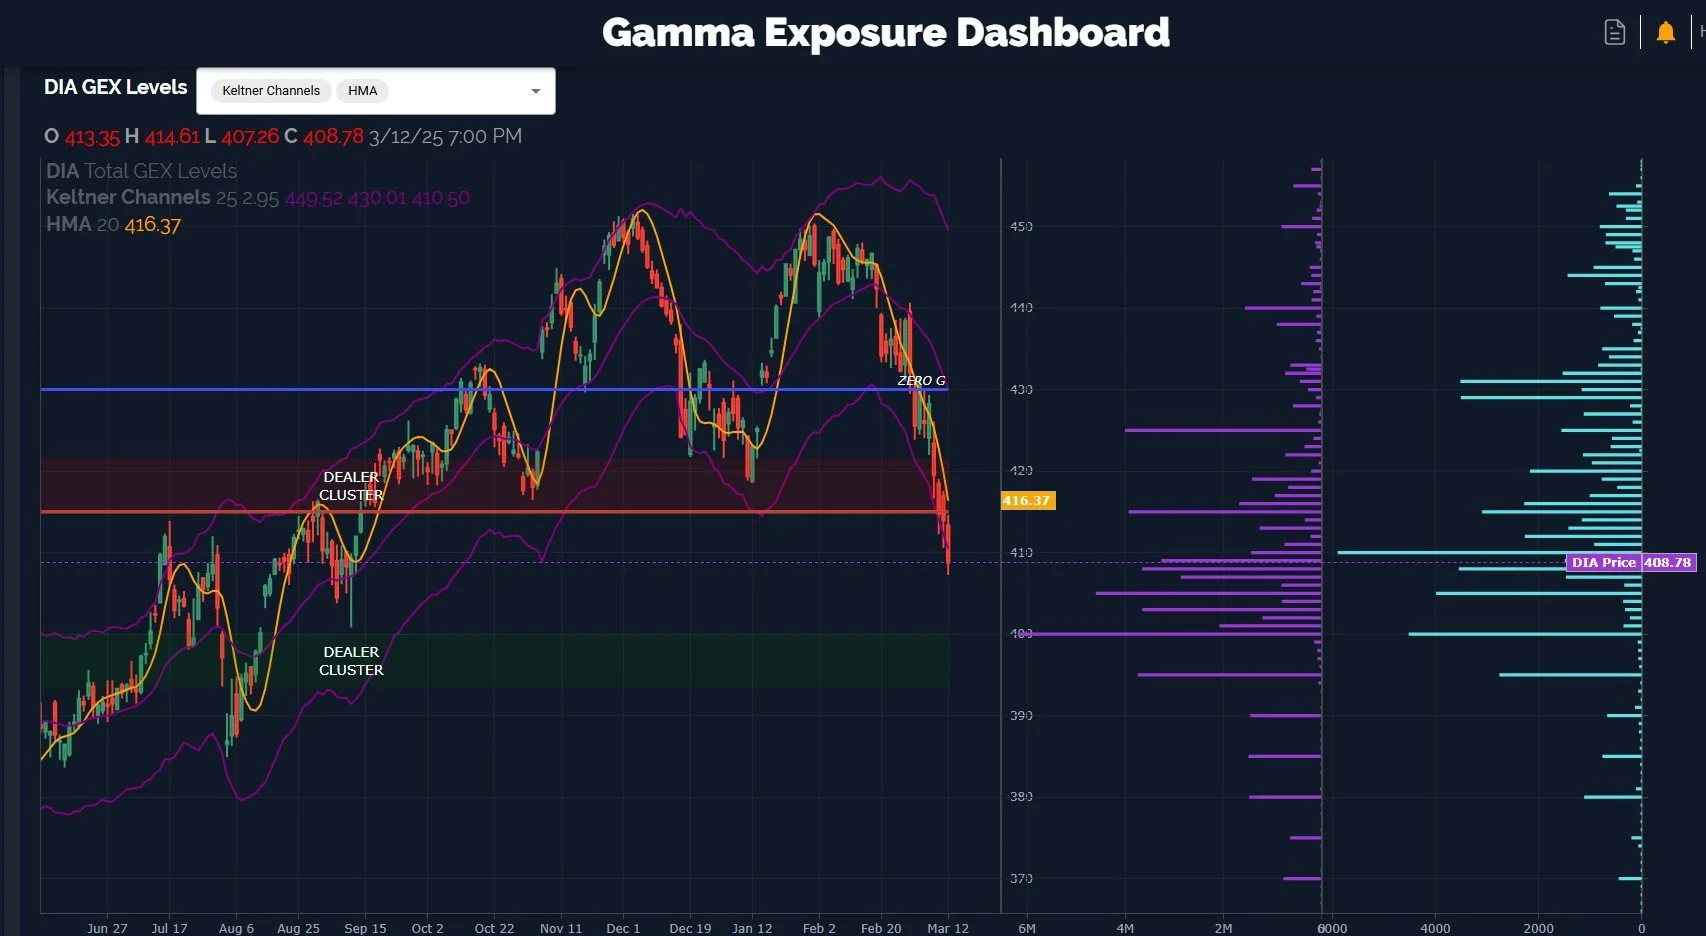
DIA, my fallen angel, the perfect diamond that actually was cubic zirconium, might be close to an attempt at regaining glory as it reached within 1.5% of the big 400 Dealer Cluster below. We see meaningful GEX above as well as meaningful volume at higher strikes, a combination I consider to be bullish. We may need to tag 400, but I am convinced the next appraiser will wipe off his magnifying glass and confirm we do have a diamond, at least for a time.
www.geeksoffinance.com
Here’s the Discord link if you haven’t joined us yet! Access is free for some channels, and new members have a 7-day trial within Discord to see how we operate. We have an active community of thoughtful traders who chime in throughout the day, sharing ideas and opportunities as we see them.
If you’re interested in accessing our tools and analytics, be sure to check out our website! We rolled out backtested algos and chart indicators and we have more improvements on the way!
If you’re interested in learning more about our strategy and approach, we address all of these topics in our Geek University course which is included in all memberships.
We didn’t post a YouTube video tonight, but we have many other short videos, so give our channel a look if you’re curious about recent market commentary and ideas as well as gamma (GEX) concepts explained. We hope to post a new video tomorrow!
Thanks for being part of our community and know that we invite your feedback!
The information provided by Geeks of Finance LLC is for educational purposes only and is not intended to be, nor should be construed as, an offer, recommendation or solicitation to buy or sell any security or instrument or to participate in any transaction or activity. Please view our Investment Adviser Disclaimer and Risk Disclosure.