
SPX Net Vs Gross GEX: February 3 Stock Market Preview
Looking for a magic bullet to enable the laziest trading process possible? We don’t have that, but we are offering $300 off of the annual Portfolio Manager subscription for a limited time, enter code WINTER2026 at checkout!
Our YouTube video today takes a good look at SPX, the VIX, PLTR, AAPL, and AMD, so check it out by clicking Community at the top of our homepage to get the link to our YouTube channel!
Indices staged an impressive comeback off of overnight lows, with ES futures -80 at one point, but SPX closed the cash session with a positive 38.52 point gain.
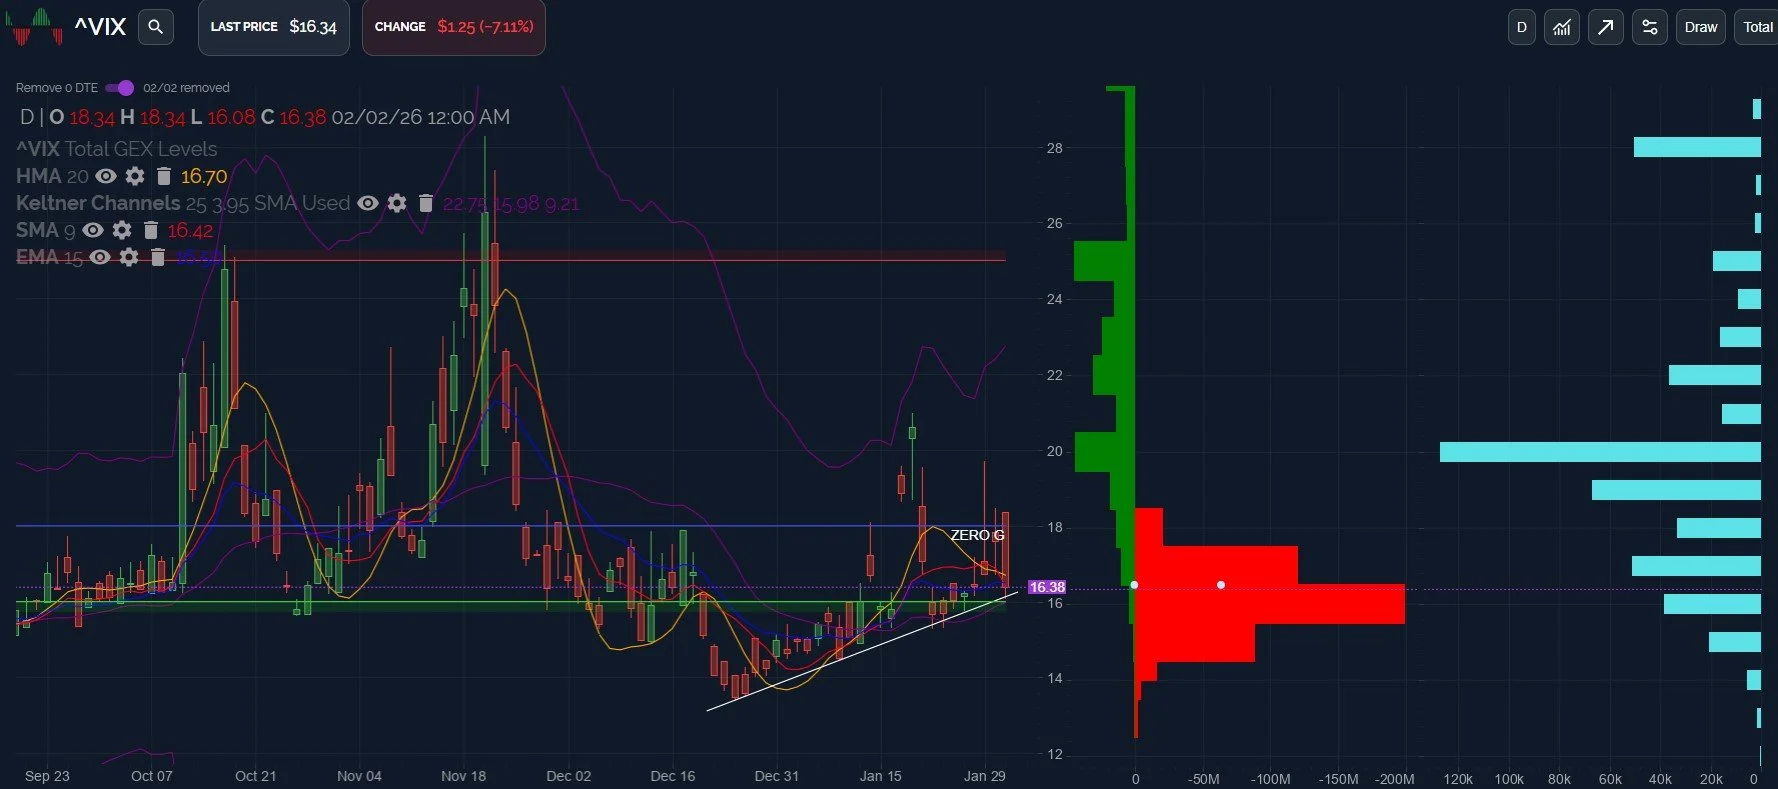
The VIX was also pushed down further, now at the trendline that we can draw back to December.
The pattern is looking conducive toward a larger VIX spike than what we’ve seen, with the lengthy rising trend of higher lows, and maintaining that trendline higher is the direction of current momentum. That said, we’re open to changing our view if we see the VIX string together a couple of days of closing below 16.
Downside still appears limited for the VIX, with most of the negative GEX between 15-16, and SPX is pushing up against the 7000 area, so a decision point is again near.
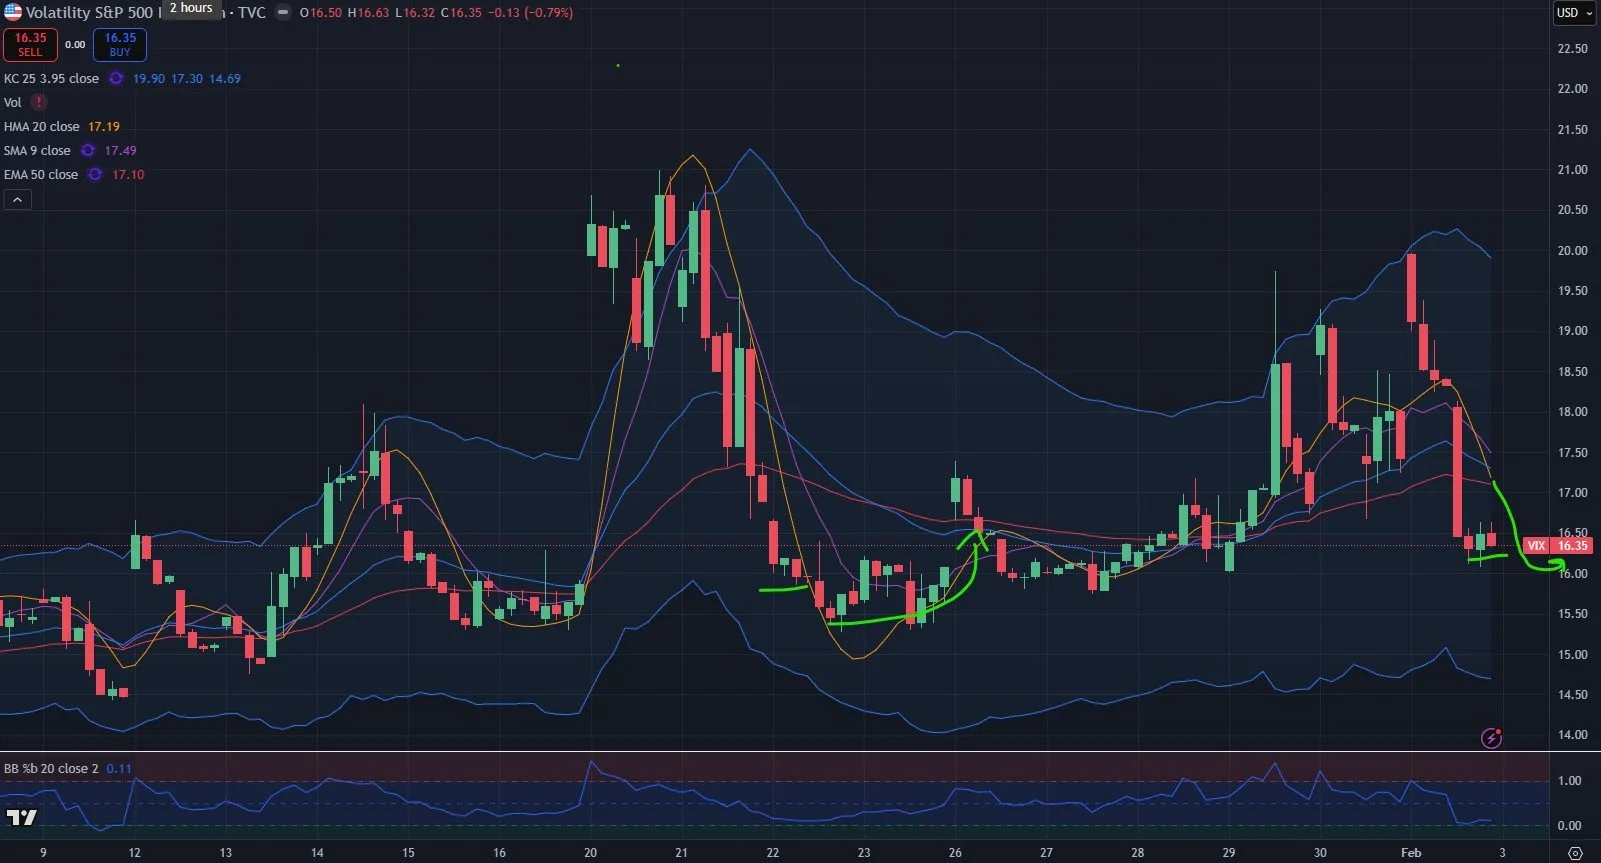
The 2-hour Tradingview chart of the VIX shows early indications of what might play out similar to January 21-22, with a VIX crush ending in sideways movement as the Hull (HMA) crossed beneath the VIX and turned back up. We see the HMA currently plunging while the VIX moves sideways, a trajectory that theoretically should lead to the HMA crossing under the VIX in similar fashion. I consider price above the HMA to be bullish when the HMA is sideways or pointing higher, so we need to see what happens during the next two or three 2-hour bars.
The 2-hour chart points to the 20 strike, near the upper Keltner channel, so any VIX spike will need to be watched at that level to see if continuation higher for the VIX is likely or not.
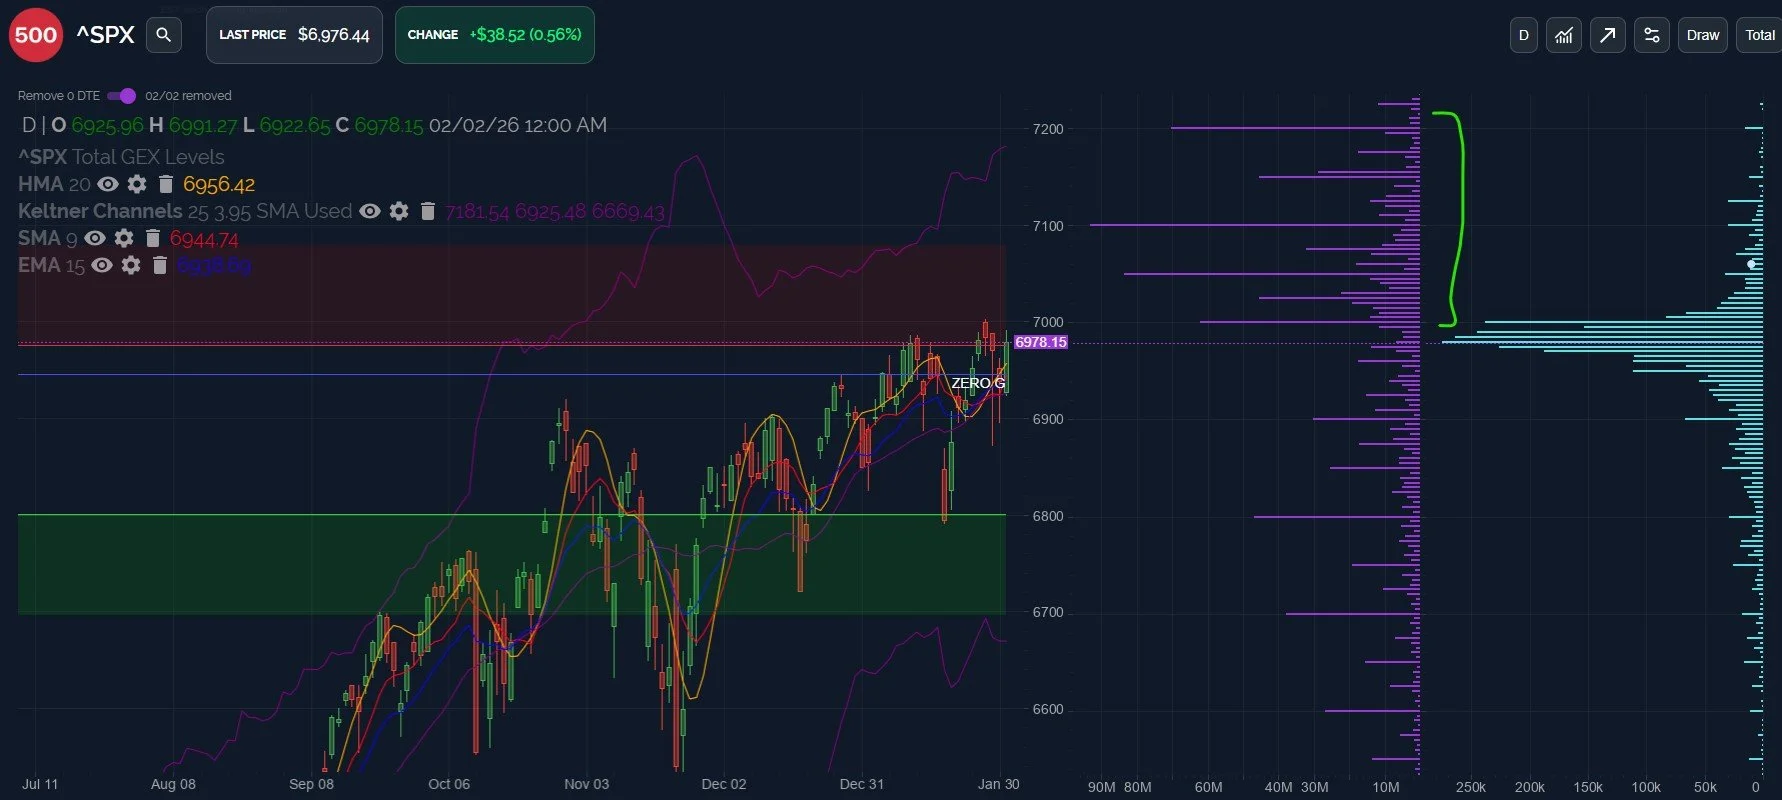
Let’s take a look at SPX’s net GEX position: On the surface, it looks fairly bullish, with sequentially larger GEX clusters as you look up the chain. 7050 and 7100 are now the largest net GEX clusters, and even 7200 is larger than 7000.
Notice most of the volume (daily volume at each strike across all expirations in light blue) concentrated at 7000 or below, and we have one other perspective that casts some doubt on an easy climb higher, which we’ll address momentarily.
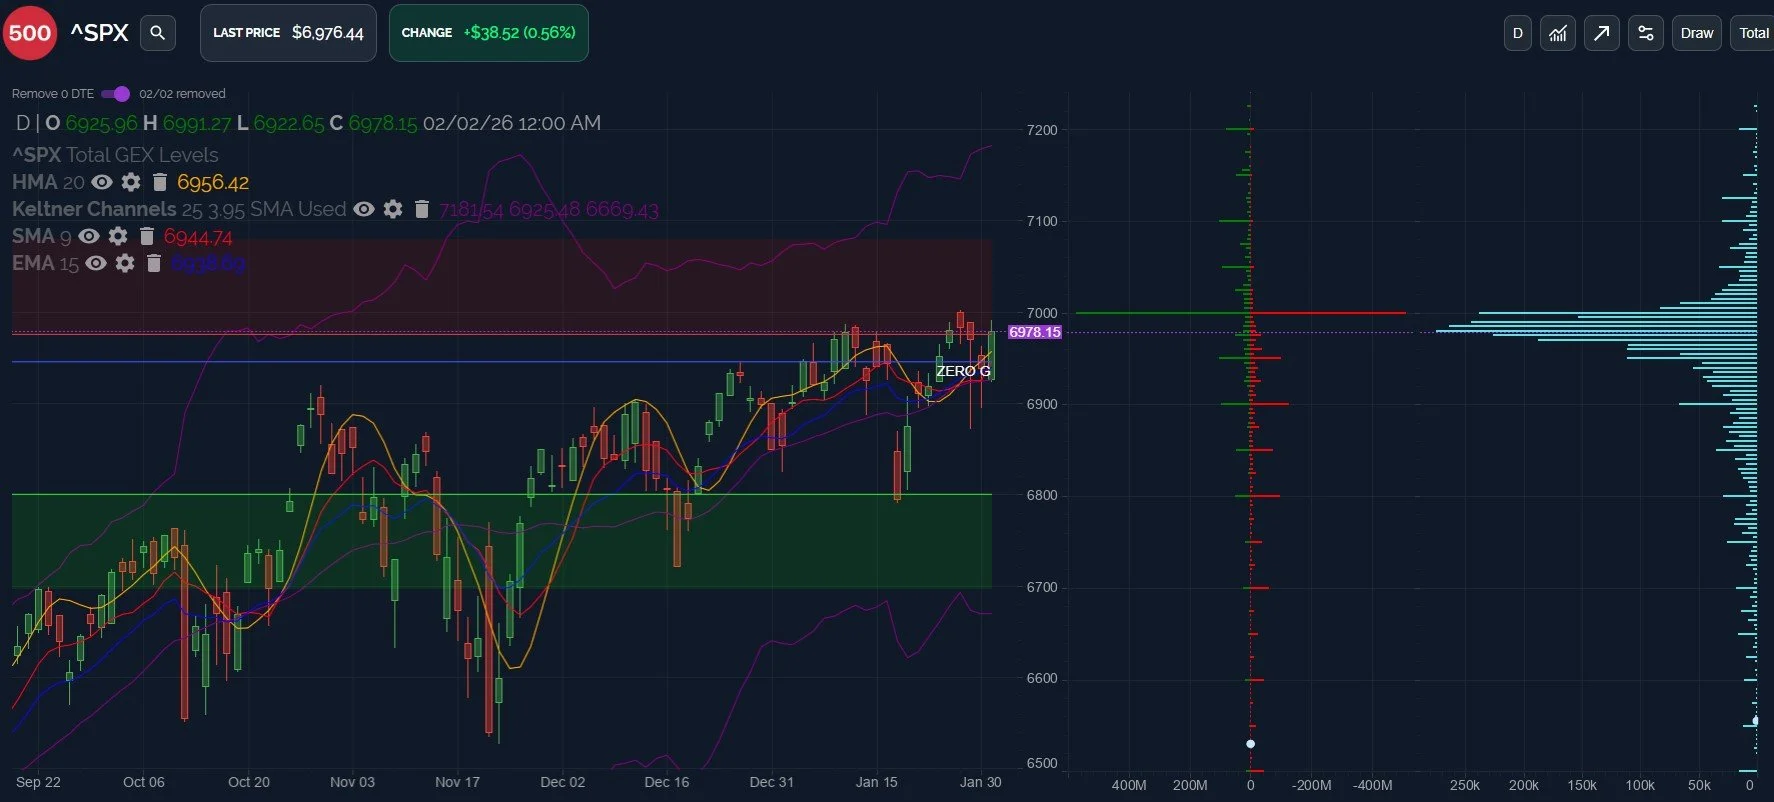
Here’s the concern: Looking at the gross GEX picture, we can see that the positive and negative clusters at 7000 are huge compared to any other strike, appearing as more of a ceiling than a stepping stone.
This contrast with the net picture we glanced at above is one to keep in mind.
My conclusion: SPX looks positive above 7000, but the GEX at 7000 is so significant that we really need to see heavy lifting by the bulls to prove that SPX can close the cash session (any cash session) enough above 7000 to turn that resistance into support.
Failure at 7000 may imply a steeper drop than we saw last week. Ultimately, it would be nice to see the GEX picture shift, since I’m tired of staring at this stale, huge area of green at red at 7000 (“do something!”). A drop to make bulls sufficiently bearish- and thus shifting the GEX away from 7000- may do the trick of clearing a pathway to actually reaching higher targets (see how my contrarian affliction impacts my thinking?). We will minimize speculation and trade what’s in front of us.
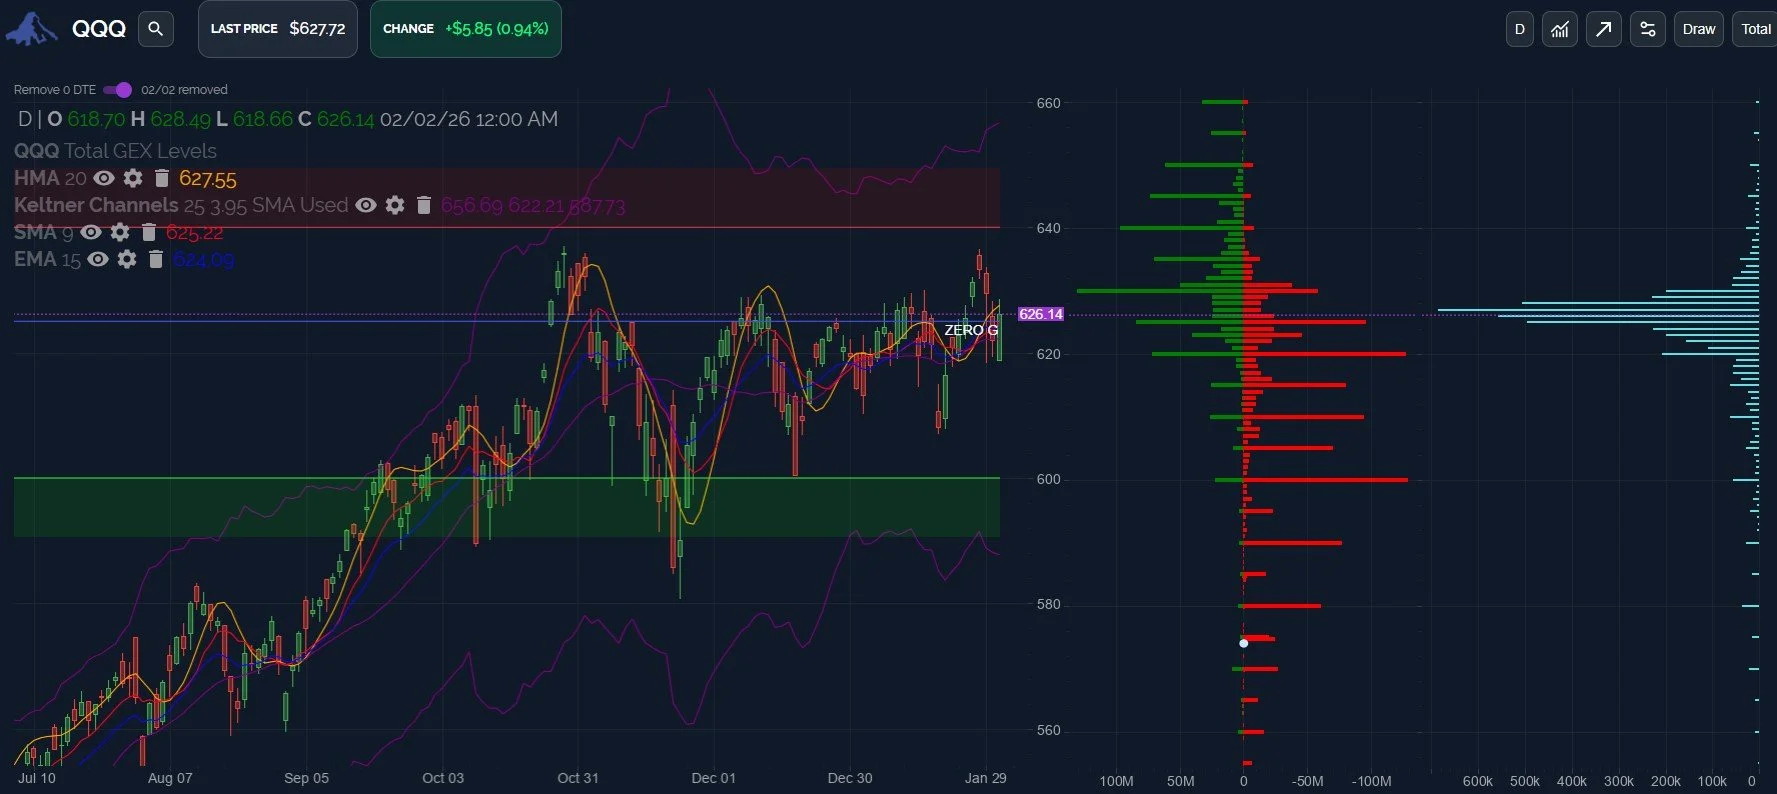
QQQ tested the daily HMA and initially rejected just below the big 630 GEX cluster. 620 is now the area on the downside to watch, with another break and close below 620 likely opening the door to a trip to 600, as we mentioned yesterday.
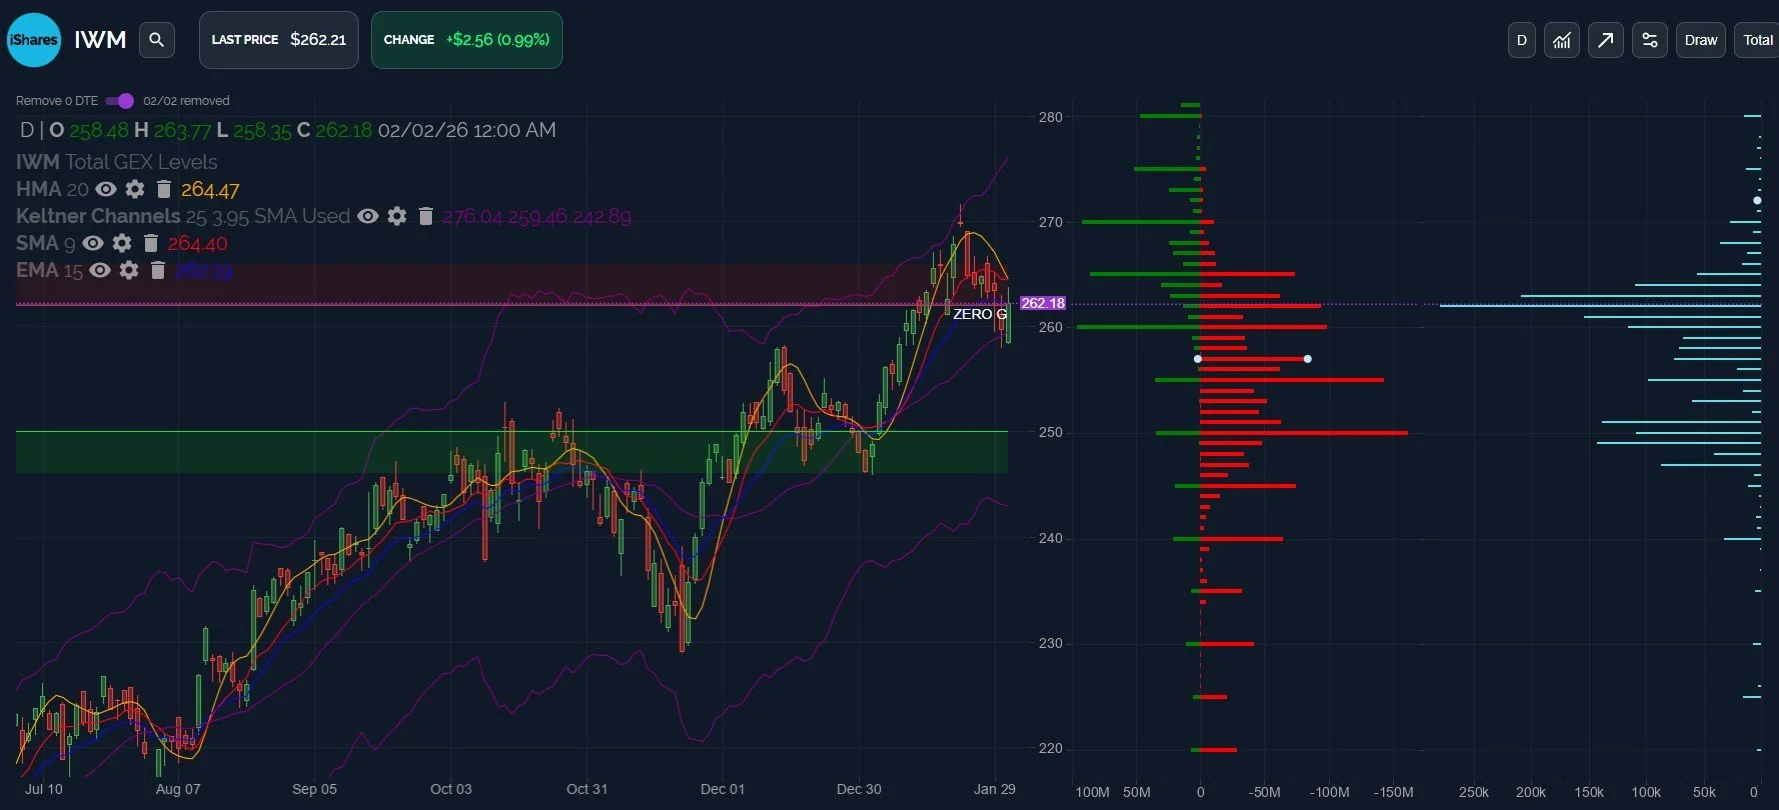
IWM also rejected an approximate retest of the daily HMA. The HMA is steeply declining, so what remains to be seen is if IWM will power through the line and turn the trend back up, or if a trip to 250 is in store first.
Some consolidation and/or limited downside would allow the HMA more time to turn back up, and IWM still holds potential to be a good first candidate to watch in the event of a rebound.
We’ll take a look at the 0 DTE picture in the morning and share our observations in Discord, so we hope you’ll join us!
To enter Discord as a non-subscriber, go to our homepage and click on Community to enter our Discord server! First-time guests receive a free 7-day trial of the premium Discord channels and this is where we discuss what’s happening in real-time.
We also have a live stream accessible from our homepage every day around 10:30am ET, so feel free to join us there.
We are currently offering an annual discount for the Portfolio Manager subscription, so check out the first paragraph of this newsletter for more info!
Thanks for being part of our community and know that we invite and appreciate your feedback!
The information provided by Geeks of Finance LLC is for educational purposes only and is not intended to be, nor should be construed as, an offer, recommendation or solicitation to buy or sell any security or instrument or to participate in any transaction or activity. Please view our Investment Adviser Disclaimer and Risk Disclosure.