
SPX Weakness To Start Love Month? February 2 Stock Market Preview
Looking for a discount almost as big as silver’s drop on Friday? Get $300 off of the annual Portfolio Manager subscription for a limited time, enter code WINTER2026 at checkout!
Our YouTube video today takes a good look at SPX, META, TSLA, MSFT, SLV, the VIX, GLD, and BTC, so a lot of ground is covered. Check it out by clicking Community at the top of our homepage to get the link to our YouTube channel!
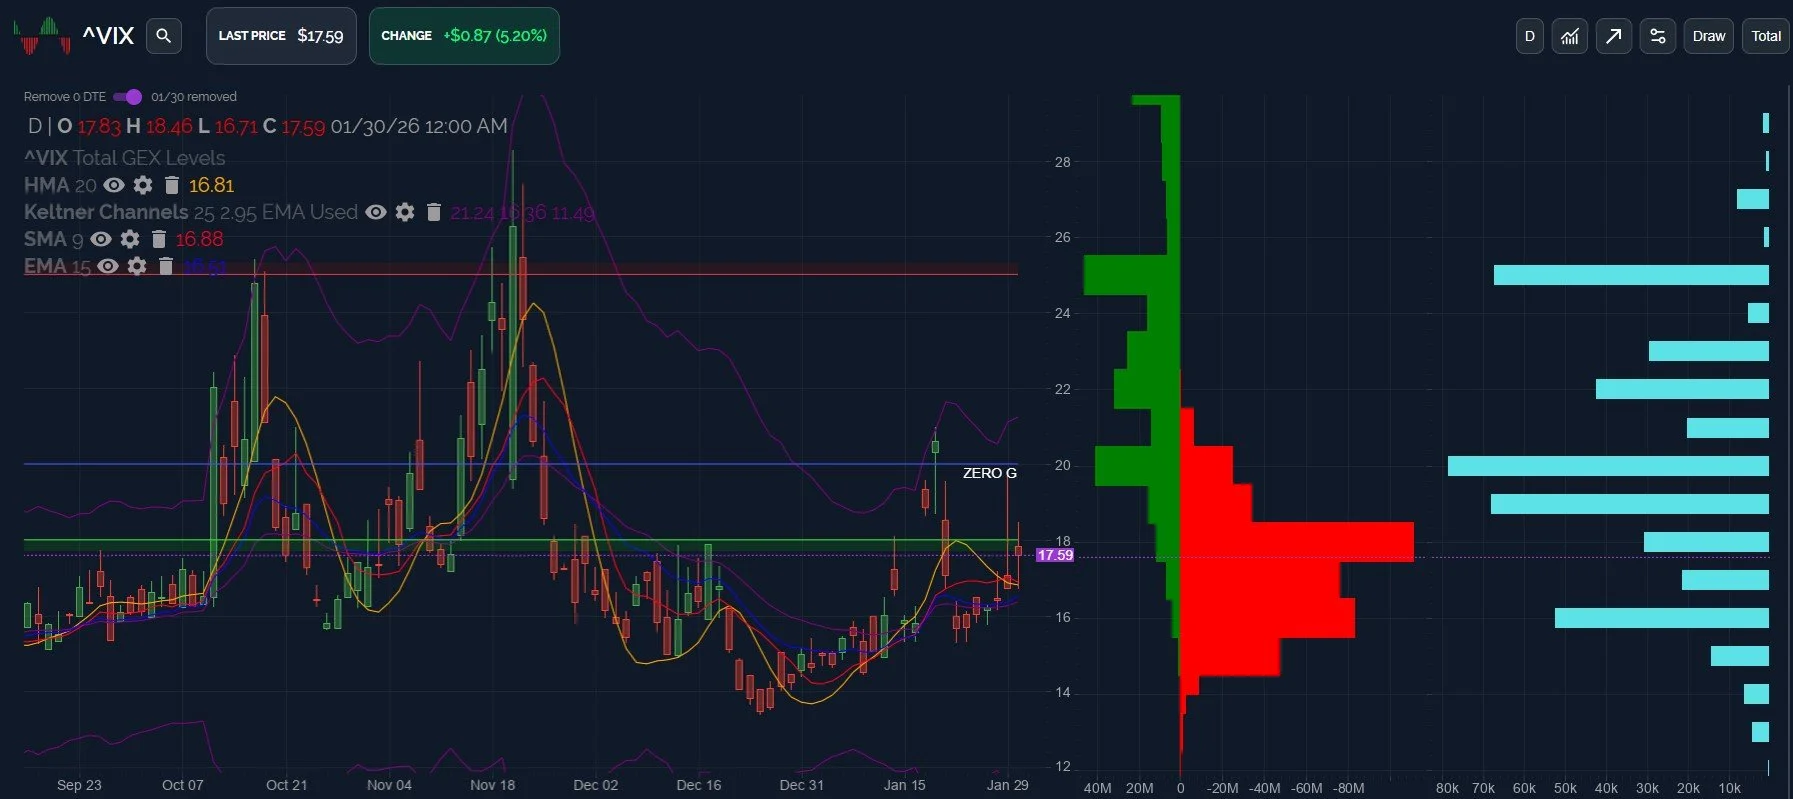
The last two days have seen the VIX spiking intraday, all while maintaining the uptrend for the VIX since late December, marking a series of higher lows with each passing day. It seems that the VIX is making clear that it’s not done yet.
We also see the VIX now above the daily Hull Moving Average (HMA), which is flattening out after the post-spike decline recently.
Closing above the HMA is a bullish signal for volatility, in my view. We continue to see a lack of GEX below 14.5 and volume at higher strikes, a consistent theme that backs a view that the VIX (for now) appears to be on a trajectory of holding above 14 and potentially could reach strikes much higher.
We don’t believe we’re entering a secular bear market just yet, particularly when addressing a bigger picture view, but we could see immediate weakness that becomes a buying opportunity in the next few days and weeks.
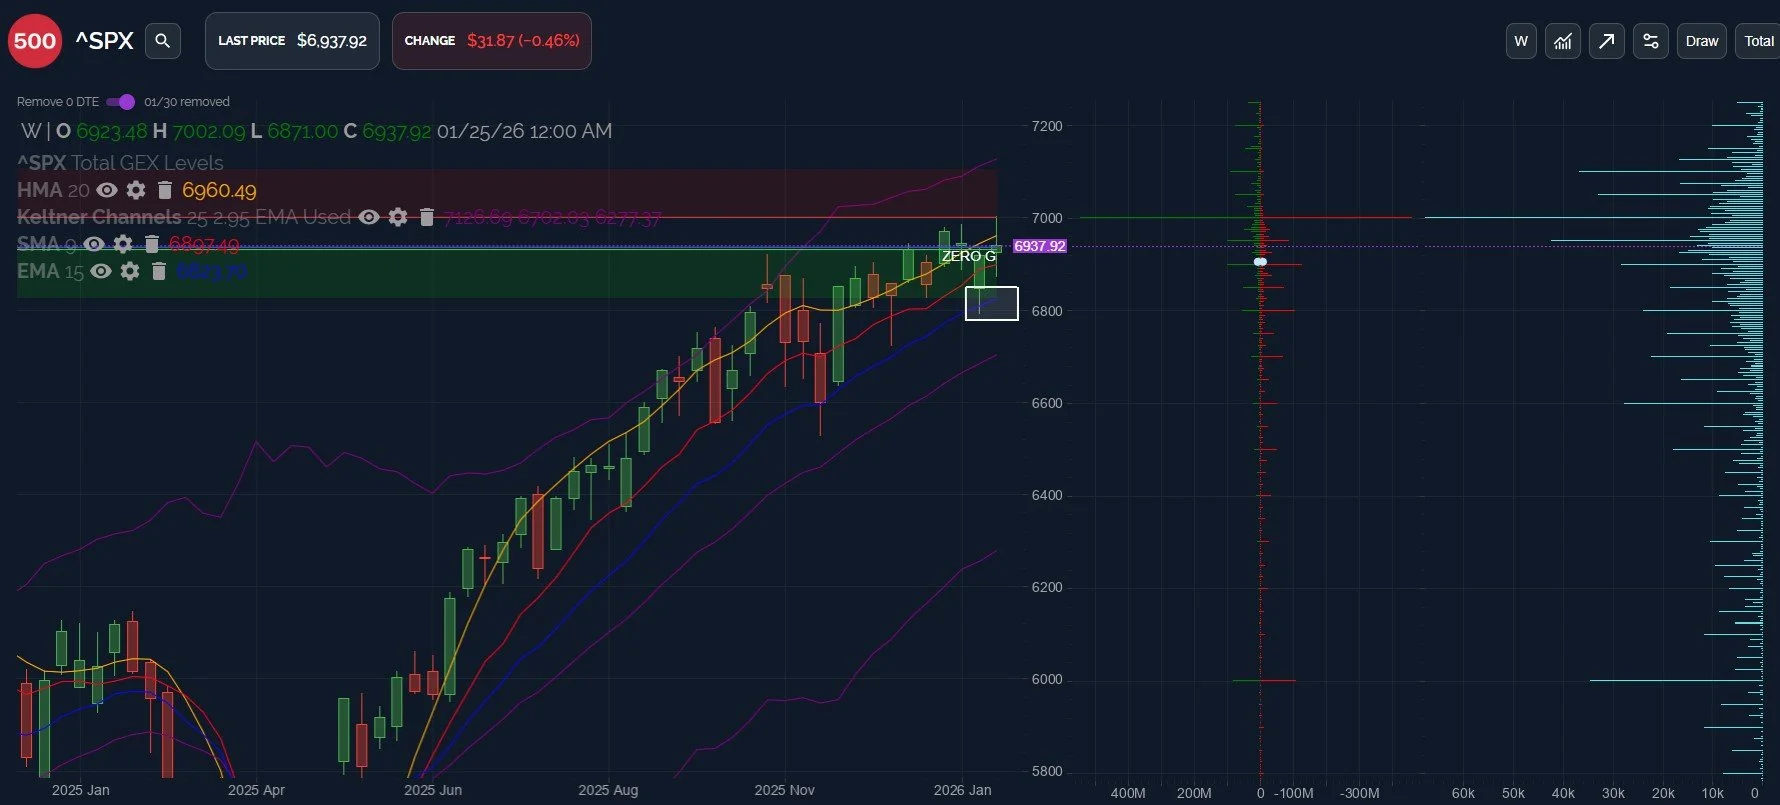
SPX still shows a weekly picture that favors a continued uptrend, though the daily chart is showing cracks.
The rejection initially from 7000 should be no surprise, and last week saw a close below the weekly HMA, though still near the line.
The gap down in futures would theoretically bring SPX near Friday’s intraday low, but the GEX picture best aligns with the 15 EMA (the blue line) as an initial target in the event of continued downside.
The 15 EMA has contained weekly declines since April 2025, so it’s certainly possible a trend change by violate this recent tendency, but until then, we might look for a reaction at that spot, the lower edge of the lower Dealer Cluster zone.
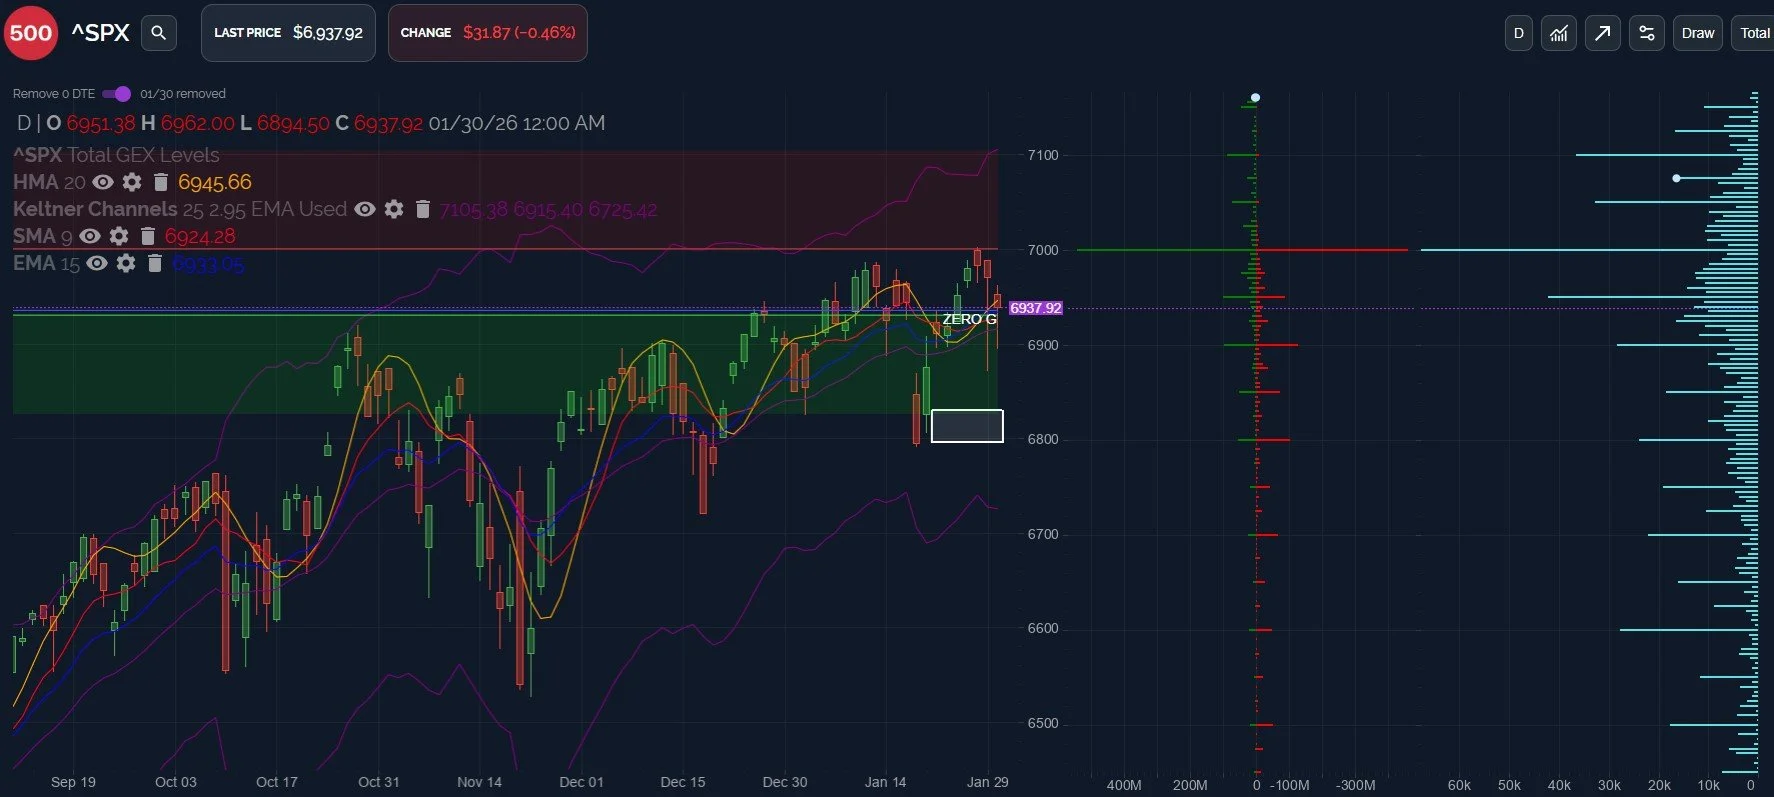
SPX’s daily chart shows a close Friday just below the HMA, though close enough to not have made the gap down Sunday evening too obvious.
The 15 EMA on the weekly chart we just mentioned 6823.70 would align with a higher low since Mid-January, if we’re to see immediate continuation higher.
We recently discussed historical mid-term election year seasonality, which favors an early February low that might last until late Spring, so keep this in mind as a possibility if we see weakness over the next few days.
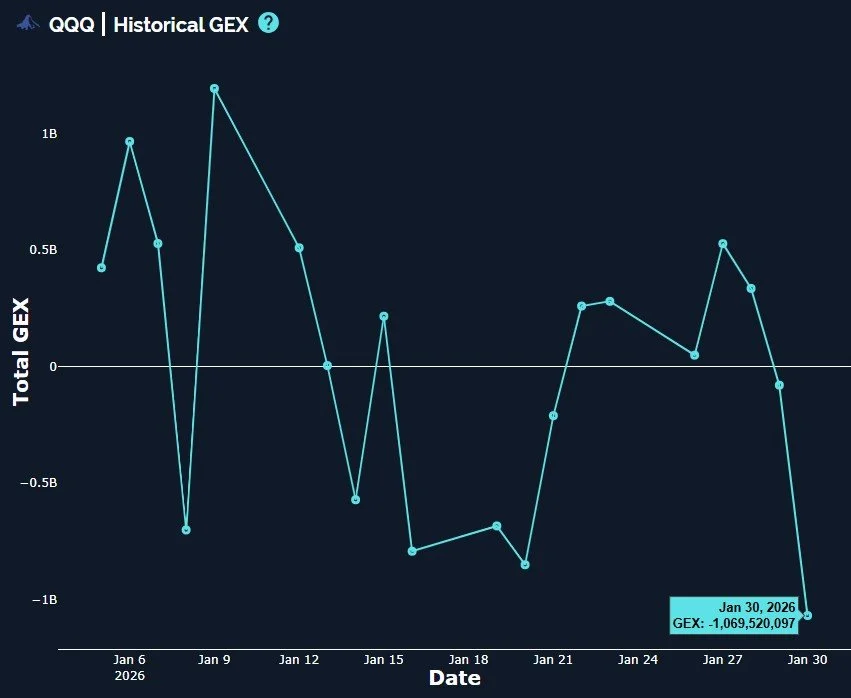
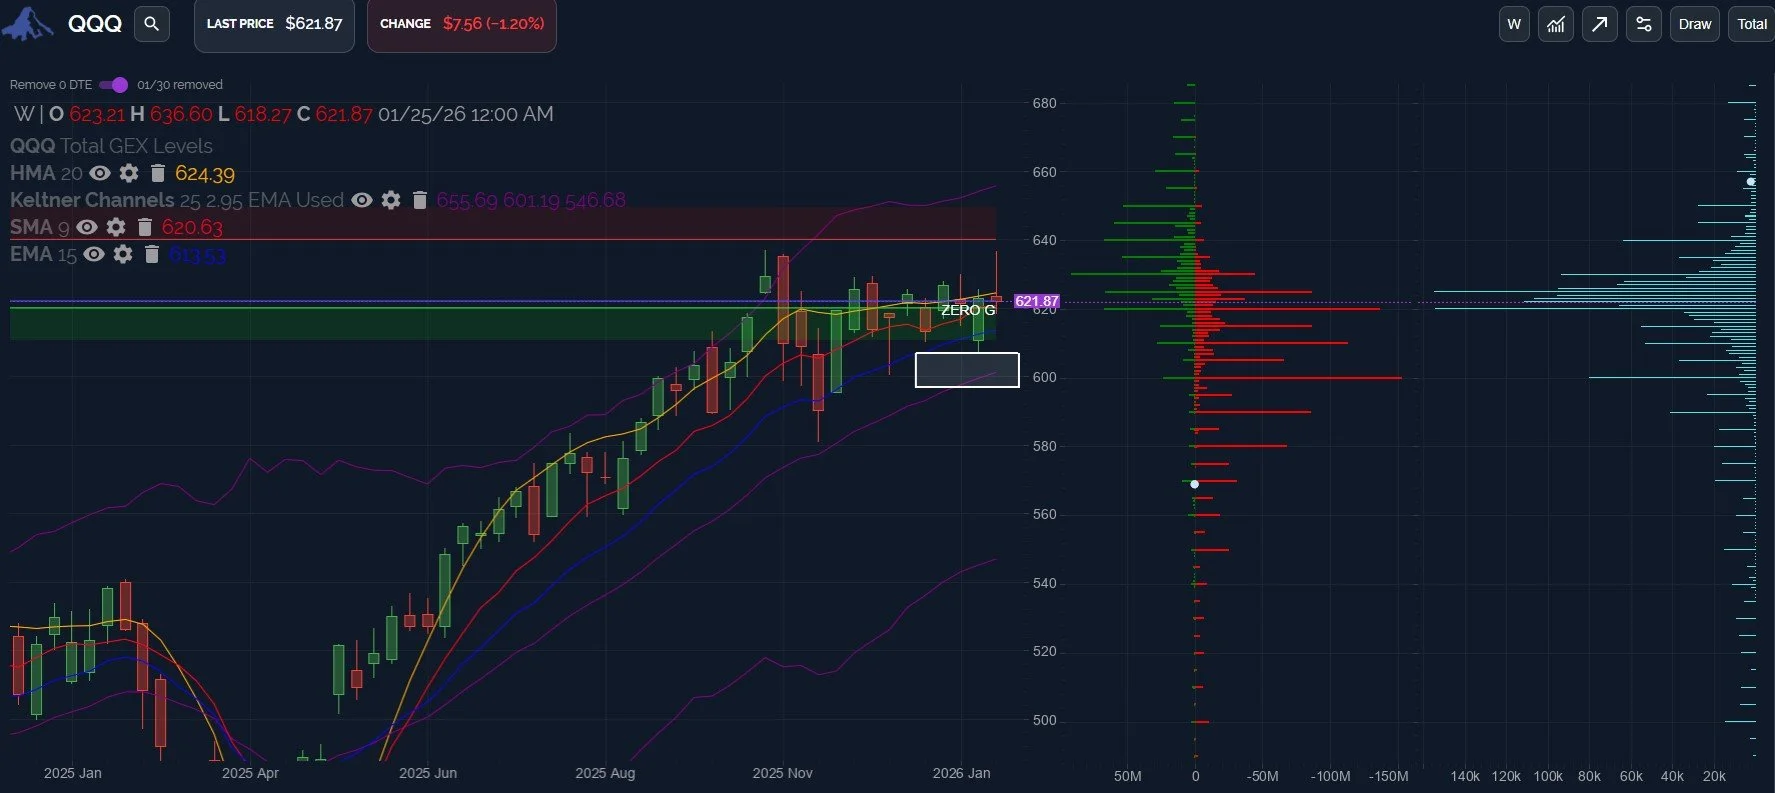
QQQ saw a deep drop into negative net GEX territory, lower than any time in 2026 so far. That said, the current GEX reading is not yet at an extreme when we compare the reading to other readings over the past 52 weeks, a function of our GEX Intensity Gauge.
The weekly candle on QQQ looks downright nasty. A long wick and a close below the HMA. The Keltner channels still angle higher, though barely, and QQQ hasn’t made a new high since October.
The large GEX cluster at 600 is an obvious target, also matching up with the middle Keltner channel, a spot that we’ll be watching for a reaction, if we reach it. Below 600 and we can start talking about 580.
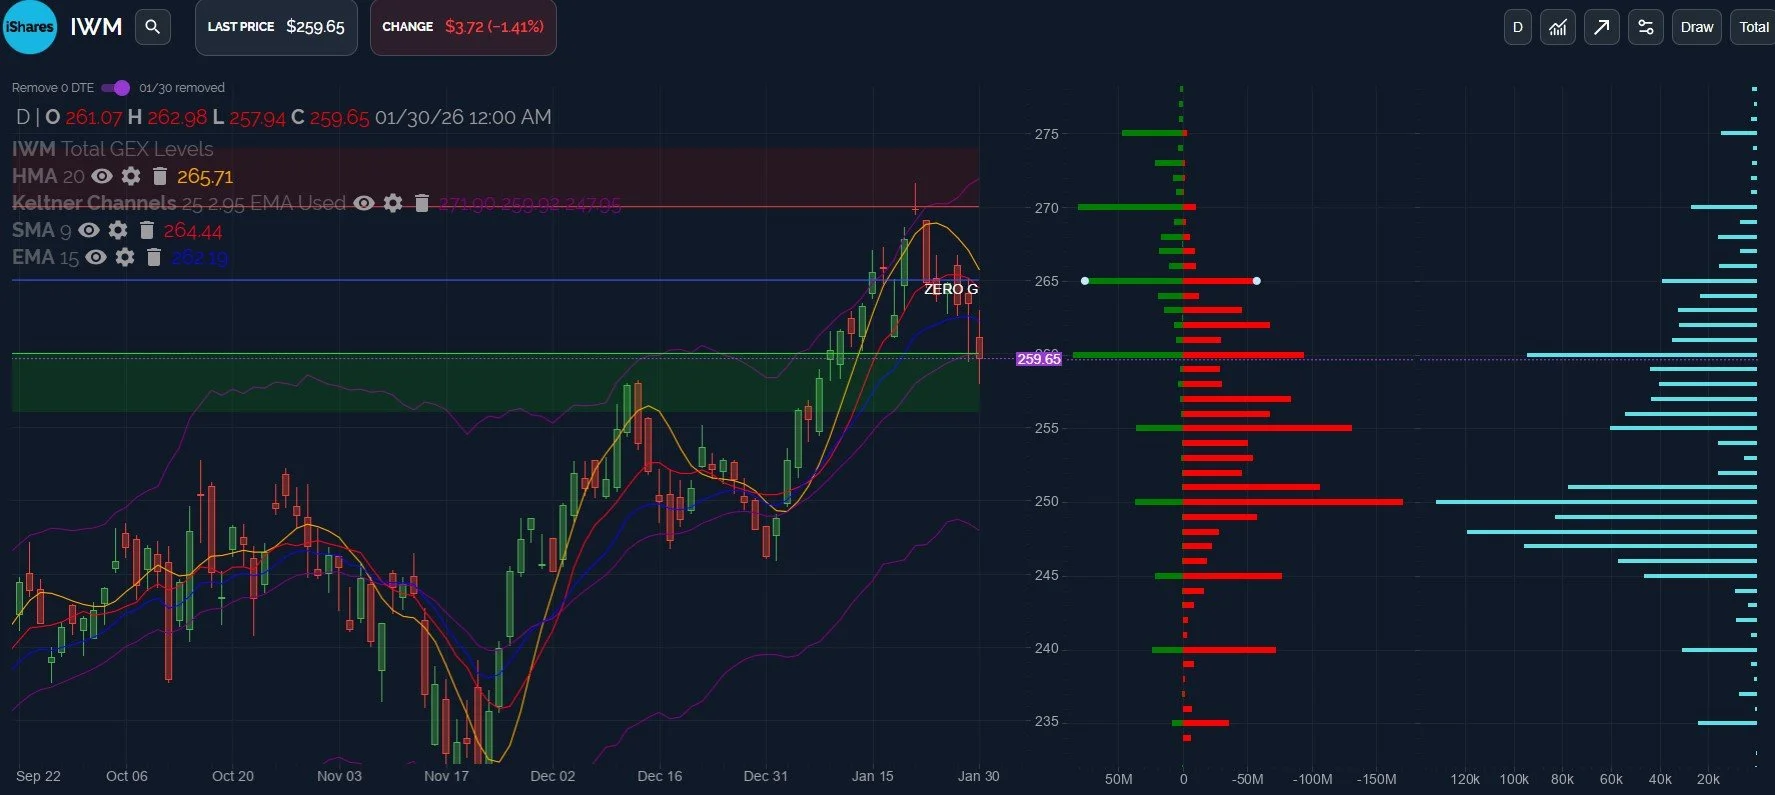
IWM didn’t give much of a bounce last week, despite my desire to see a retest of 270 sooner than later. The lack of strength in rebounding was likely an indicator in and of itself, with IWM closing just below the key 260 GEX area.
Futures indicate 255 is a “done deal” at the moment and the repeated high volume at 250 brings that large GEX cluster into focus. 250 is also near the lower Keltner channel on the daily chart.
Given IWM’s continued habit of leading us up and down, we’ll watch IWM for early signs of a turn back up.
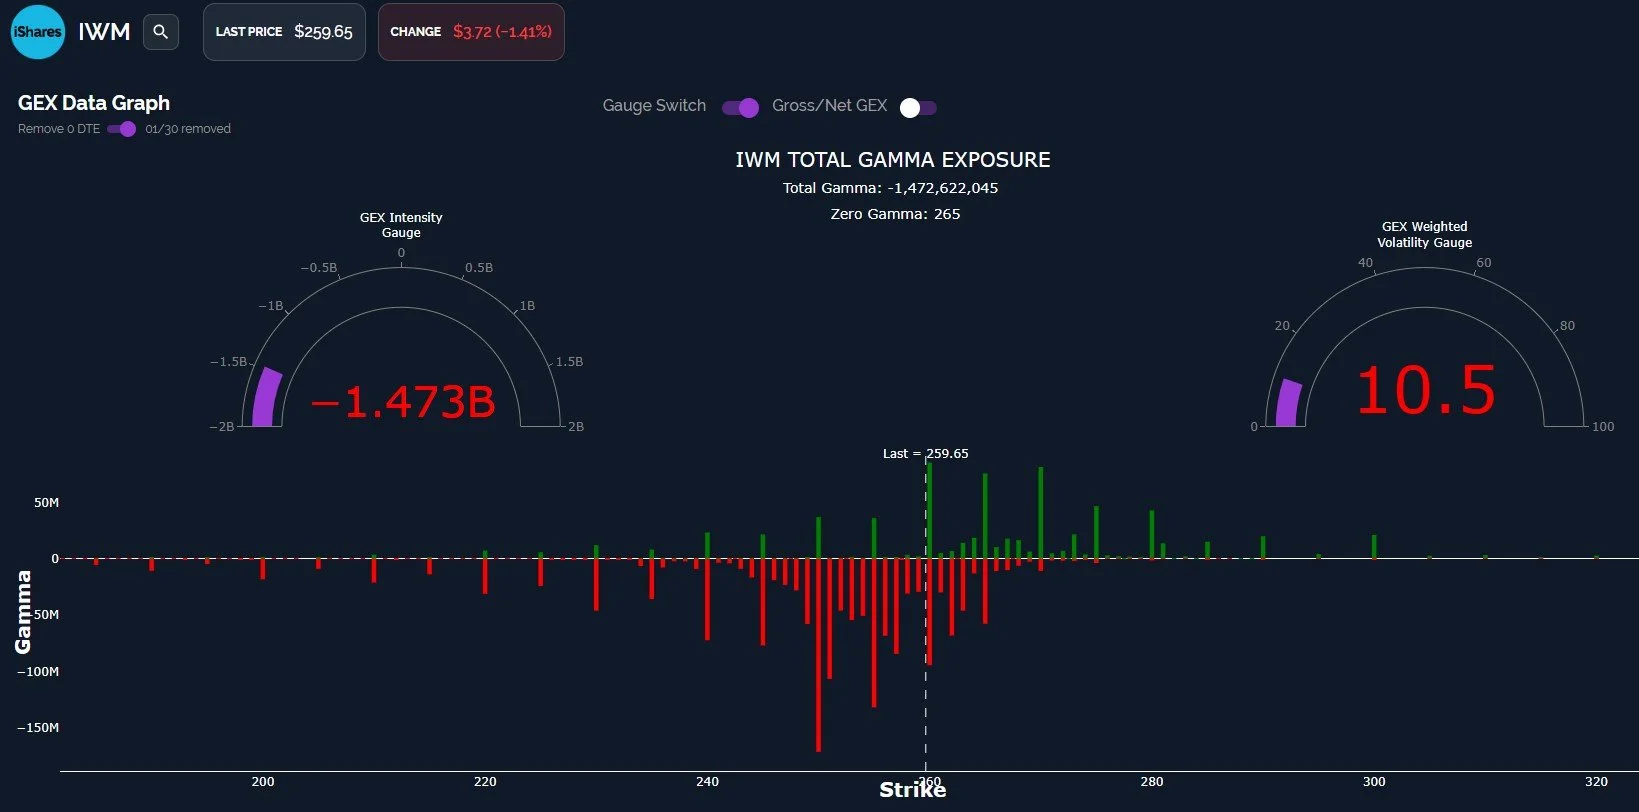
Another contrarian signal in favor of a bounce possibly being nearby is IWM’s net GEX, which is approaching a negative extreme, as shown on the GEX Intensity Gauge. Extreme readings are not exact timing tools, but in general, an extreme reading is akin to too many passengers being on one side of the ship, causing it to list sideways. The sharp turn causes the crowd to then run to the other side, creating a contrarian bounce or turn in the other direction from that point.
We’ll take a look at the 0 DTE picture in the morning and share our observations in Discord, and we’ll start out the week with some free sharing of real-time information in our general chat, so join us if you haven’t already.
To enter Discord as a non-subscriber, go to our homepage and click on Community to enter our Discord server! First-time guests receive a free 7-day trial of the premium Discord channels and this is where we discuss what’s happening in real-time.
We also have a live stream accessible from our homepage every day around 10:30am ET, so feel free to join us there.
We are currently offering an annual discount for the Portfolio Manager subscription, so check out the first paragraph of this newsletter for more info!
Thanks for being part of our community and know that we invite and appreciate your feedback!
The information provided by Geeks of Finance LLC is for educational purposes only and is not intended to be, nor should be construed as, an offer, recommendation or solicitation to buy or sell any security or instrument or to participate in any transaction or activity. Please view our Investment Adviser Disclaimer and Risk Disclosure.