
Chopfest 2026: February 4 Stock Market Preview
Looking for a community of experienced traders as well as a platform that contains concise and useful data? Take advantage of our $300 discount off of the annual Portfolio Manager subscription for a limited time, enter code WINTER2026 at checkout!
Our YouTube video today takes a good look at SPX, QQQ, the VIX, BTC, and AMD, so check it out by clicking Community at the top of our homepage to get the link to our YouTube channel!
We started yesterday’s newsletter with a warning about the VIX, and today we saw the VIX spike to 20 as indices dropped.
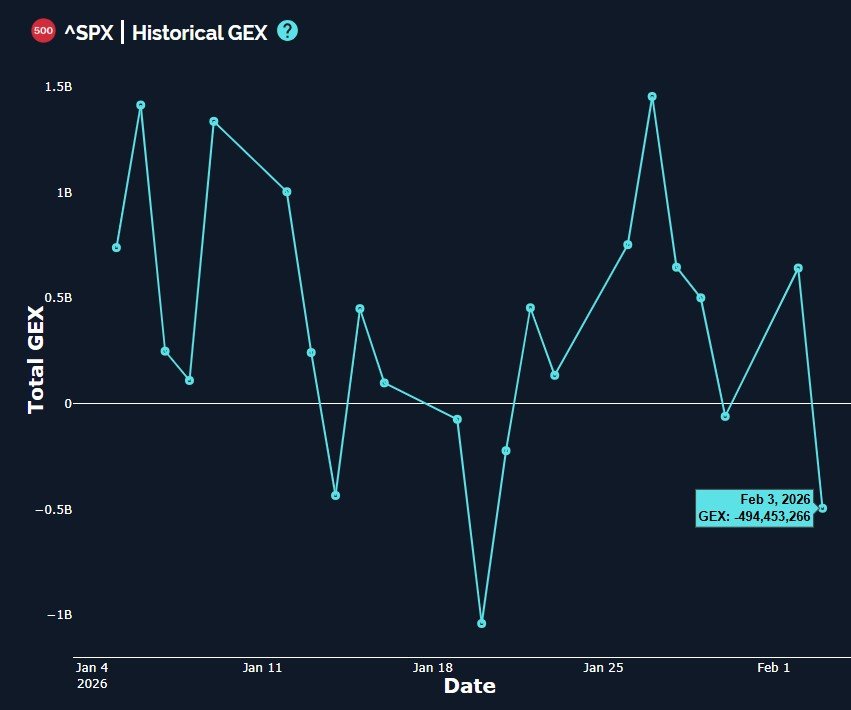
So far, we have not seen lower lows compared to recent drops for QQQ and IWM, but SPX made a lower low compared to yesterday, and we do see SPX net GEX probing deeper into negative territory. Will negative GEX persist or is this another 1-day whipsaw?
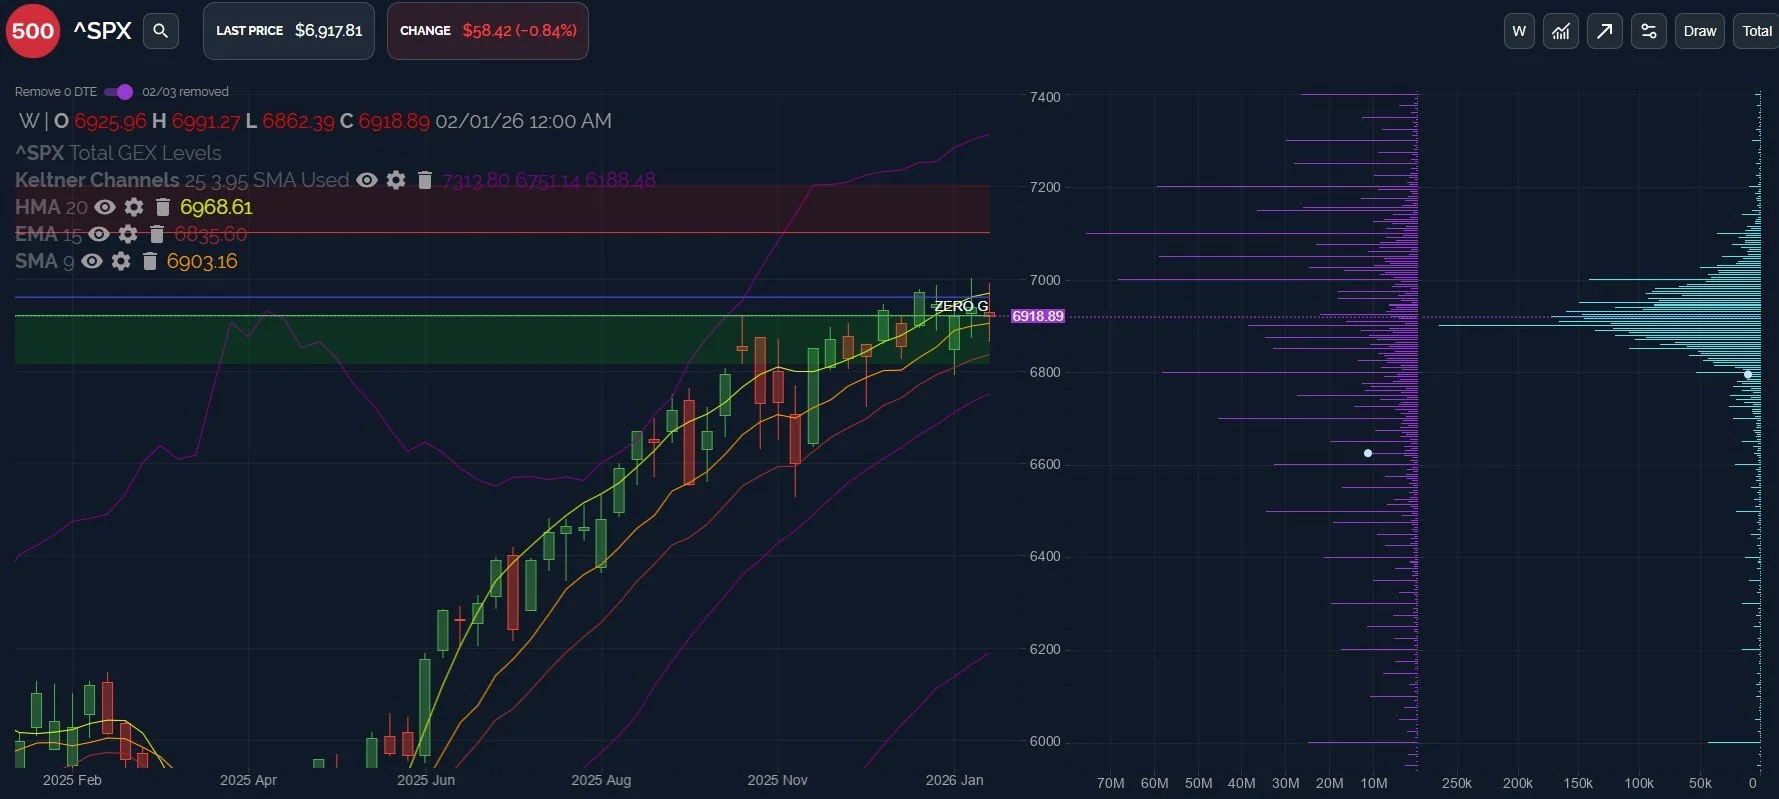
SPX is below the Hull (HMA) on the weekly chart, and 7000 continues to represent resistance to the upside.
Today’s low almost reached 6850, which was a significant GEX level intraday. The reversal back up from 6862 led to SPX closing back above the key 6900 level.
Looking at the total picture currently, we’re left with a slight bias toward the negative as SPX shows negative net GEX and remains below the daily and weekly HMAs. GEX levels that may serve as near-term magnets include 6800 to the downside and 7000 to the upside, which may become relevant if SPX can recapture 6950 again.
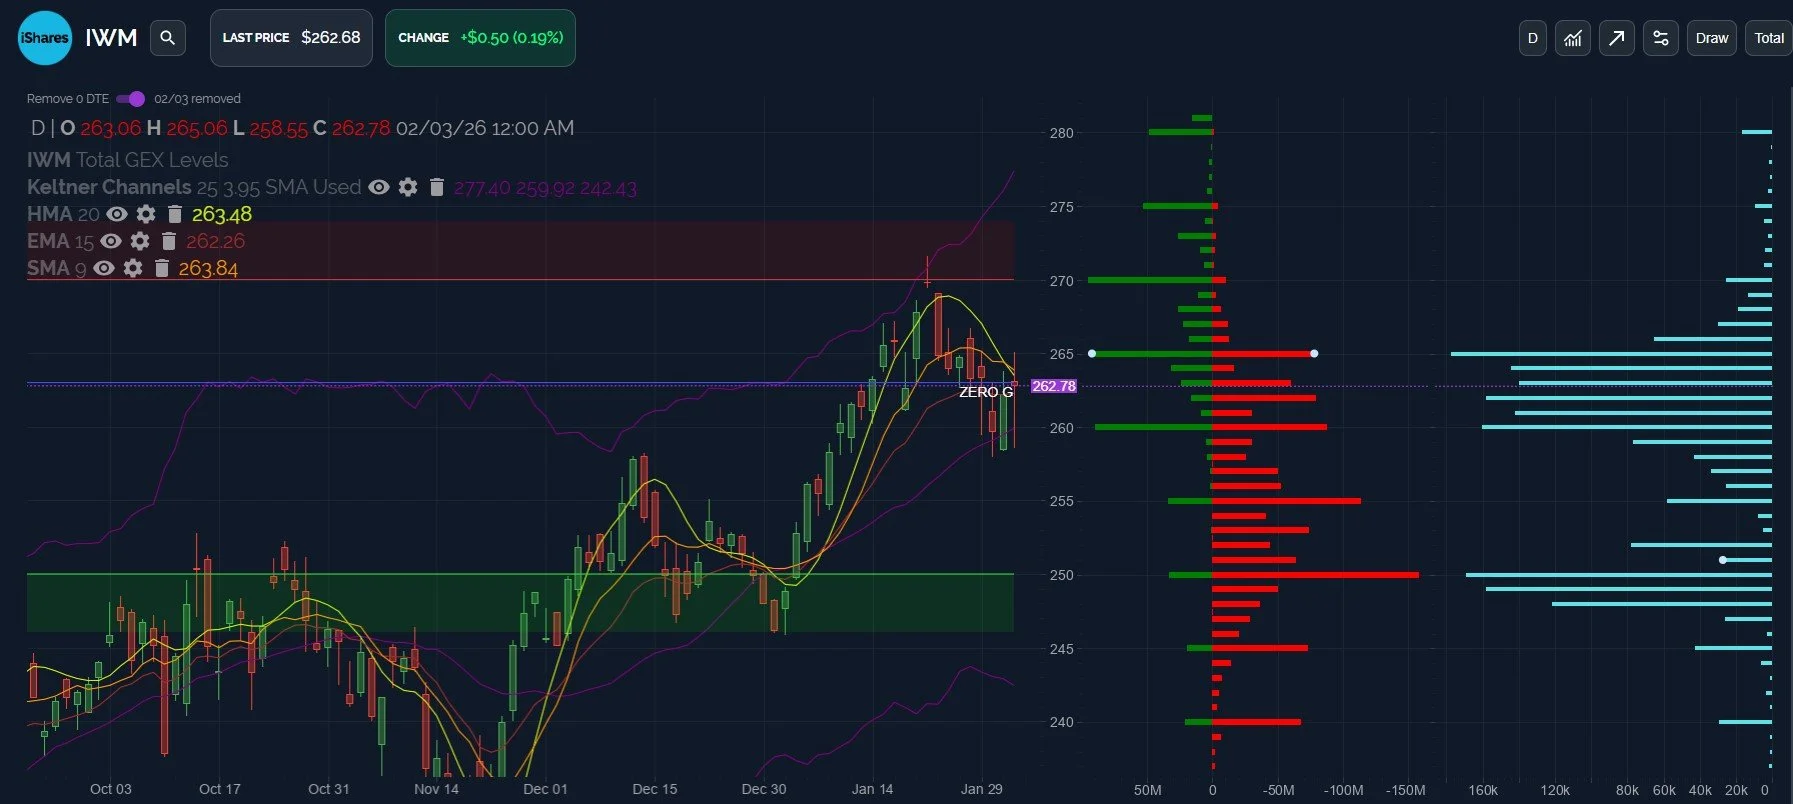
IWM showed early strength that ended up failing, with IWM making a slightly higher low compared to the last two days at 258.55.
Do 3 breaches of 260 in 3 days mean we are likely to break through 260 to the downside? I know similar action in the opposite direction would usually be considered bullish, so I guess if we’re being consistent, there’s at least a fair chance we continue lower toward 250-255.
Volume has been high at 245-250 for several days, and a large negative GEX cluster rests at 250.
Today’s close just below the declining HMA does bring the possibility of a breach to the upside, with 265-270 as possible targets.
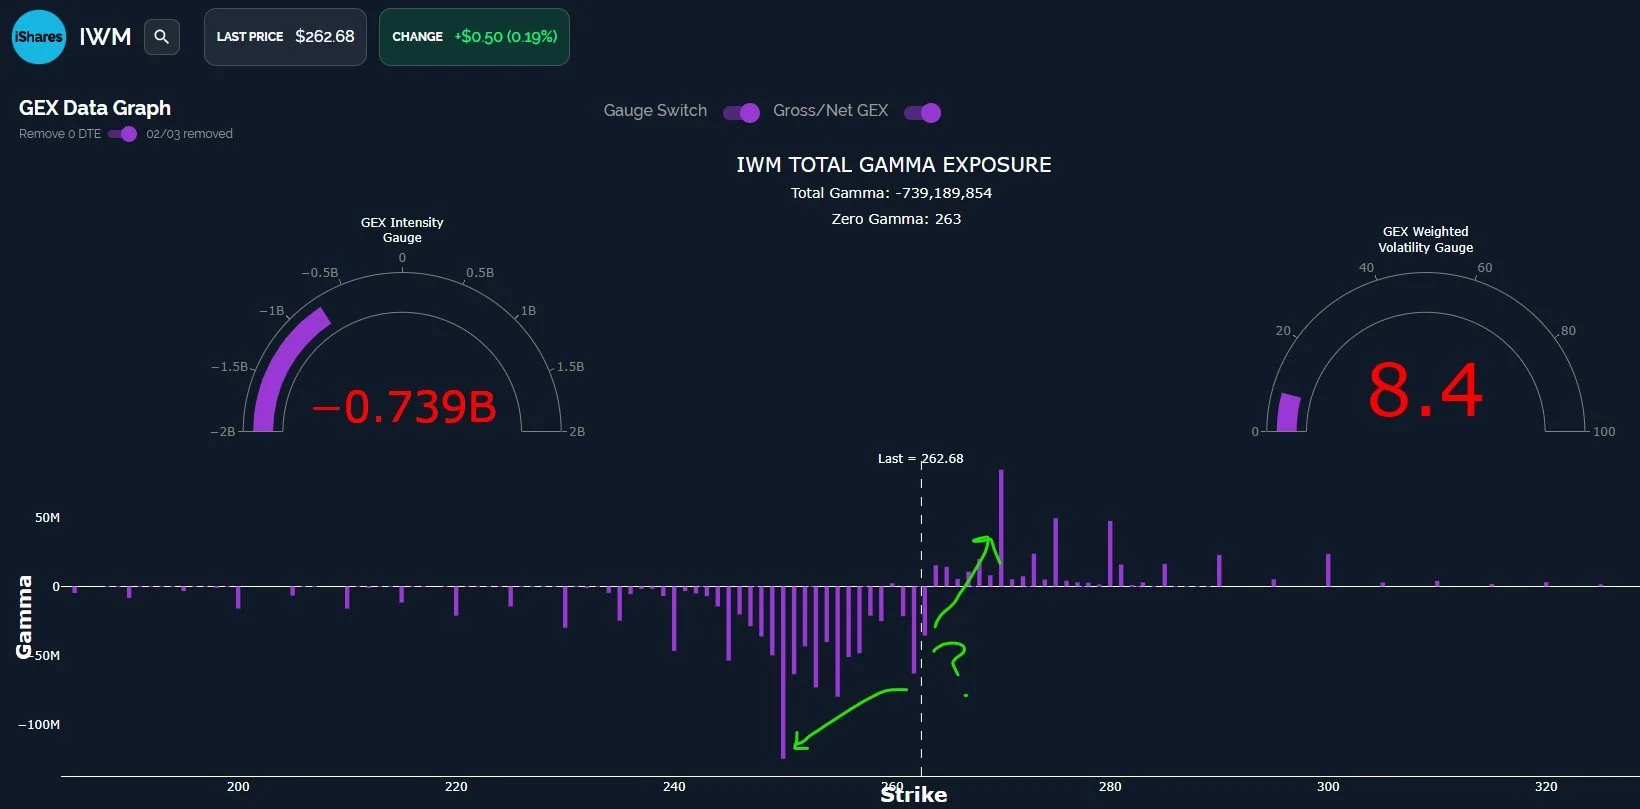
The current potential issues with IWM are the negative GEX reading along with the underlying structure that is mostly skewed toward lower strikes, as shown on the data graph below.
The net GEX picture shown indicates 270 as the most likely upside target, but we don’t see much beyond that in terms of meaningful GEX.
The negative GEX clusters seem to strongly suggest a likely pathway toward 250.
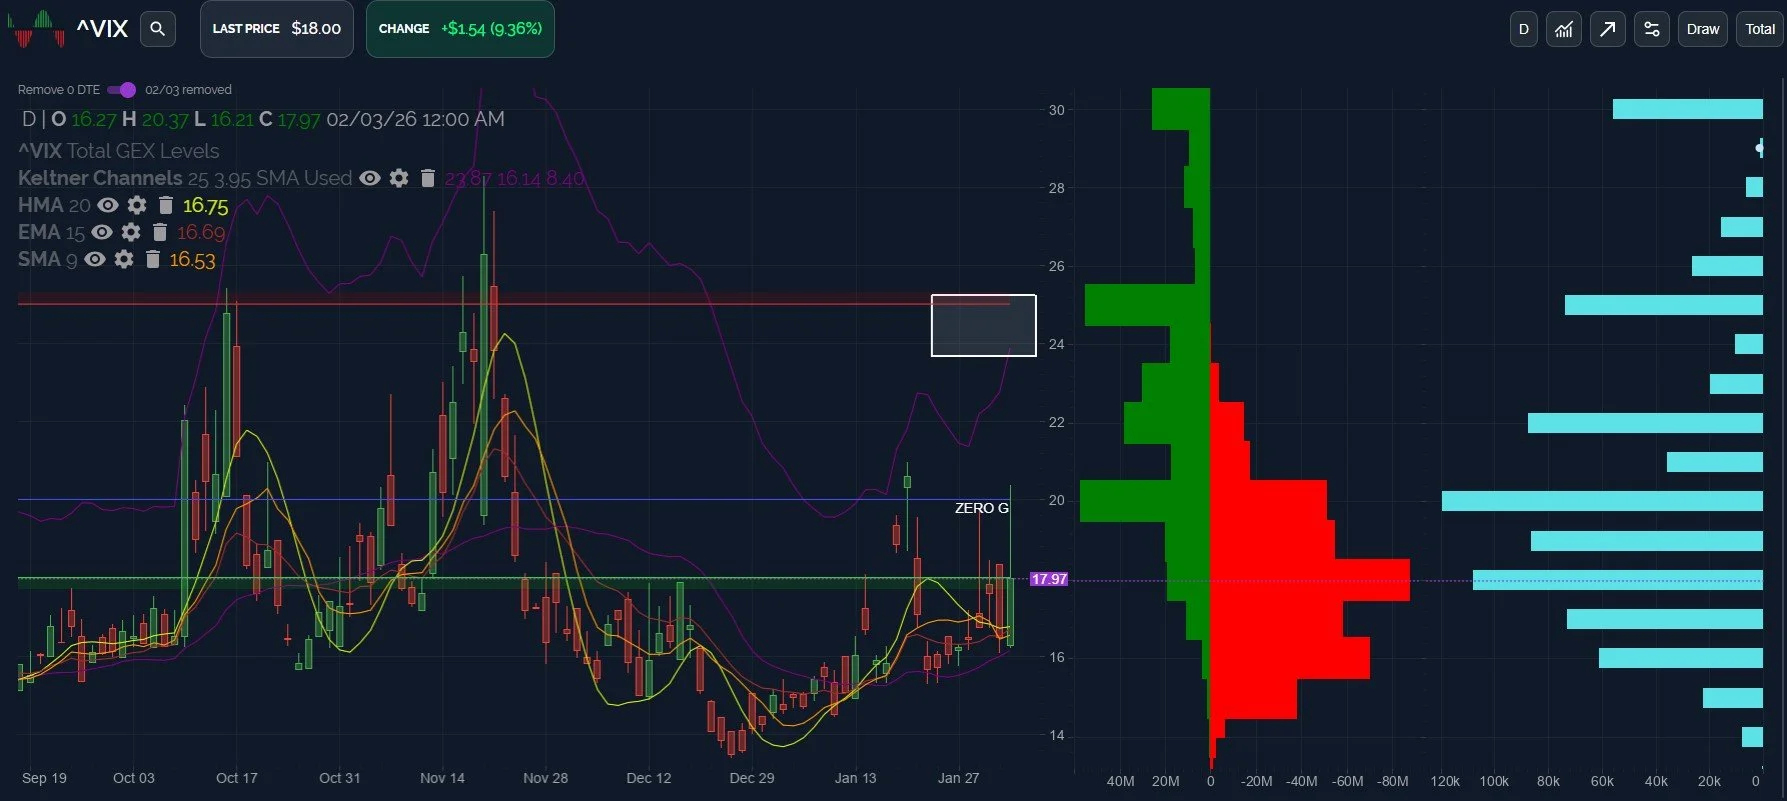
The VIX spiked to just above 20, but the fade intraday did not yet violate any key reversal areas, so we’re left with an uncertain picture that lends credit toward the potential for a continued spike toward VIX 25.
Any further push lower for the VIX needs to hold the 16.50-16.75 area for me to maintain confidence that the rising pattern of higher lows continues.
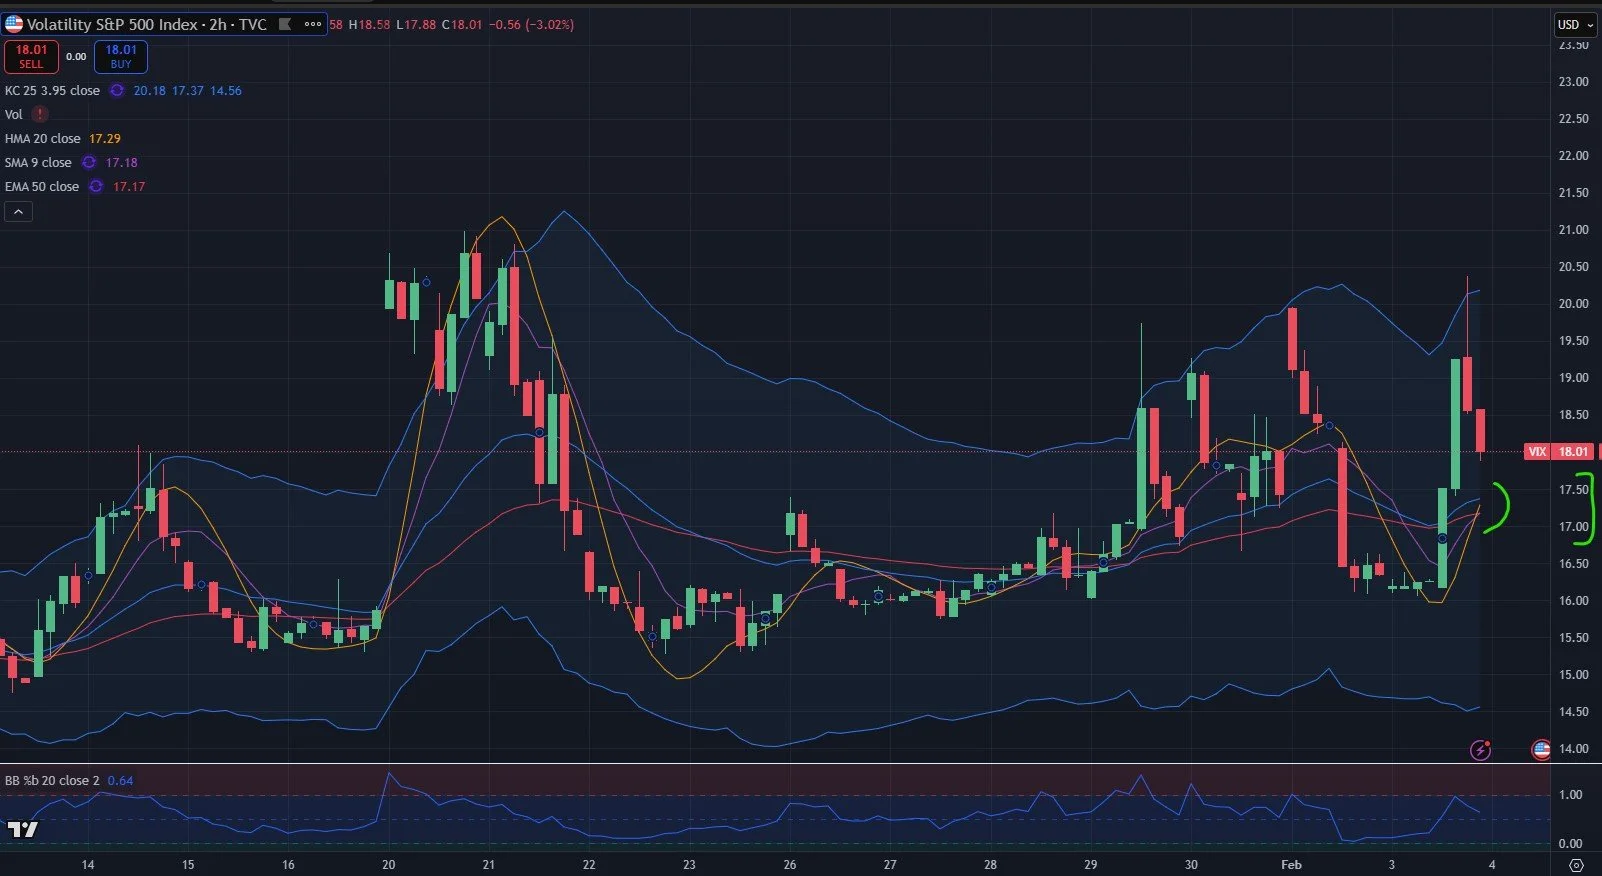
Zooming in, we see the 2-hour chart reflecting multiple indicators clustered around the 17.20-17.30 area, which is a first stop to the downside that I’ll be watching for potential reversal back up for the VIX.
The VIX is looking like it has a shot at 25 if it can hold a test of the 16.5-17.3 area, to combine the levels on our daily and 2-hour charts. An immediate move higher for the VIX is possible as well, so we’ll plan to react to the initial move in Wednesday’s cash session.
We’ll take a look at the 0 DTE picture in the morning and share our observations in Discord, so we hope you’ll join us!
To enter Discord as a non-subscriber, go to our homepage and click on Community to enter our Discord server! First-time guests receive a free 7-day trial of the premium Discord channels and this is where we discuss what’s happening in real-time.
We also have a live stream accessible from our homepage every day around 10:30am ET, so feel free to join us there.
We are currently offering an annual discount for the Portfolio Manager subscription, so check out the first paragraph of this newsletter for more info!
Thanks for being part of our community and know that we invite and appreciate your feedback!
The information provided by Geeks of Finance LLC is for educational purposes only and is not intended to be, nor should be construed as, an offer, recommendation or solicitation to buy or sell any security or instrument or to participate in any transaction or activity. Please view our Investment Adviser Disclaimer and Risk Disclosure.