
VIX Holding Support, IWM Looks Bullish? February 27 Stock Market Preview
Our $300 discount off of the annual Portfolio Manager subscription will end this week, enter code WINTER2026 at checkout!
We are back to our YouTube videos, and tomorrow we plan to have the livestream at 10:30am ET as well. Tonight’s video covers , you can view it by clicking Community at the top of our homepage to find the link to our YouTube channel!
Today went largely as anticipated when considering the points made in last night’s newsletter: The bullish rebound in SPX and QQQ appeared to be a bit stretched, and sure enough, we got the drop today, testing the levels mentioned as key support and holding those levels (for now).
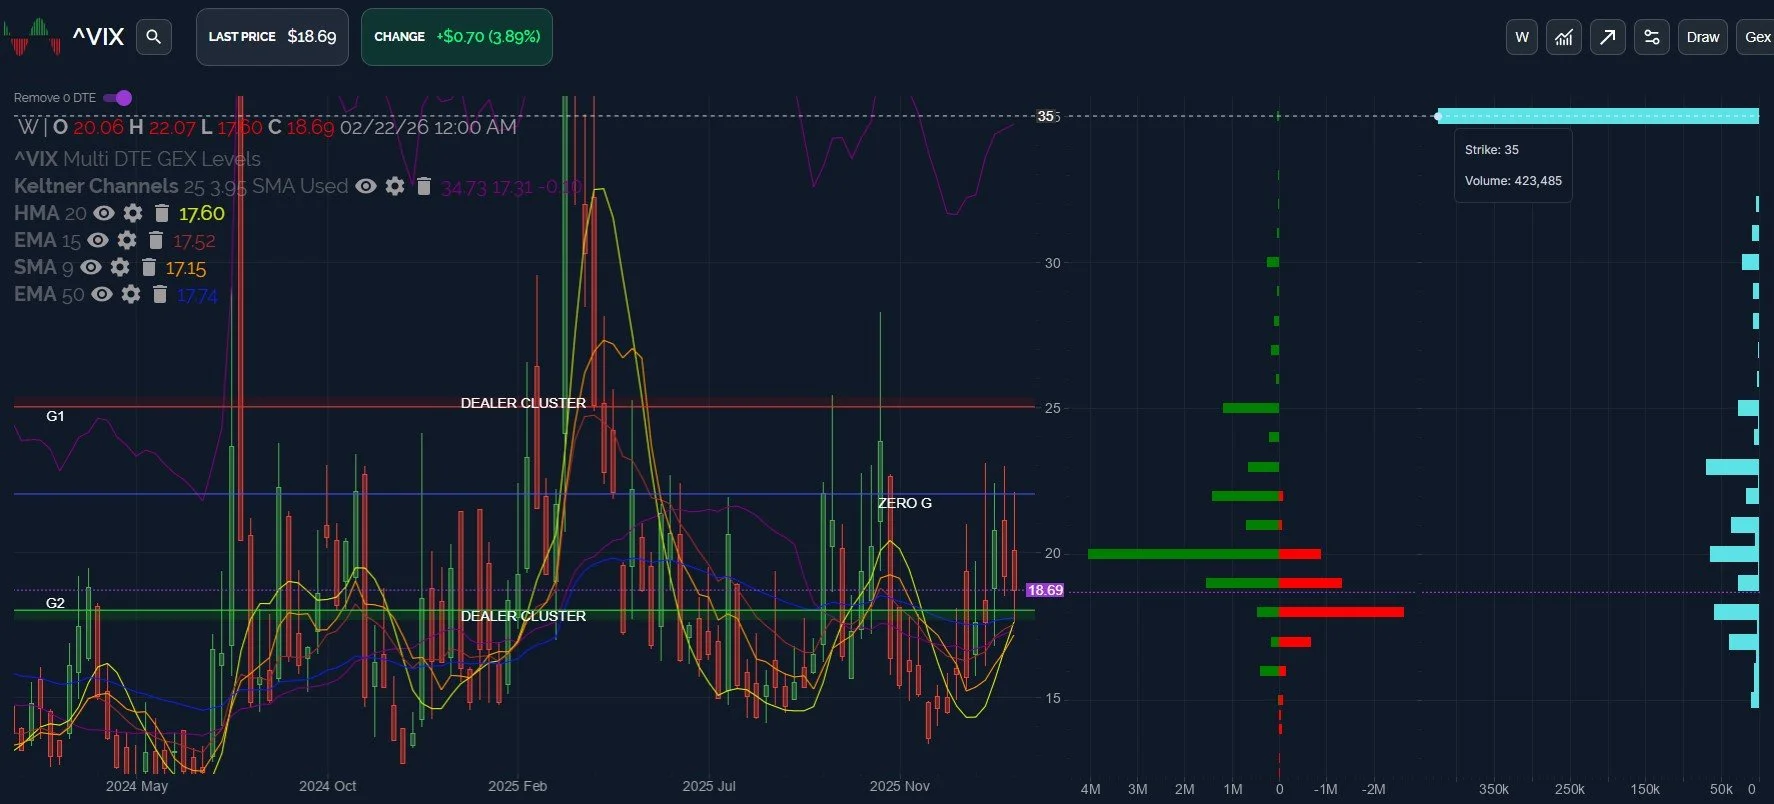
We also saw the VIX finally test the HMA and 9 SMA on the weekly chart, just below the daily 50 EMA.
Given the importance of this area in maintaining an uptrend for the VIX, it’s not surprising that we saw a very strong reaction, sending the VIX to just over 20.
The failure over 20 is interesting though, especially given the lower high that we’ve seen this week for the VIX. Are we seeing the early signs of a reversal to a breaking of the uptrend for the VIX, with accompanying lower VIX levels? The intraday volatility may be reflecting the recognition by participants of time being up to decide which way the market is going to go.
Note the very high VIX volume at the 35 strike, with a lot of that volume concentrated on the March 18 expiration.
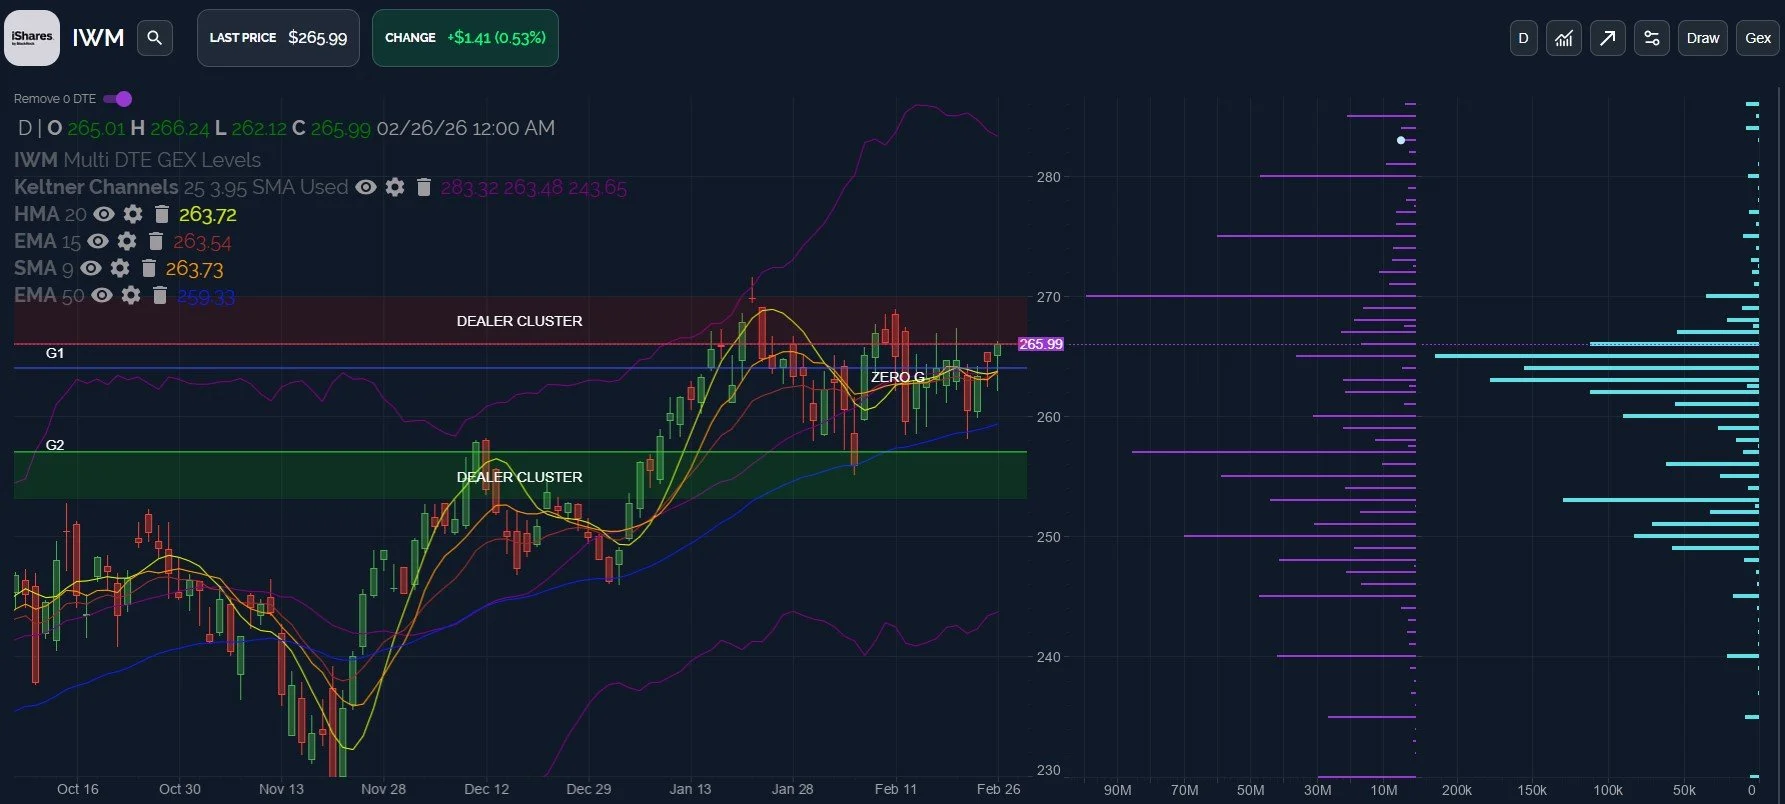
IWM started out showing relative weakness, leading the other indices lower, but then a powerful reversal occurred, with IWM closing near the highs of the day. Other indices followed, or at least reversed notably off of lows.
Today’s close also marked the 2nd day that IWM closed above the 15 EMA, the HMA, and the 9 SMA.
The long tail and closing above key support on the daily chart looks bullish to me, and the upper Dealer Cluster zone and large positive GEX cluster at 270 is certainly a possible target if we see continuation higher. Does the VIX suggest that such a bounce in markets would be short-lived? This is the question that I have, and I’ll be watching for additional clues in coming days.
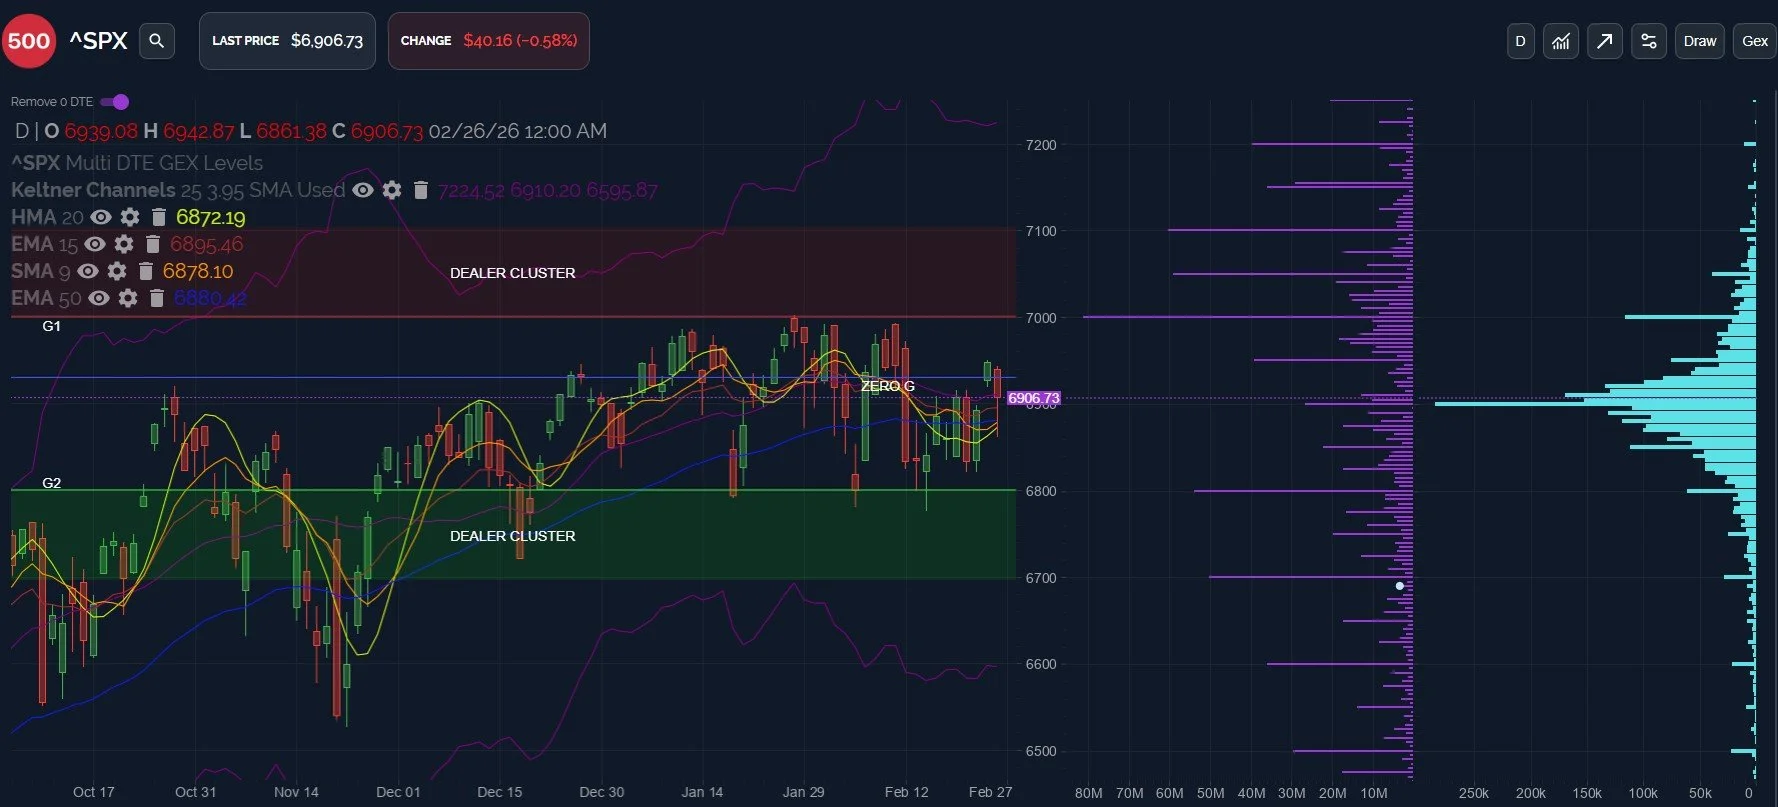
SPX reached a low of 6861 intraday, testing the confluence of the HMA, 15 EMA, and 9 SMA before bouncing, leaving a long tail, despite closing with a red candle. Overall, my opinion is that the action is positive, and we’ve seen accompanying improvement in the net GEX reading for SPX as well. Continuation higher targets the 7000 strike and the upper Dealer Cluster zone.
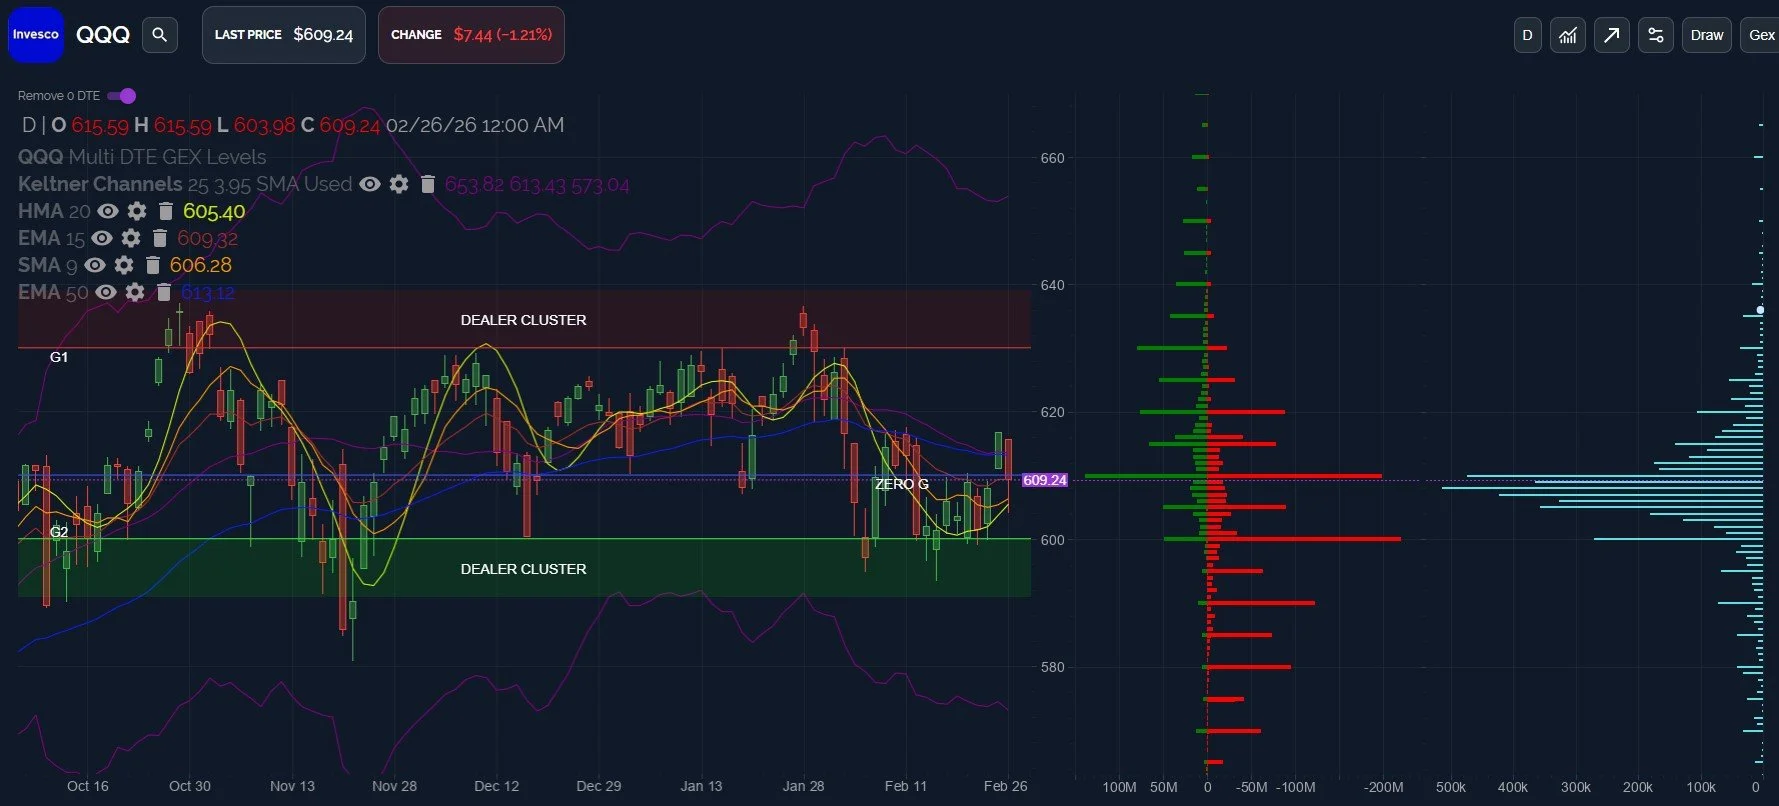
QQQ saw a similar move- a decline that tested the HMA, 15 EMA, and the 9 SMA, with the biggest difference being that QQQ closed below the 15 EMA. The relatively less bullish close is not a surprise given QQQ’s performance since October, but I still give more credence to holding above the HMA and 9 SMA, combined with the improvement in the GEX picture and those moving averages turning higher.
620-630 are possible upside targets once 610 is regained, with the usual suspects below, from 580-600 if we lose 605.
With our livestream likely resuming Friday, we invite you to join us for our view of where markets are sitting at the moment, and we’ll post in Discord as well.
We hope you’ll join us in Discord tomorrow where we will take a look at 0 DTE data for the indices.
To enter Discord as a non-subscriber, go to our homepage and click on Community to enter our Discord server! First-time guests receive a free 7-day trial of the premium Discord channels and this is where we discuss what’s happening in real-time.
The livestream is accessible from our homepage every day around 10:30am ET, so feel free to join us there. You can also listen to our most recent livestream anytime before the next day’s livestream occurs.
We are currently offering an annual discount for the Portfolio Manager subscription, so check out the first paragraph of this newsletter for more info!
Thanks for being part of our community and know that we invite and appreciate your feedback!
The information provided by Geeks of Finance LLC is for educational purposes only and is not intended to be, nor should be construed as, an offer, recommendation or solicitation to buy or sell any security or instrument or to participate in any transaction or activity. Please view our Investment Adviser Disclaimer andRisk Disclosure.