
NVDA Earnings Are Out: What’s Next? February 26 Stock Market Preview
Our $300 discount off of the annual Portfolio Manager subscription will end this week, enter code WINTER2026 at checkout!
We didn’t post a YouTube video tonight due to vocal cord issues encountered while yelling at a chart on the computer screen (just kidding as far as the cause), but you can check out our playlists or previous daily videos by clicking Community at the top of our homepage to find the link to our YouTube channel!
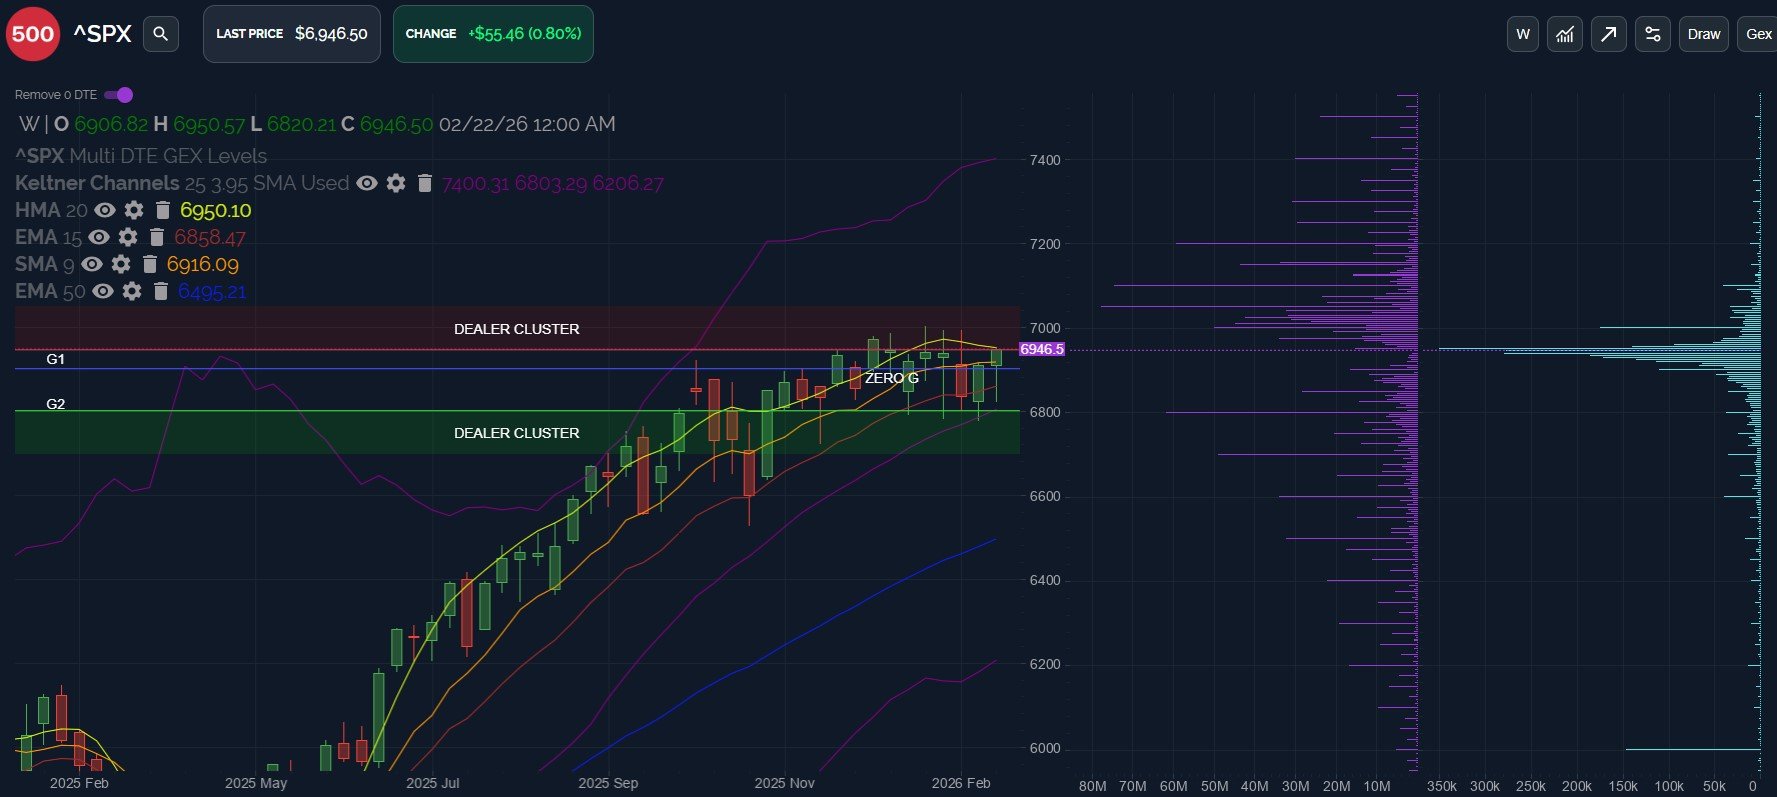
Let’s check in with the SPX weekly chart: We finally saw SPX test the 6950 mark, which today represents the slightly declining HMA, closing just below that resistance point. This was an upside target mentioned for several days, if SPX was able to retake 6900.
Net GEX has moved more positively, with 7050 and 7100 now prominently in focus going forward. I view this as a notable shift to the positive, though not necessarily indicative of a rally to those levels in the very short term.
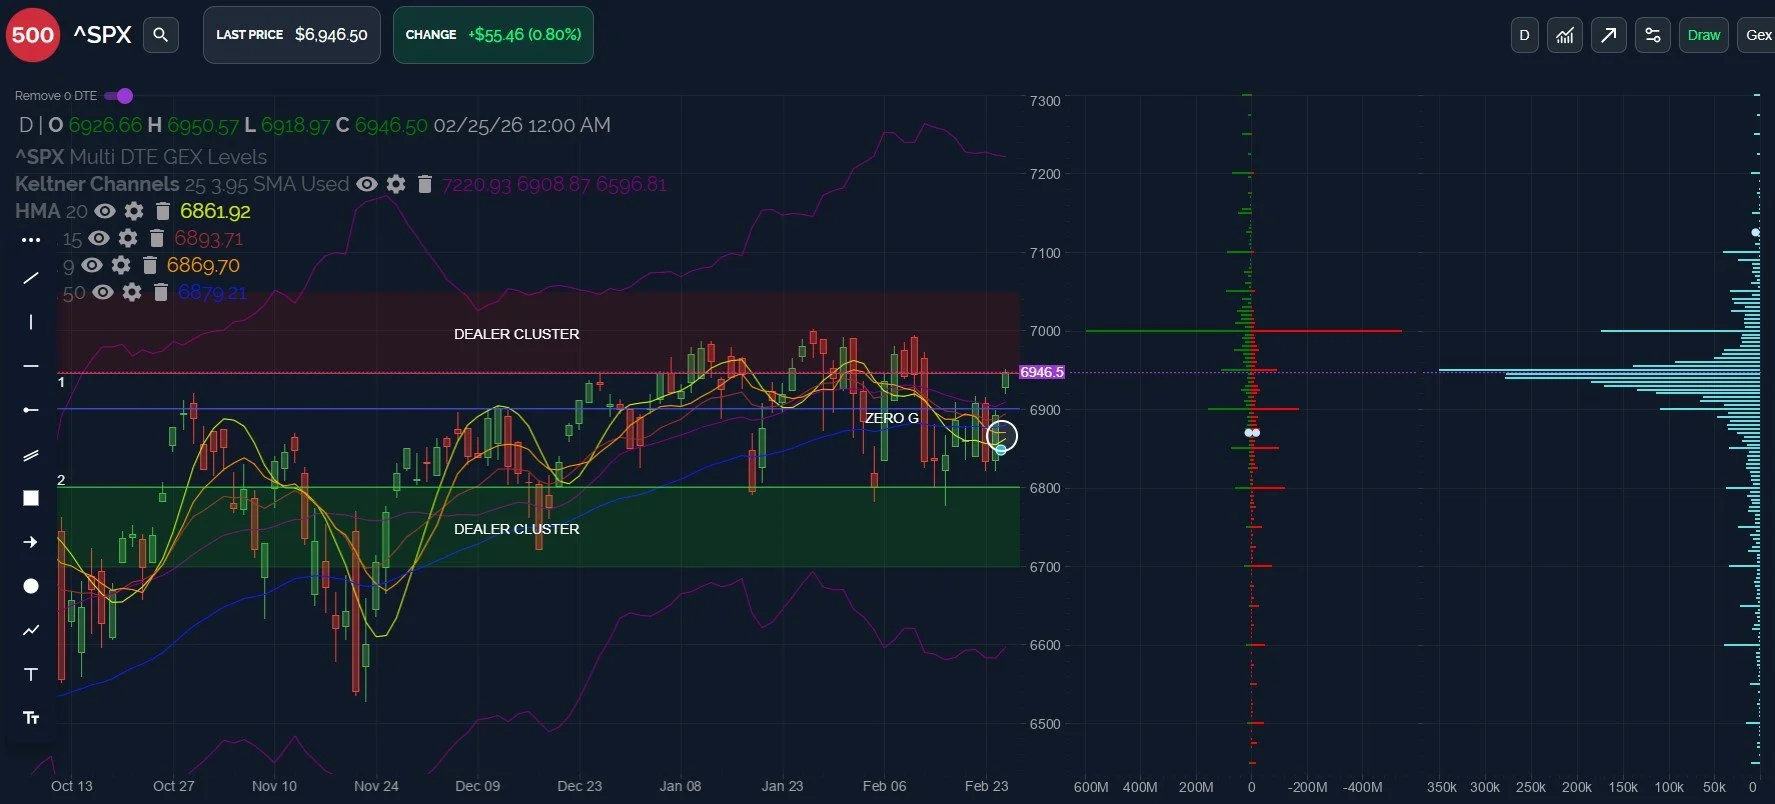
Zooming in to the daily chart, and changing GEX displayed from net GEX to gross, we see a different picture that adds some nuance to what the weekly picture and net GEX show (not that those two settings have to go together on our website).
We see the huge overall GEX position at 7000, suggesting capped upside until a defining close above 7000 that sustains above 7000 for more than a day.
We also see the total GEX picture indicating that we’re in the upper Dealer Cluster zone on both charts, which represents an area where we expect dealers to potentially become sellers, accompanying a price decline or a move sideways (in stronger scenarios). A shift in GEX would obviously imply a shift in expectations in terms of what happens at 7000-7050.
Lastly, the daily chart shows SPX’s price to be extended quite far above the confluence of the HMA and 9 SMA, so mean reversion would not be surprising. A move lower that holds a retest of the 6860-70 area is still constructive, in my view.
In summary, I believe the burden is on the bulls to decisively overcome 6950, opening the door to 7000-7050, potentially. Otherwise, we have weekly resistance at 6950 holding so far, and the daily chart showing extension and a gap between 6870 and today’s close, implying reasonable odds of an 80-90 point drop, in my view. This would still maintain potential for continuation higher.
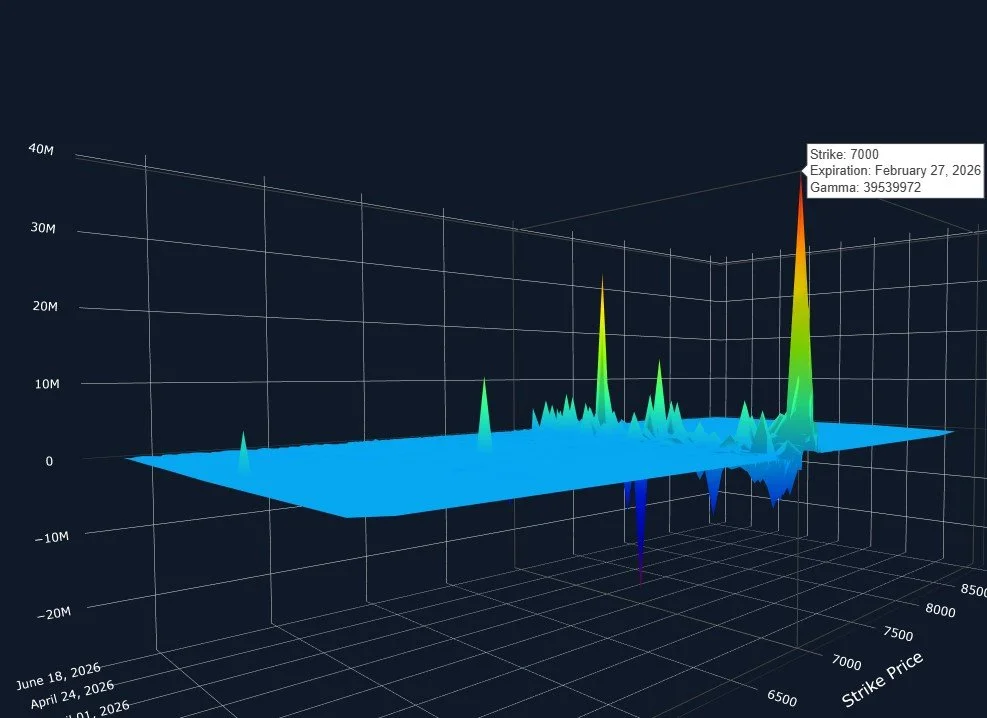
The largest net GEX cluster for SPX expiring Friday is at 7000, so will we see the upside path chosen in the short term?
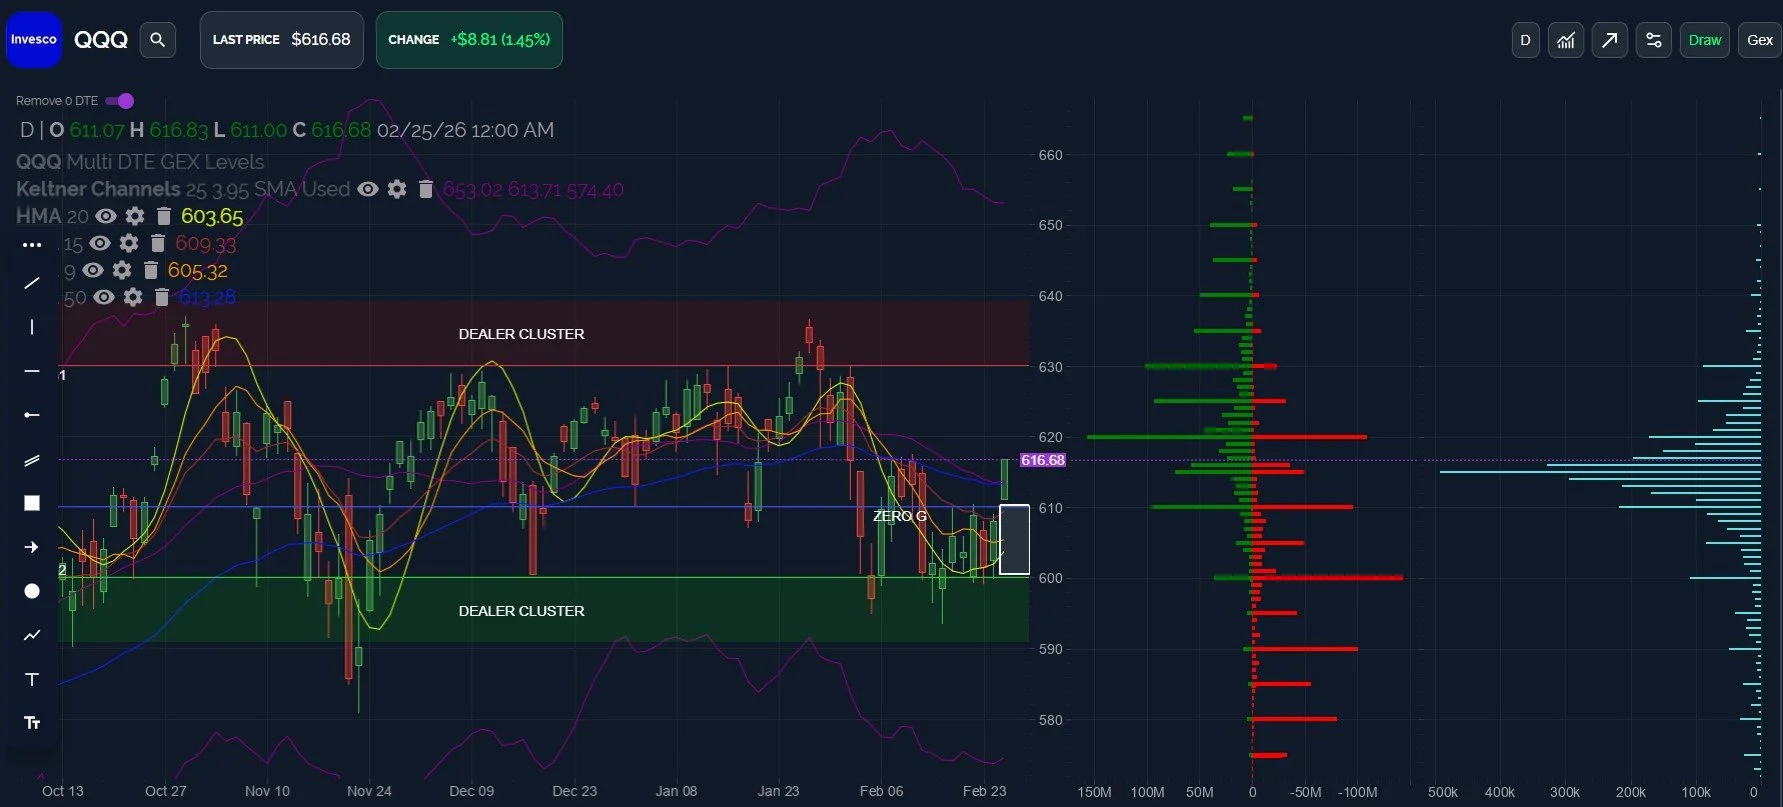
QQQ looks more constructive compared to the recent past, coinciding with our comments on IGV yesterday.
That said, in the very short term, QQQ’s price is getting a bit stretched above the HMA and 9 SMA compared to the recent past.
A pullback may happen, but as long as 604-605 holds, we can see continuation higher, and confirmation that the retests at 600 were meaningful in confirming new highs.
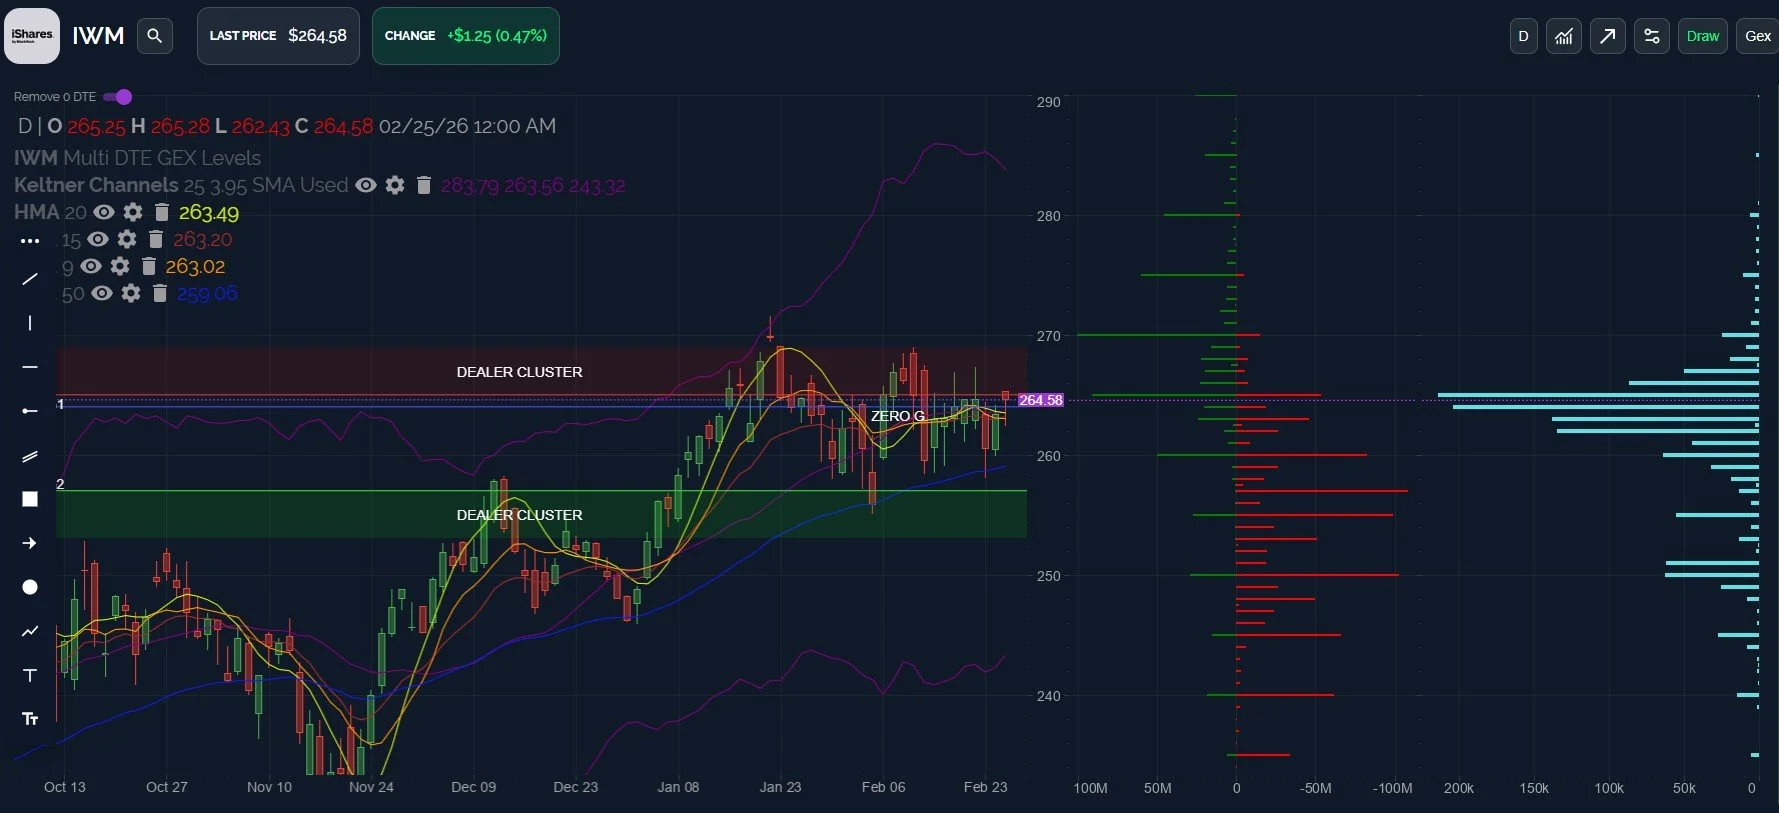
IWM was initially looking quite negative, with a positive open fading into a selloff.
The dip into the HMA and 9 SMA on the daily chart was bought, leaving us a candle wick and a close above key moving averages by the days end.
GEX continues to point toward a 270 tag as long as 260 holds as daily support, in my view.
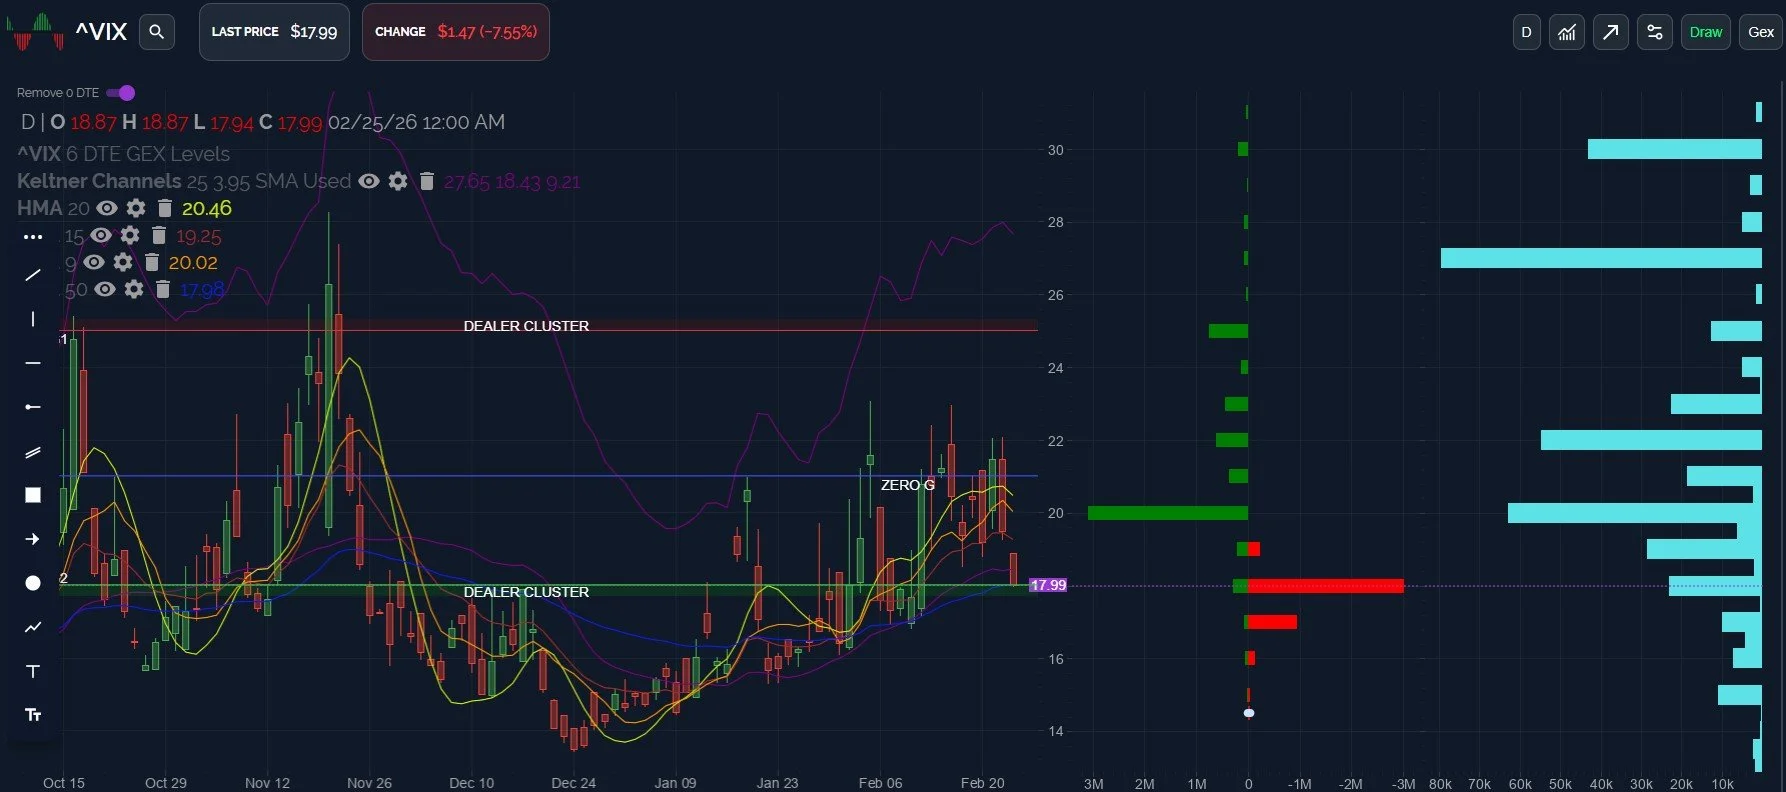
Lastly, the VIX is testing the daily 50 EMA. closing almost right at the line.
Volatility bulls want to see the trend higher for the VIX continue, necessitating a turn relatively soon to head toward the 25 strike or higher.
The weekly chart shows 17.50 to be the “bottom line” for the VIX, so we will be watching the indices and the daily close for the VIX to see if the VIX justifies a sustainable market rebound from recent lows or not.
We hope you’ll join us in Discord tomorrow where we will take a look at 0 DTE data for the indices.
To enter Discord as a non-subscriber, go to our homepage and click on Community to enter our Discord server! First-time guests receive a free 7-day trial of the premium Discord channels and this is where we discuss what’s happening in real-time.
The livestream is accessible from our homepage every day around 10:30am ET, so feel free to join us there. You can also listen to our most recent livestream anytime before the next day’s livestream occurs.
We are currently offering an annual discount for the Portfolio Manager subscription, so check out the first paragraph of this newsletter for more info!
Thanks for being part of our community and know that we invite and appreciate your feedback!
The information provided by Geeks of Finance LLC is for educational purposes only and is not intended to be, nor should be construed as, an offer, recommendation or solicitation to buy or sell any security or instrument or to participate in any transaction or activity. Please view our Investment Adviser Disclaimer andRisk Disclosure.