
The March OpEx Cycle Begins: February 23 Stock Market Preview
Our $300 discount off of the annual Portfolio Manager subscription will end in 3 days, enter code WINTER2026 at checkout!
Tonight’s YouTube video discusses SPX, QQQ, BTC, GLD, and NVDA, so check it out by clicking Community at the top of our homepage to find the link to our YouTube channel!
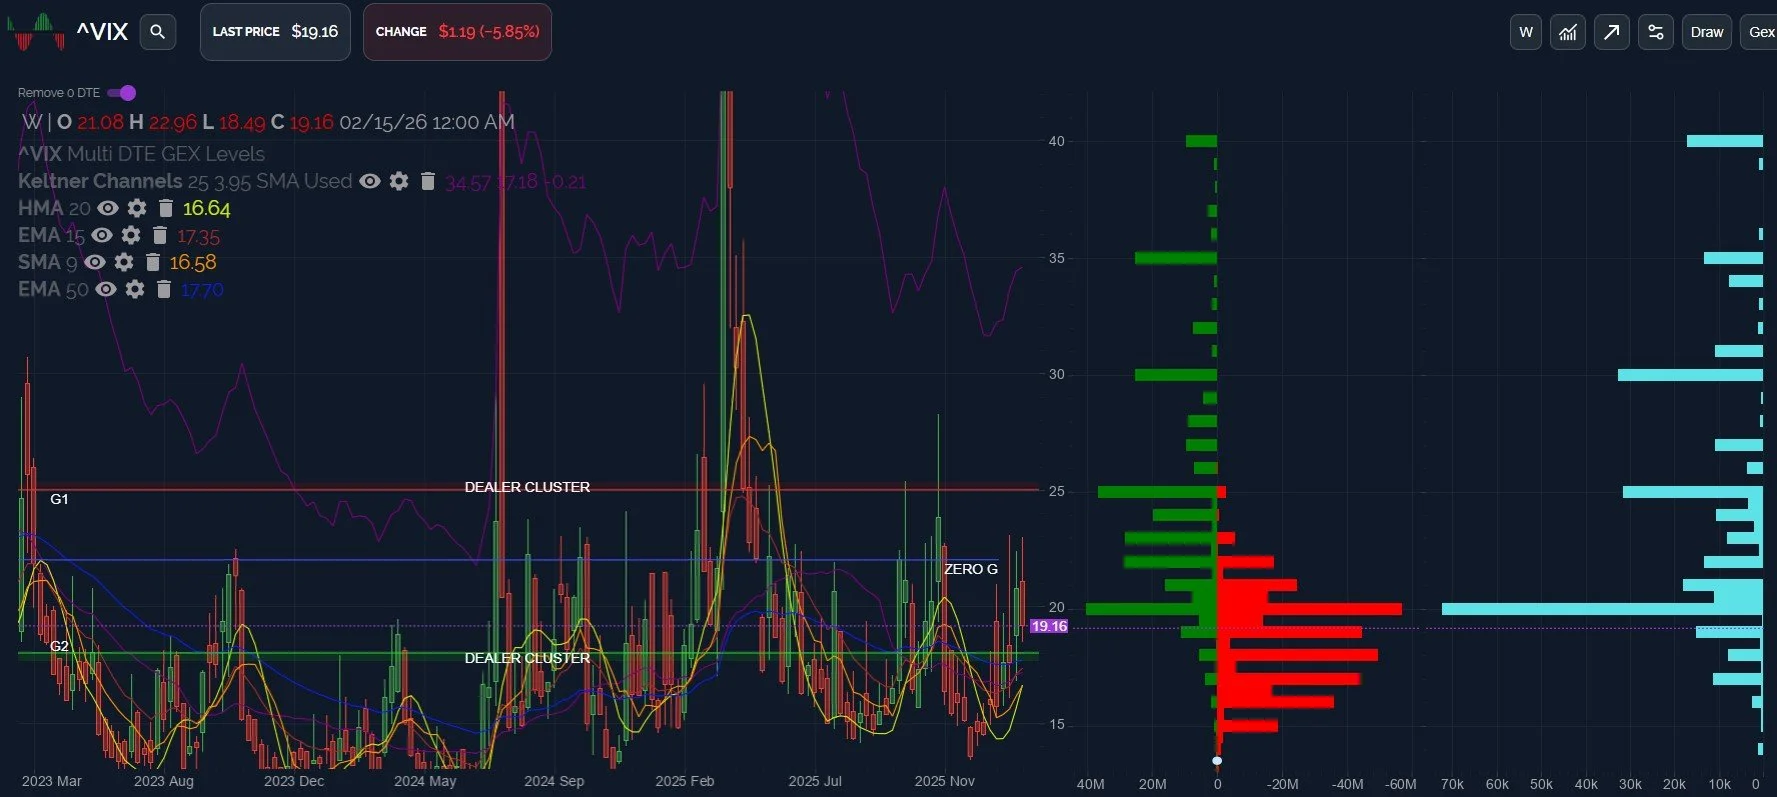
Let’s start out with a quick look at the VIX weekly chart, remembering our previous observation that many of the recent instances showing a curling up of the HMA and 9 SMA also saw the VIX culminating in a larger spike several weeks later.
We’re barely 3 weeks into the recent turn, so we can see the VIX continue higher, even considering only recent history.
Other important factors: We’re in a positive GEX environment for the VIX, which we view as favoring “buy the dip” for volatility, with 25 as the largest net positive GEX cluster.
While 25 is the largest net cluster, 20 appears to be important due to large positive and negative gross GEX, so the VIX holding above 20 increases the odds of 25+ being reached.
Technically, a retest of the 17 area on the VIX appears important on the weekly chart, matching the confluence of multiple moving averages. The daily chart also introduces 18 as a possible pivot. So the VIX holding 17-18 maintains potential for volatility bulls to exert influence toward a move higher, while losing VIX 17 increases the odds of a VIX breakdown to the 13-15 range.
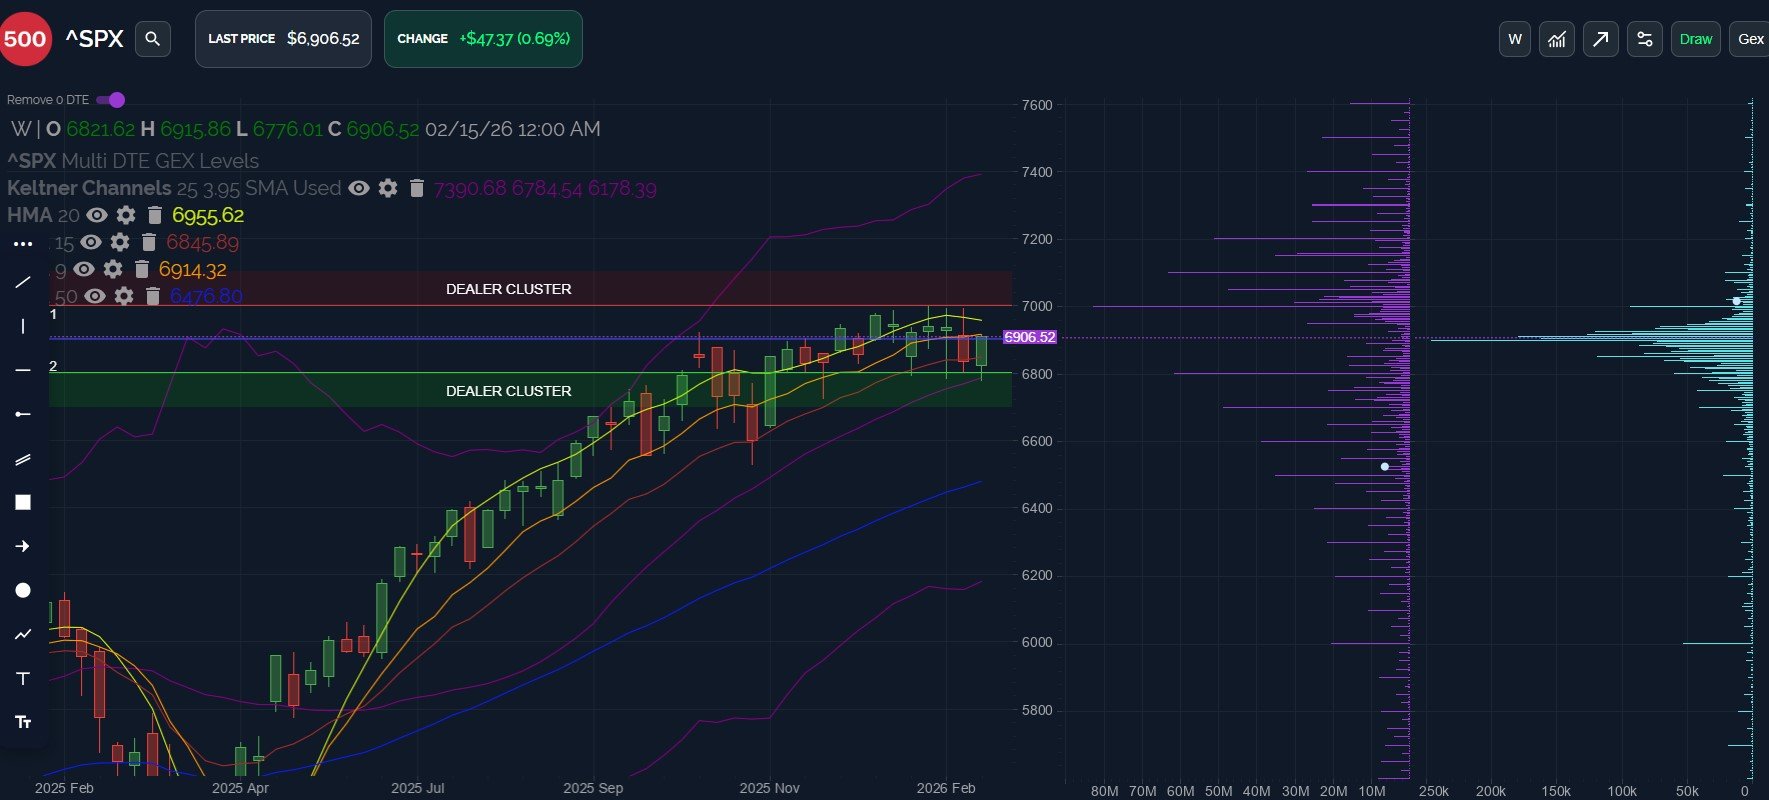
We noted the importance of the 15 EMA since April 2025, and sure enough, the nail-biter close 2 weeks ago near the 15 EMA was met with a rebound last week, testing the 9 SMA at 6914, but closing just below.
Rejection from the 9 SMA opens the door for a retest of the 15 EMA at 6845, or potentially down to the middle Keltner channel at 6784.54.
We see large GEX clusters on SPX at 6800 and 6850, both very close to those technical indicators, so we want to watch those zones within 15 points or so for signs of support (or lack thereof).
Upside targets have been consistent at 6950-7000, matching closely with the HMA at 6955 and the previous all-time high at 7002.28. A daily close above the 6955.62 HMA ( or even better, the prior high at 7002.28) raises the odds of new highs, potentially toward the big GEX clusters at 7100--7200.
Given the close on Friday right between the 6900-6914 range mentioned, let’s see what the 0 DTE picture reveals as we enter the cash session Monday.
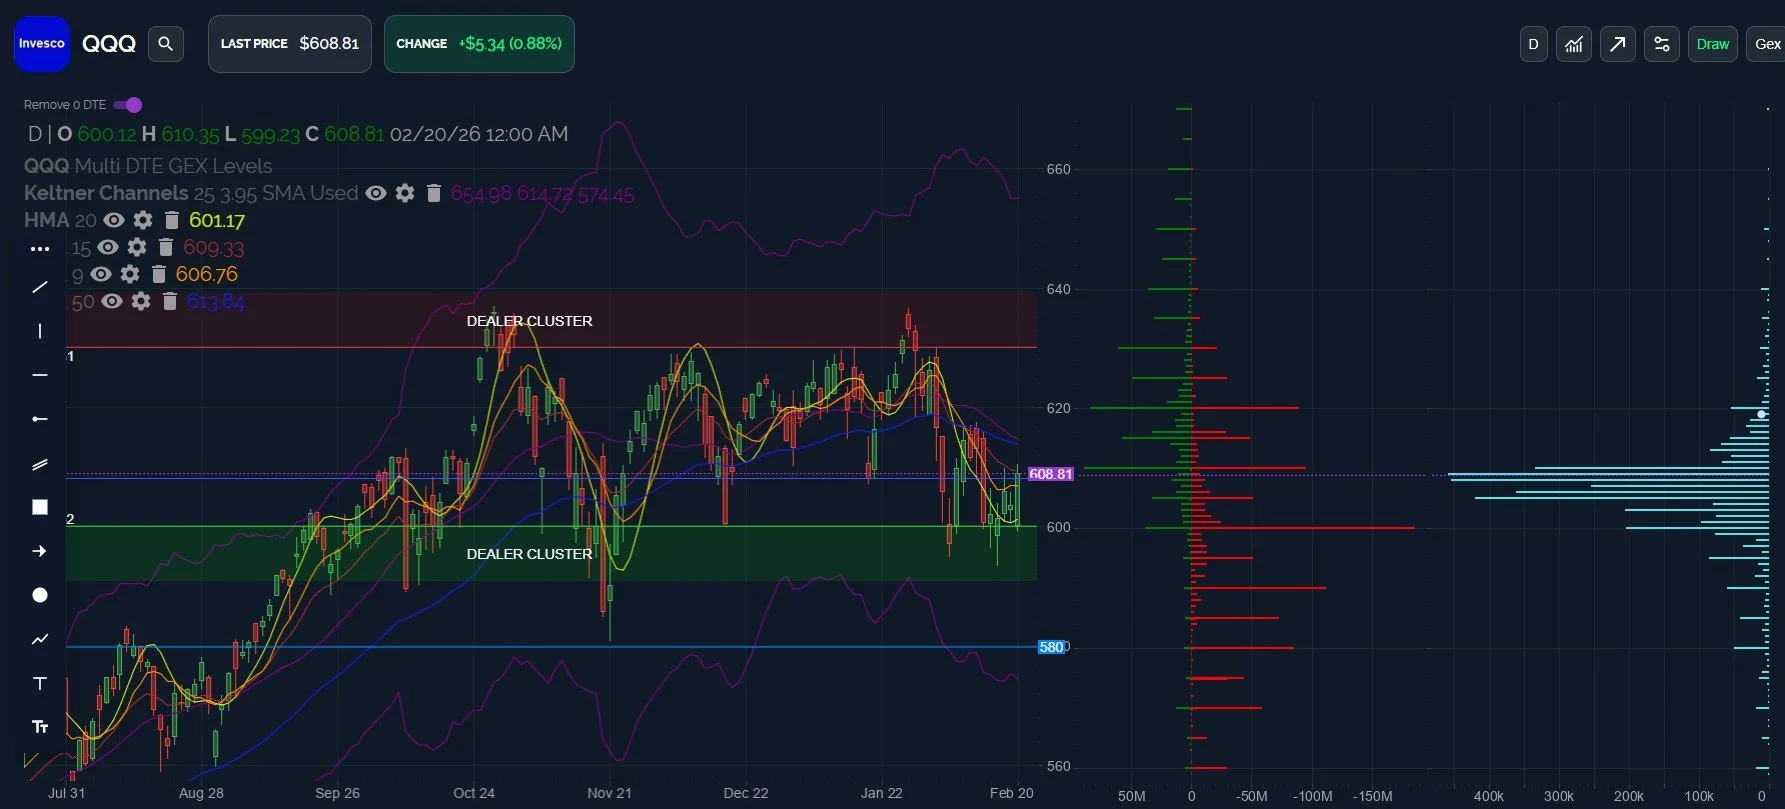
QQQ is in the early stages of even suggesting a possible bottom given its weaker showing since the late January high.
The daily chart reveals rejection at the key 610 resistance (as of Friday), yet a possible upside move toward 620-630, based on GEX and technical indicators.
As far as downside goes, 600 is still the key to potential downside/upside scenarios playing out, given the large GEX concentration at that strike. A daily close below 600 brings 680-690 into focus, while a close beyond 610 brings 620-630 into focus (620 looks like a potential ceiling in the short term, based on GEX).
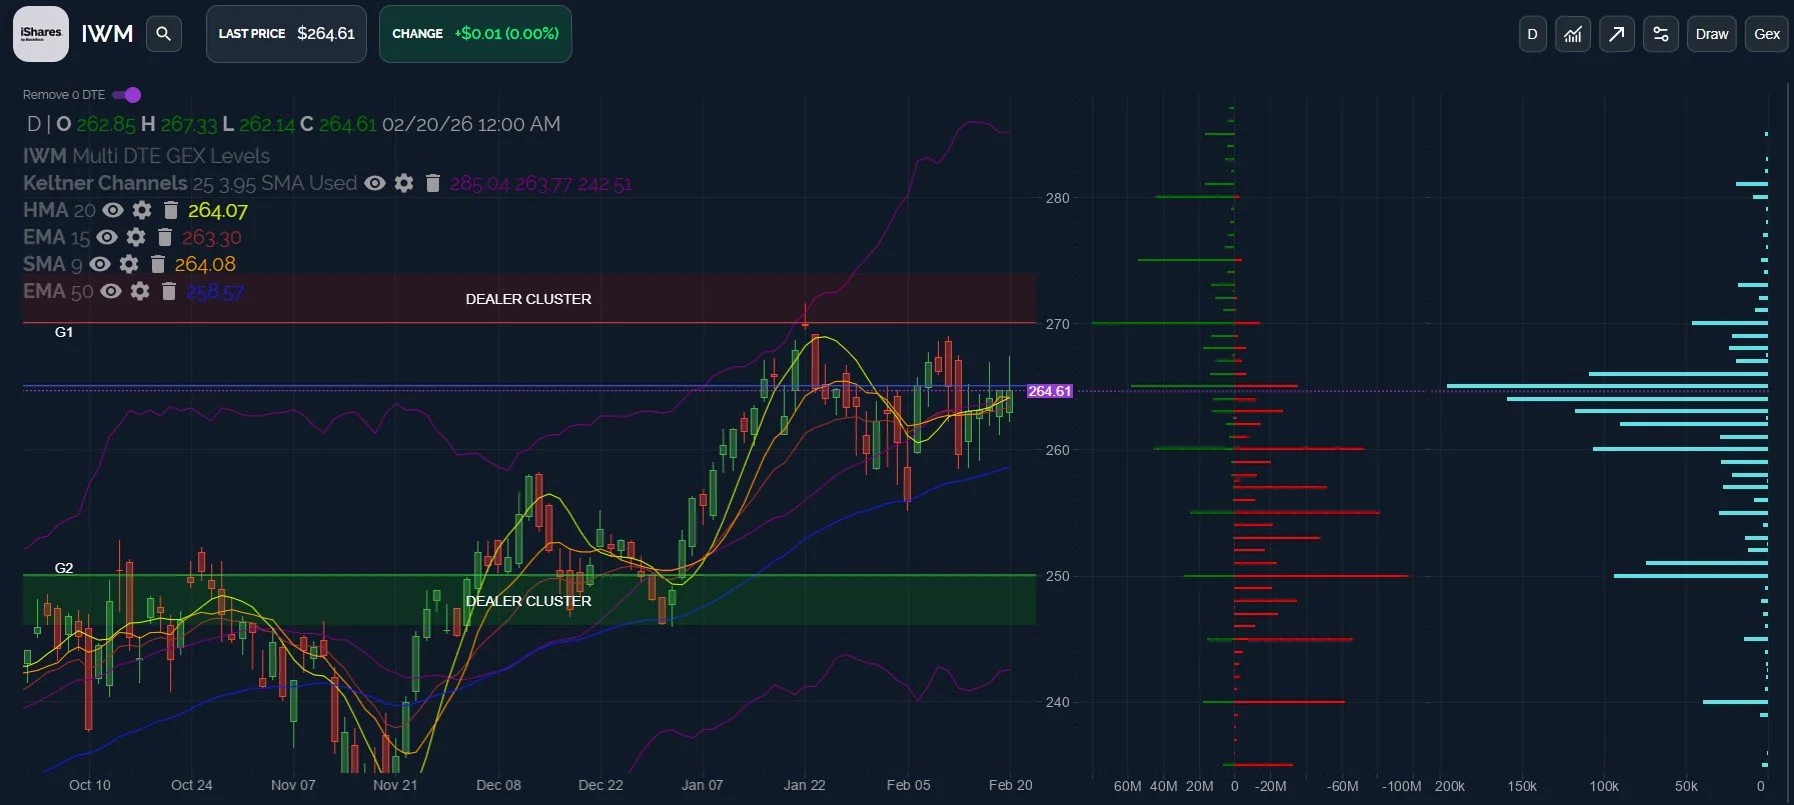
IWM presents a bit of a conundrum- apparently bullish on technicals, but GEX is overall negative, with 250 remaining as a “sticky” lower Dealer Cluster zone.
The Keltners look bullish, and as long as 260 holds as daily support, 270-285 is entirely possible, if not probable.
IWM’s price has been tightly hugging the HMA and 9 SMA for days.
A lower breach of 260 or a breach of 270 is worth watching closely, otherwise, welcome to the “chop zone” between the two.
We’ll share some of our observations in our free Discord channel tomorrow, and we hope you’ll join us!
To enter Discord as a non-subscriber, go to our homepage and click on Community to enter our Discord server! First-time guests receive a free 7-day trial of the premium Discord channels and this is where we discuss what’s happening in real-time.
We also have a live stream accessible from our homepage every day around 10:30am ET, so feel free to join us there. You can also listen to our most recent livestream anytime before the next day’s livestream occurs.
We are currently offering an annual discount for the Portfolio Manager subscription, so check out the first paragraph of this newsletter for more info!
Thanks for being part of our community and know that we invite and appreciate your feedback!
The information provided by Geeks of Finance LLC is for educational purposes only and is not intended to be, nor should be construed as, an offer, recommendation or solicitation to buy or sell any security or instrument or to participate in any transaction or activity. Please view our Investment Adviser Disclaimer and Risk Disclosure.