
OpEx Is Over: “Party Time” With The VIX In The 14s December 22nd?
You can still get $300 off of the annual Portfolio Manager subscription for a few more days, enter code HOLIDAYS2025 at checkout!
You can view today’s YouTube video here. We take a look at SPX (including a new income strategy we rolled out utilizing SPX), the VIX, BTC, NVDA, and PLTR, so check it out if you have a few short minutes!
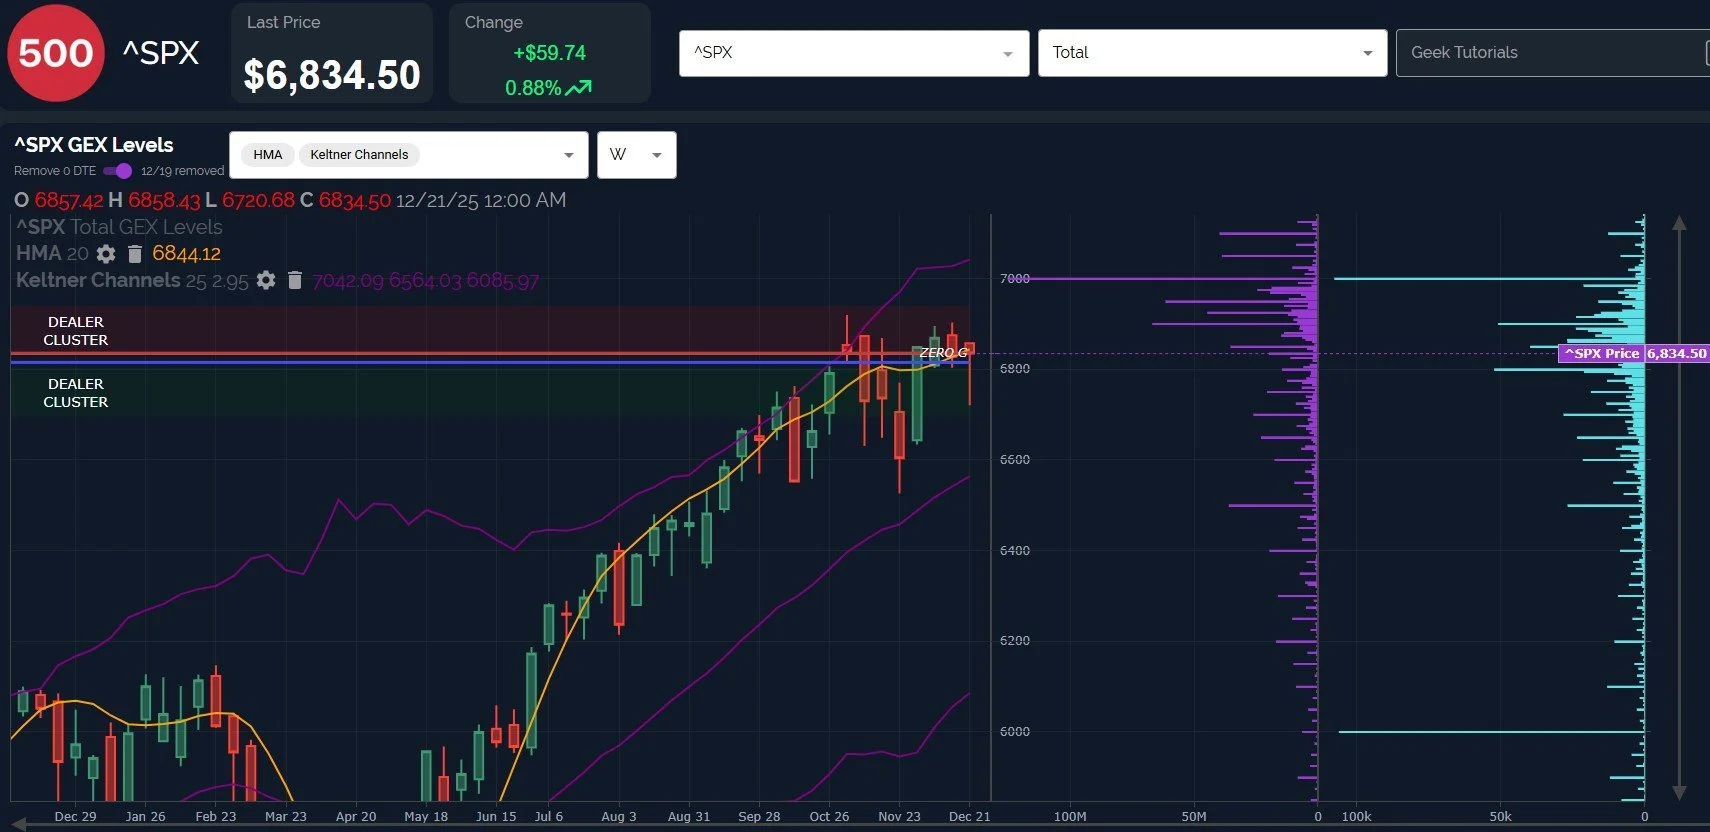
Let’s start with the SPX weekly chart, which shows a largely sideways consolidation since October, though the Keltner channels continue reflecting a higher bias.
SPX left a long tail for OpEx, closing just below the 6844 weekly Hull Moving Average, adding conflicting indicator signals.
GEX saw some shifts last week in terms of the SPX 7000 GEX (depending on the day), but by the end of the week, we were left with SPX 7000 continuing to reflect the largest net positive GEX cluster and a valid upside target.
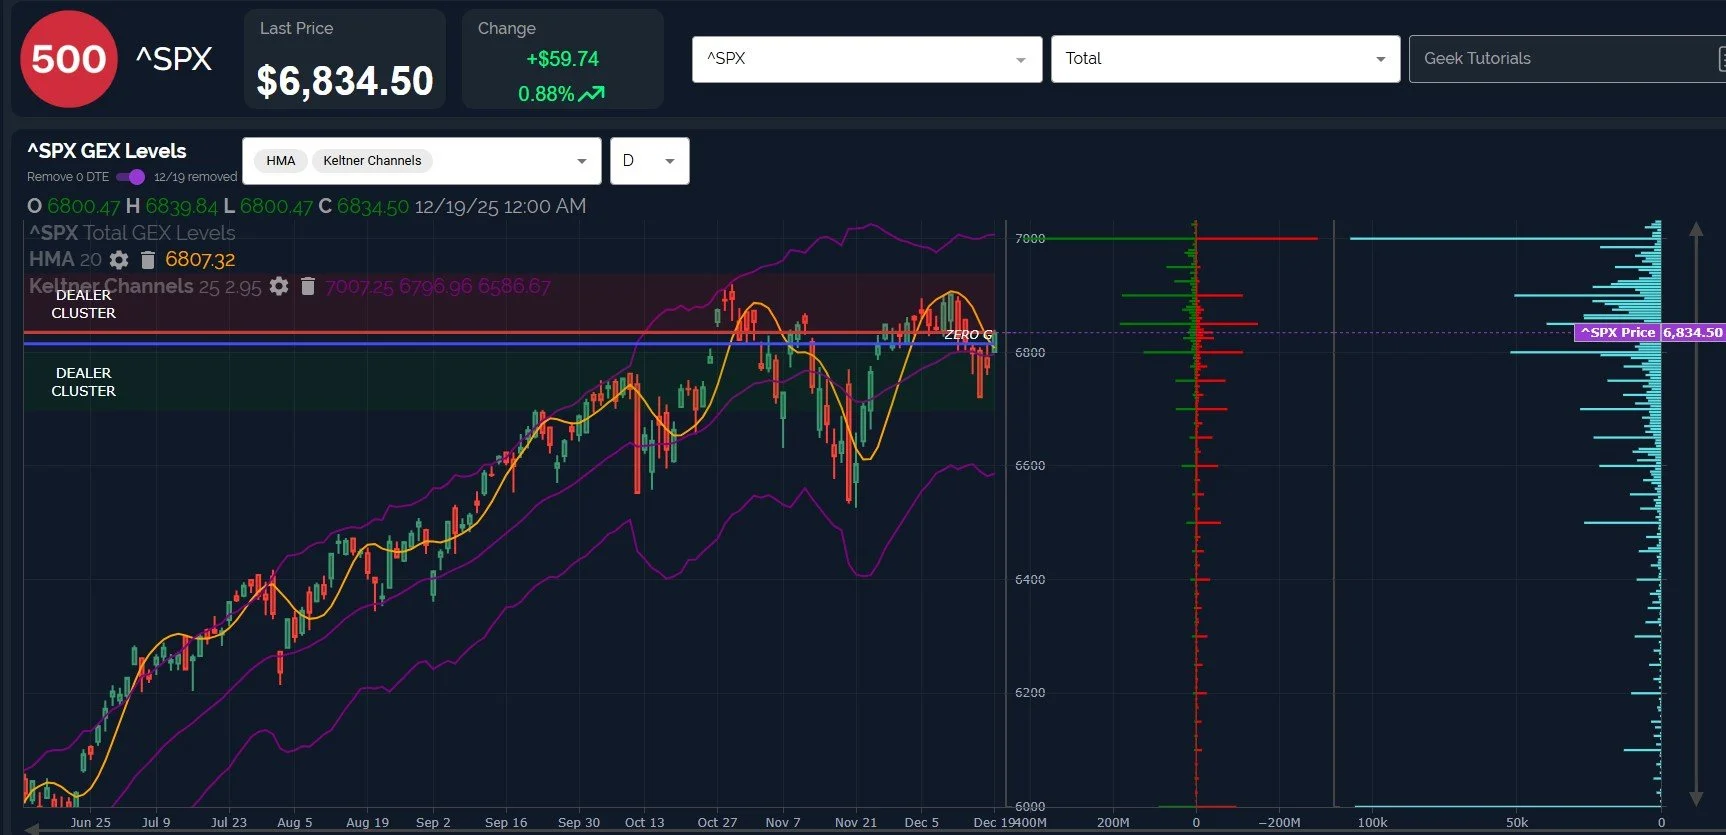
Switching to the gross GEX setting instead of net GEX, and zooming in to the daily chart, we see SPX recapturing the declining daily Hull (currently at 6807), a bullish sign on the surface.
However, the close at 6834.50, which is some 25 points away from the Hull, combined with the fact that the Hull is still declining, raises some doubt as to the micro pathway necessary to sustaining more upside.
Within the context of 7000 remaining as a valid upside target, we may see a pullback from the 6850-6875 area before continuing higher.
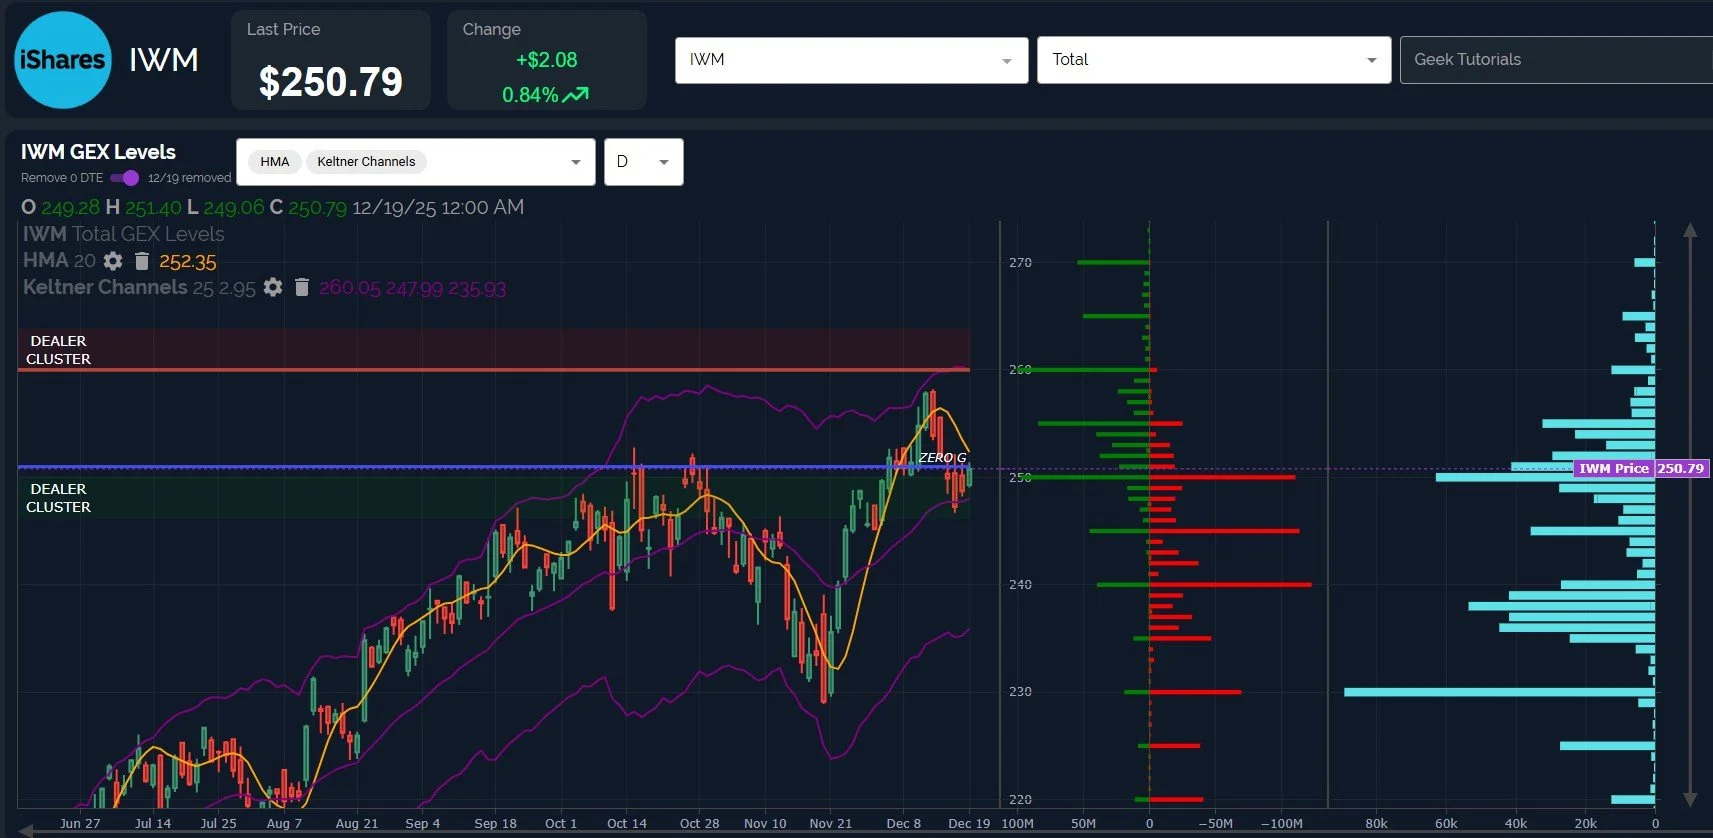
IWM’s daily chart also shows an immediate hurdle at the 252 area, the current location of the declining Hull.
That said, IWM’s picture still looks bullish on both the daily and weekly charts, and GEX justifies a move potentially to 270 upon capture of the 252 zone on a daily close.
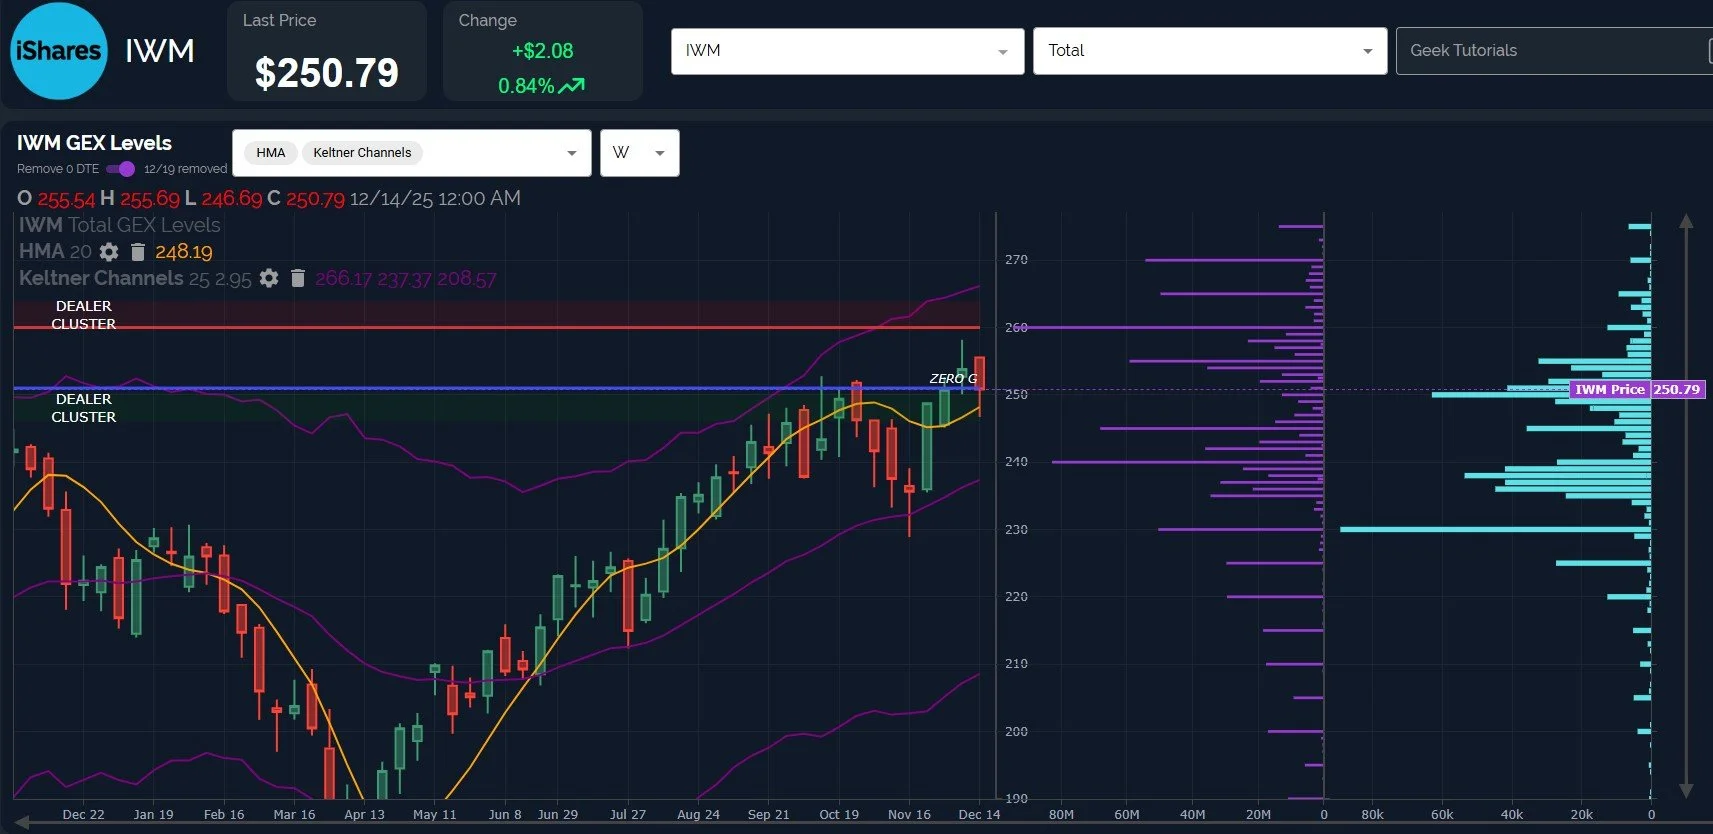
The weekly chart looks bullish as well, with the net GEX picture reflecting a move to 260 as likely and GEX appearing at 270 in more meaningful quantity than in weeks past.
Daily volume across all expirations at the 230 strike was elevated as of Friday, so we still need to be watchful for any break of 248, which may signal a downside move to 230 is in play. Until then, the odds appear tilted toward 260-270.
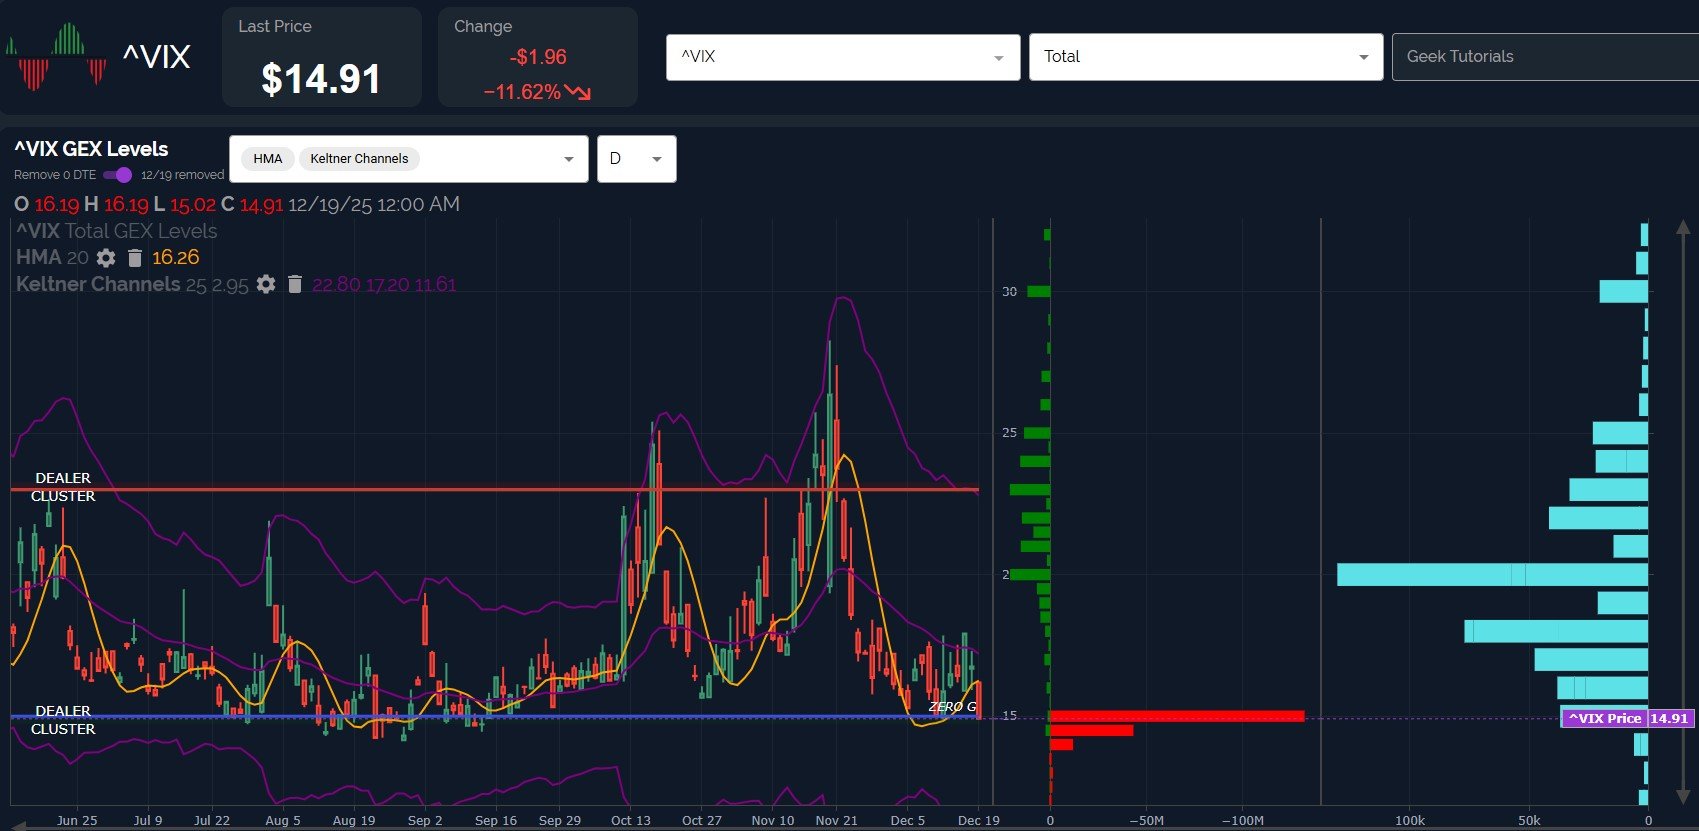
The VIX was a bottomless pit for call buyers Friday, plunging almost 12% to 14.91. Only a few hours earlier, we mentioned in Discord that 14-14.5 may be a downside target, though the VIX was seemingly quite distant from the target at the time we highlighted that zone.
With the Hull still rising, we have past occasions that suggest the VIX is likely to see some sort of upside in the next 1-3 days, and we are also quite extended below the Hull.
GEX continues to reflect very little attention toward VIX levels below 14.
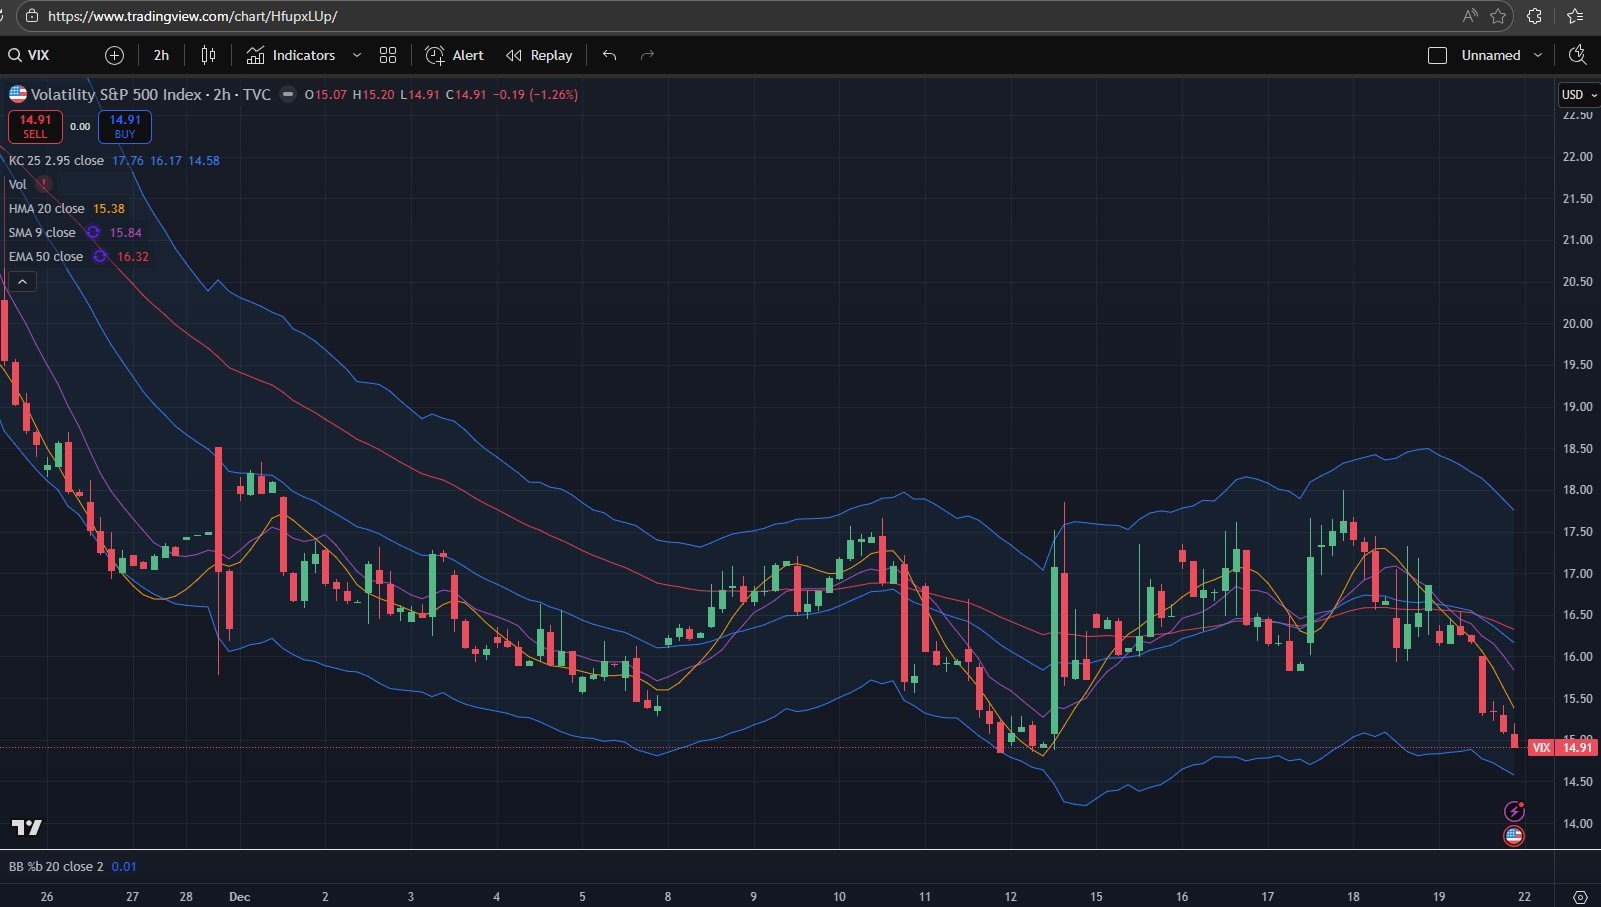
The 2-hour chart for the VIX also suggests a volatility bottom may be in soon, with the lower keltner at 14.58 potentially reflecting a solid downside target (and reversal area) for the VIX.
A quick look at the 2-hour chart shows the lower Keltner has been a good guide for short-term reversals.
tradingview.com
In closing, I pose this question to bulls: The VIX is at 14.91, essentially flat since 12/12. Meanwhile, SPX is still lower by almost 65 points. Do we consider this a positive VIX divergence compared to SPX (or a negative SPX divergence relative to the VIX, if you will)? How does this shift your bias? I think a positive resolution toward the 7000 GEX target is still possible, and perhaps probable, but we need to be aware of the risk of shorter term downside in the indices before achieving that goal.
Here’s the link to our Discord server if you haven’t yet joined us in Discord. First-time guests receive a free 7-day trial of the premium Discord channels.
You can join our discussion every day when we discuss markets in real-time via our Geeks Live livestream, now available to everyone for free via the homepage!
If you’re interested in accessing our tools and analytics, be sure to check out our website! We have a lot of updates in the works, and we have 2 primary membership tiers that you can read more about by clicking here: All About Our Memberships
If you’re interested in learning more about our strategy and approach, we address all of these topics in our Geek University course which is included in all memberships.
We posted a YouTube video today, and we have educational playlists, so give our channel a look if you’re curious about recent market commentary and ideas as well as gamma (GEX) concepts explained.
Thanks for being part of our community and know that we invite your feedback!
The information provided by Geeks of Finance LLC is for educational purposes only and is not intended to be, nor should be construed as, an offer, recommendation or solicitation to buy or sell any security or instrument or to participate in any transaction or activity. Please view our Investment Adviser Disclaimer and Risk Disclosure.