
SPX 7000 GEX Getting Shifty: December 19 Stock Market Preview
PORTFOLIO MANAGER ANNUAL SUBSCRIPTION PROMO- $300 off of the annual Portfolio Manager subscription, bringing your average cost per month below any of our monthly subscriptions! Enter code HOLIDAYS2025 at checkout! ENDING SOON!
You can view today’s YouTube video here. We take a look at SPX, IWM, GLD, UPS, and BTC, so check it out if you have a few minutes!
Indices at least get credit for “effort” today, though the mid-morning highs gave way to more of a neutral close by the days’ end.
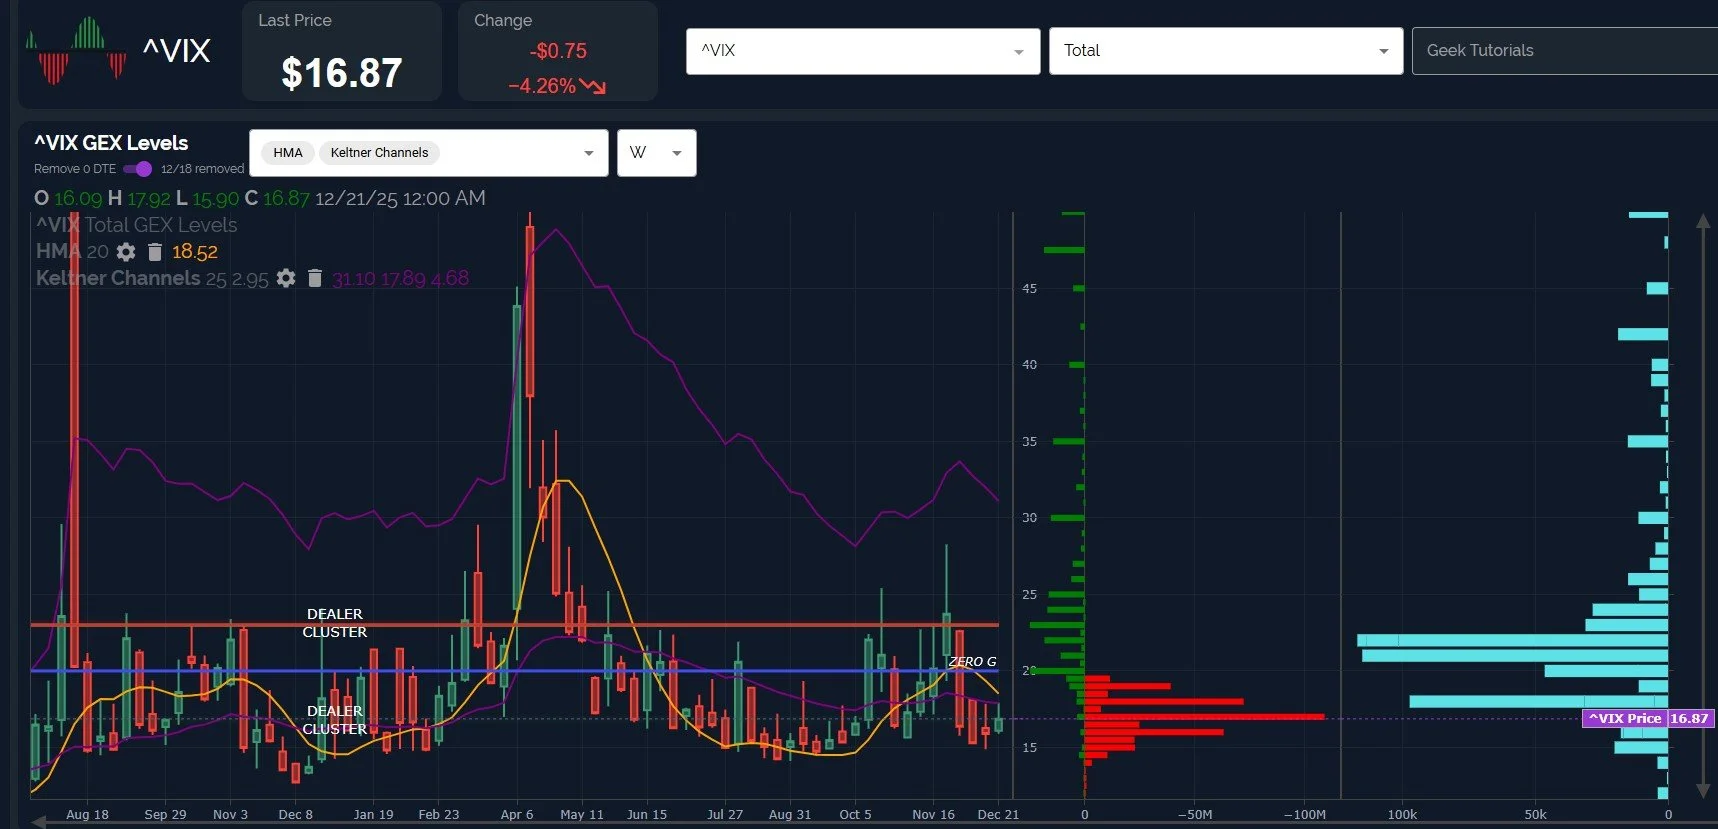
The VIX is still making higher lows, though the failure (so far) to overcome the declining weekly Hull still gives hope to bulls that we might see the VIX head back toward the lows of the year.
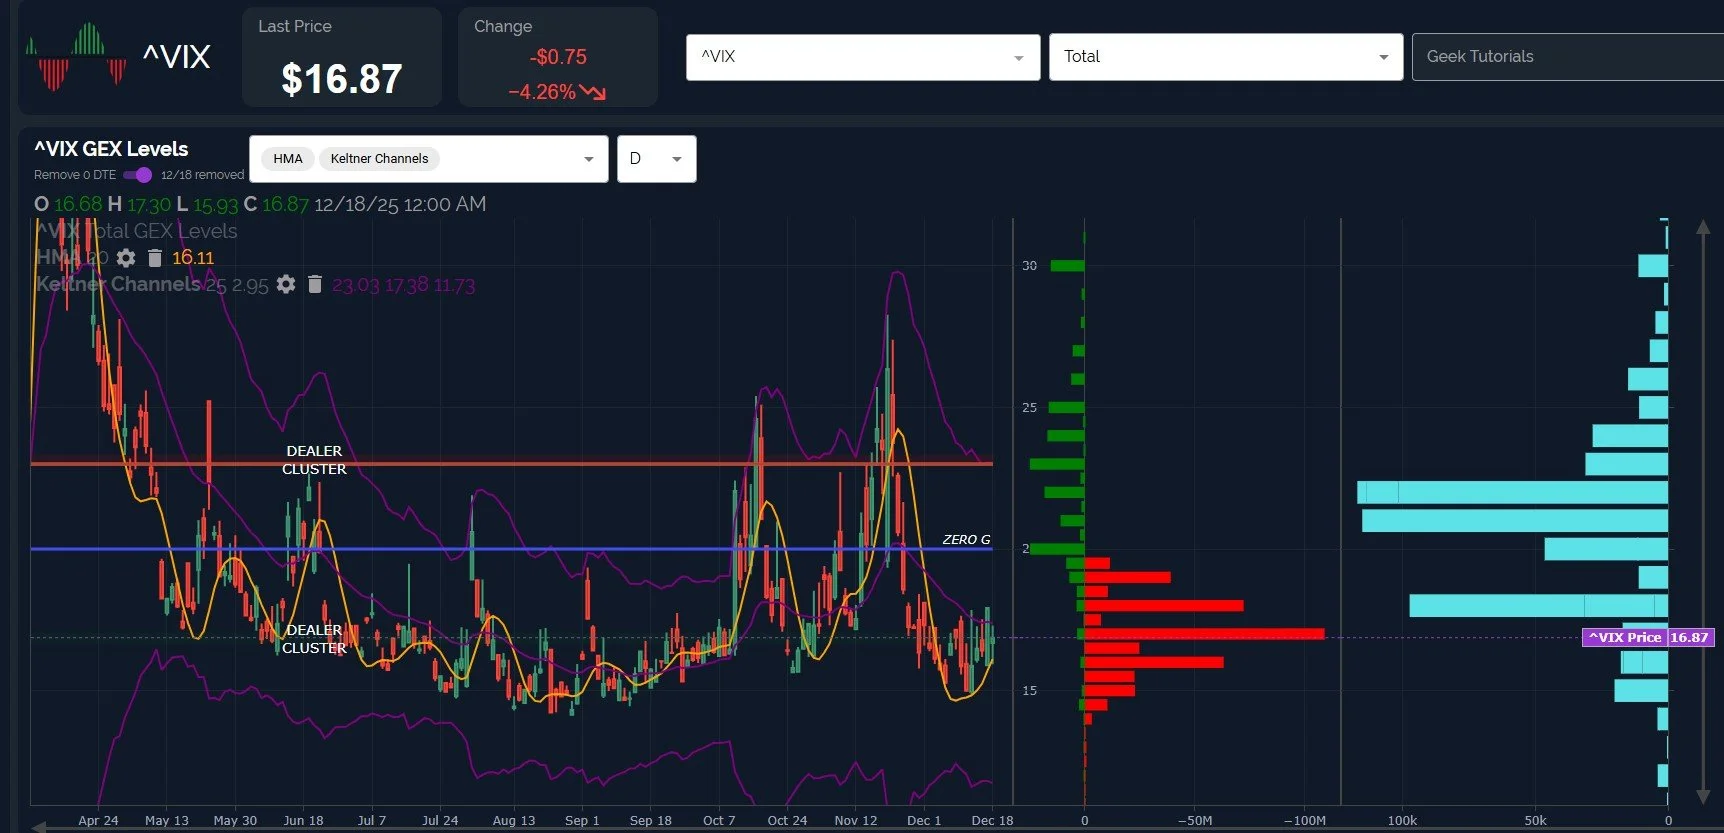
One problem with this idea is the conflicting picture painted by the daily chart: Higher lows, higher highs, and the Hull Moving Average is moving higher, signaling the potential for a larger spike.
If we combine the weekly and daily charts, I think we can draw the following conclusion, at least the one that resonates the most with me personally: The daily chart is biased toward the VIX moving higher, but the arguably more important weekly timeframe suggests any near-term spike in the VIX may be rejected, whether that’s at the 18.52 Hull or as high as the zero gamma level at 20.
This view argues for at least a temporary bullish recovery for indices, barring a rapid turn in the indicators (and GEX) across various timeframes.
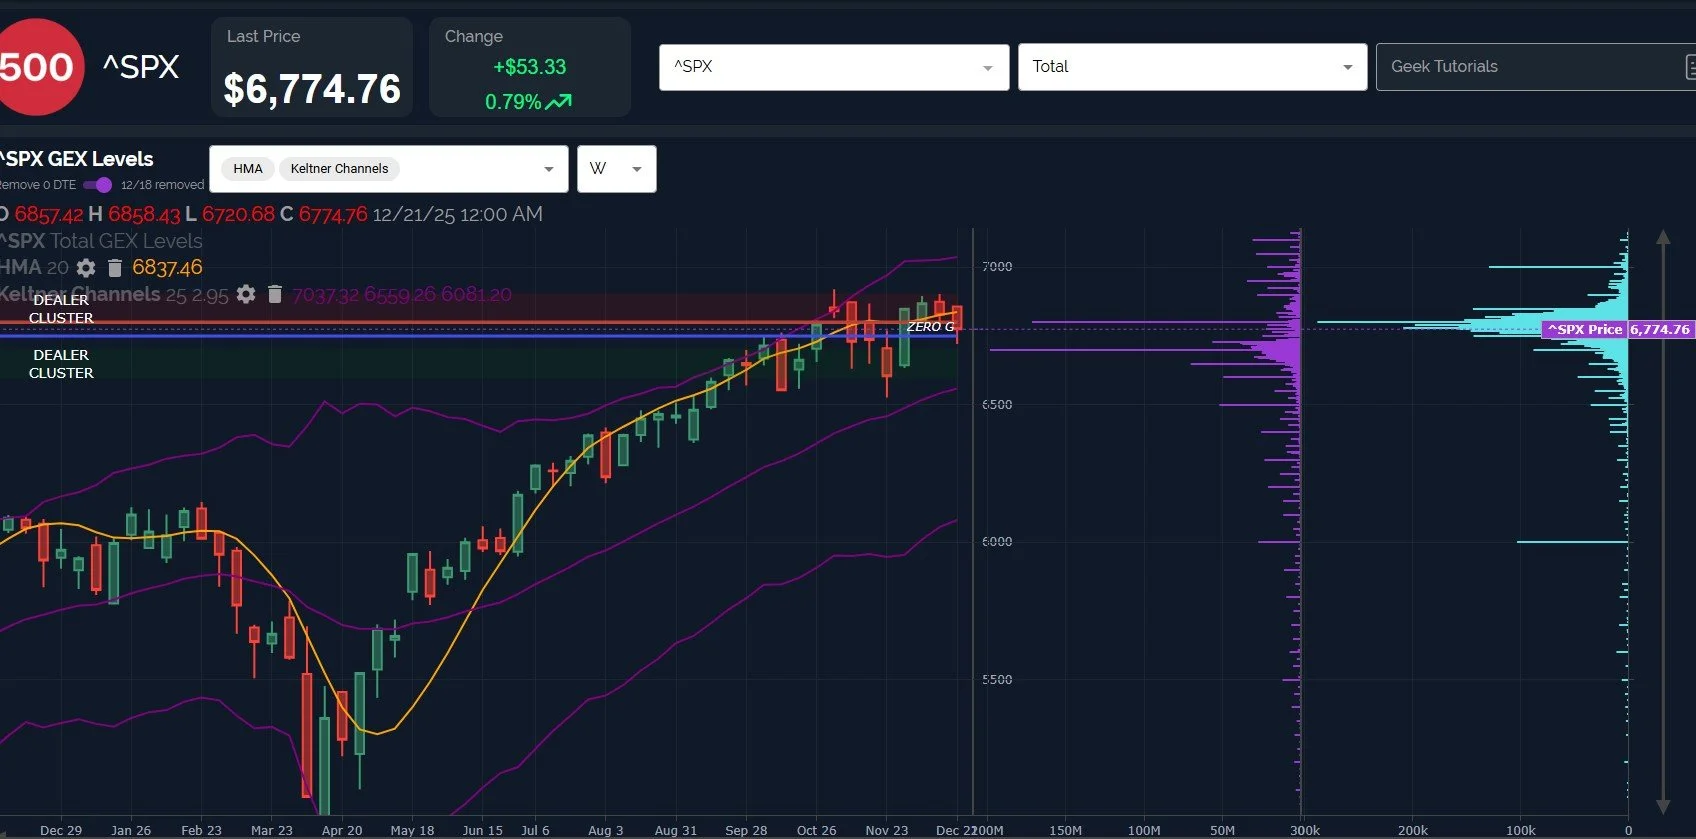
SPX is starting to show cracks at the 7000 GEX level, though the “shifty” appearance and disappearance of net positive GEX may involve OpEx-related changes as well.
Technically speaking, SPX is also below the Hull and the 9-period SMA, a sign of weakness. The weekly chart is still bullish though, in terms of the Keltner channels.
OpEx or not, the 12/31 positive GEX cluster is still there, but completely offset by negative GEX, and we won’t waste time speculating as to “why.” It’s no mystery we have a shrinking timeframe to see 7000 in 2025, yet the question remains, where are we headed next?
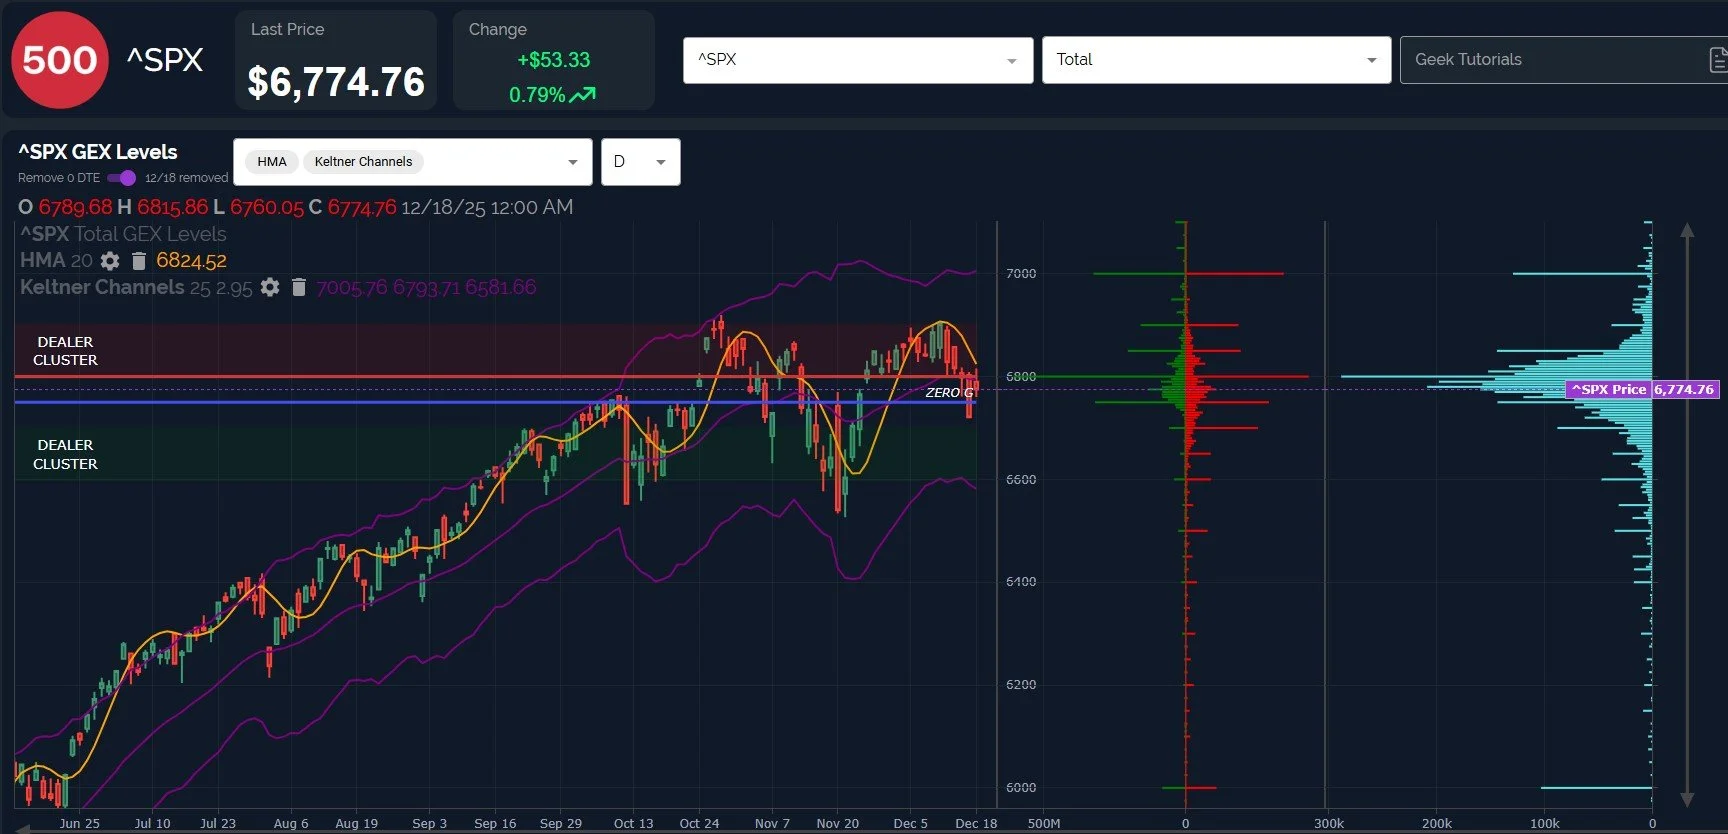
Let’s switch from net GEX to gross, so we can see the positive and negative clusters at each strike. I also changed the chart timeframe from weekly to daily, independent of the GEX switch.
The daily Hull is in a downtrend, and 6800 is now an important pivot area, with continued rejection favoring 6700, and retaking 6800 favoring 6850-6900 (I know, so it’s the easy numbers..I’m just looking at GEX).
On a positive note, if you zoom out and look back at the weekly chart, SPX is pretty much in a broad consolidation sideways since October, though the tilt is still bullish. The odds seem to favor this consolidation resolving to the upside, even if the VIX spikes to 20 and indices make it to 6700 or just below.
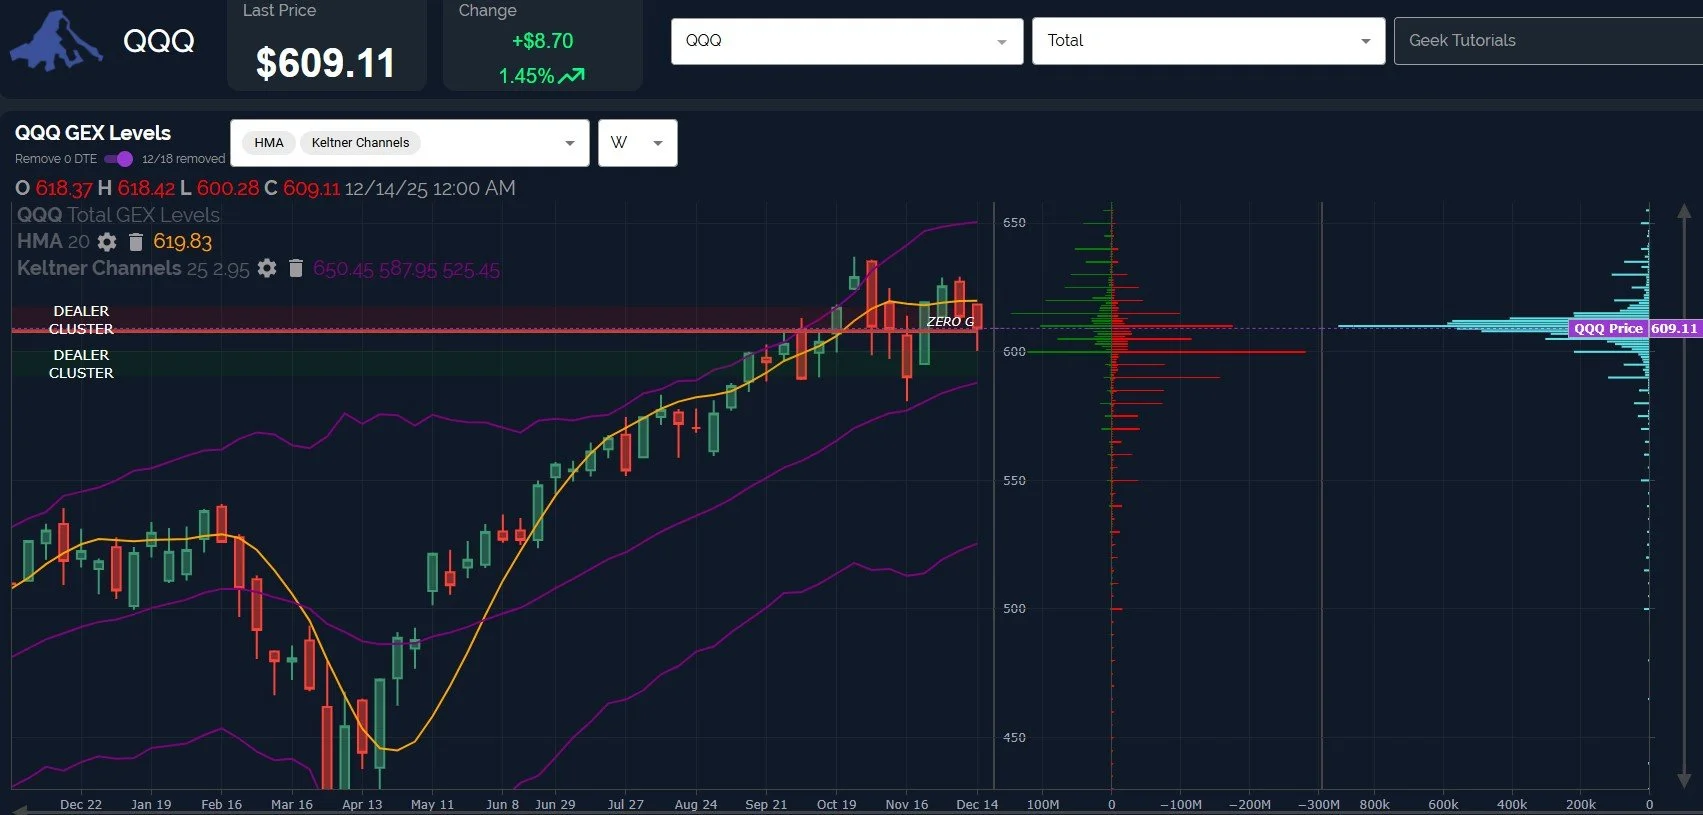
QQQ outperformed today in percentage terms, testing the 600 GEX strike almost perfectly and closing just above 609.
QQQ remains below the weekly Hull, but once again, we are looking at a sideways consolidation (with a possible November low) that doesn’t raise significant red flags unless we close below 600.
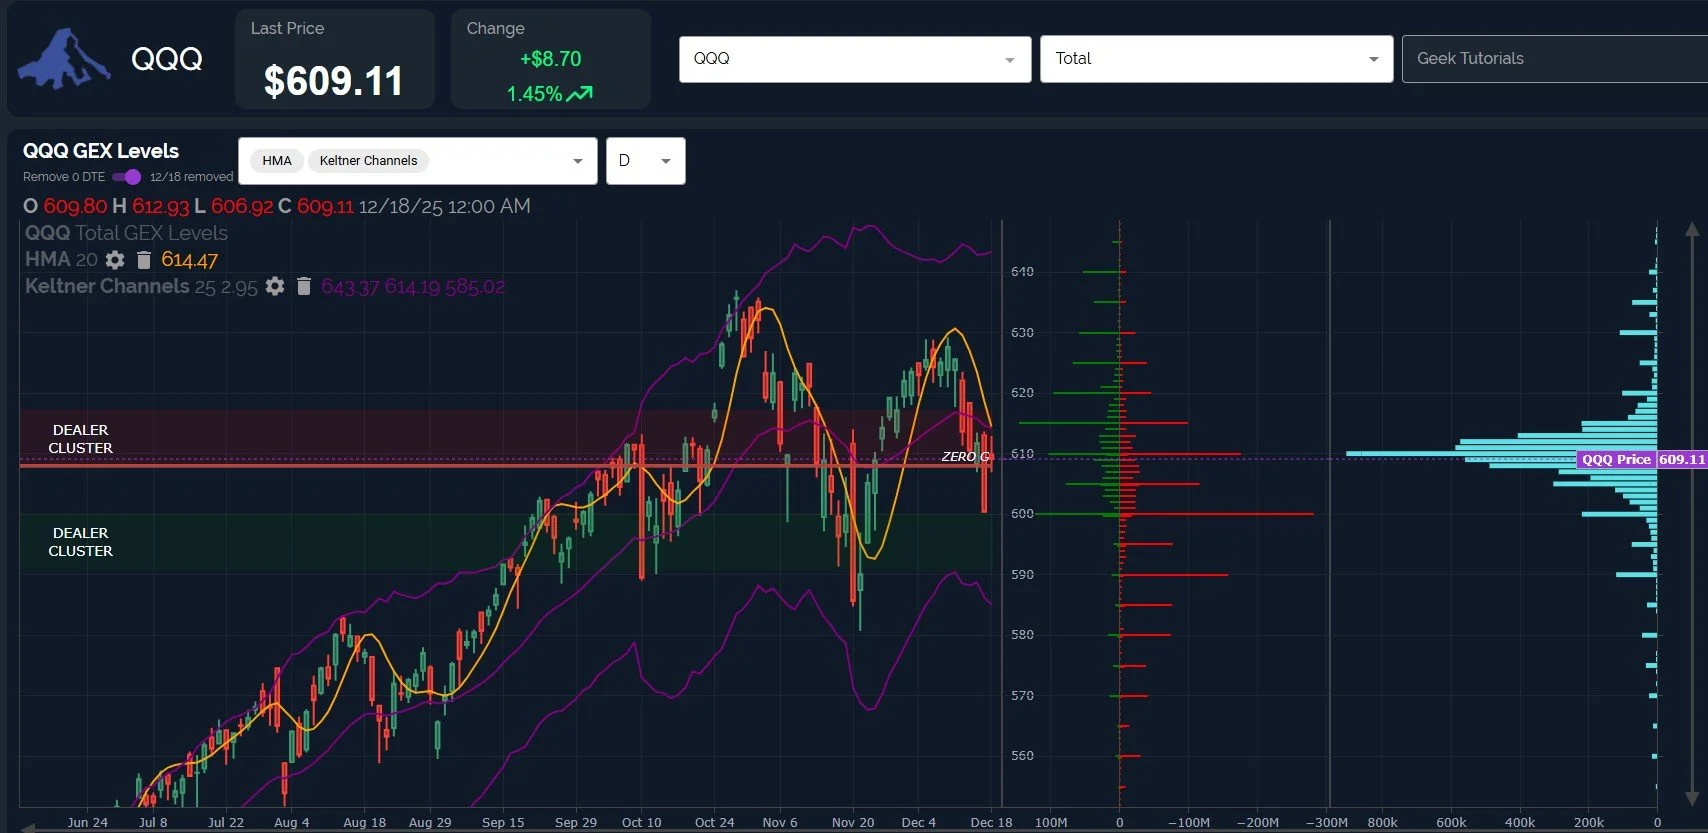
QQQ’s daily chart shows a Hull that is declining rapidly, and QQQ’s price hasn’t been able to overcome that resistance yet.
If QQQ fails to continue the momentum lower, we’ll soon be in a position where the Hull is crossing under price, potentially marking the early signs of a bottom, which can happen fairly quickly.
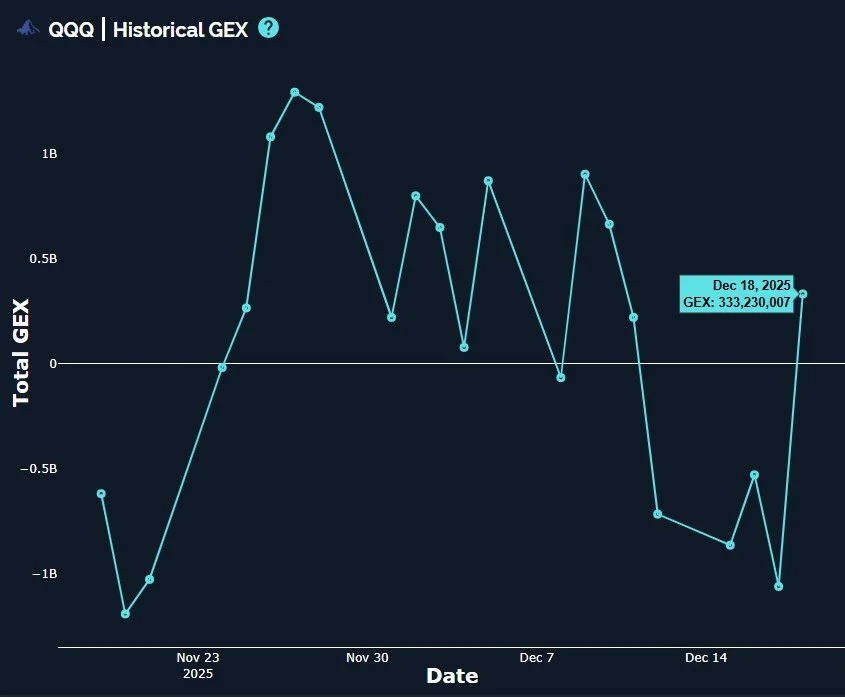
QQQ saw net GEX rise dramatically today, going from -1B to 333M in one day. Typical OpEx behavior, if you ask me. Is the swing indicative of what QQQ does next? I think SPX may be the better data point, which did improve, but not to such a dramatic extent.
In summary, we see some warning signs with the VIX on a daily basis, but the weekly chart remains bearish for volatility as long as the VIX remains below 18.5 on a daily close.
Indices mostly look neutral to bearish, but zooming out to the weekly timeframe definitely errs toward neutral to bullish.
We’re approaching the end of 2025 and the beginning of 2026, so big changes may be afoot, which we’ll continue to share in Discord as we see new developments!
Here’s the link to our Discord server if you haven’t yet joined us in Discord. First-time guests receive a free 7-day trial of the premium Discord channels.
You can join our discussion every day when we discuss markets in real-time via our Geeks Live livestream, now available to everyone for free via the homepage!
If you’re interested in accessing our tools and analytics, be sure to check out our website! We have a lot of updates in the works, and we have 2 primary membership tiers that you can read more about by clicking here: All About Our Memberships
If you’re interested in learning more about our strategy and approach, we address all of these topics in our Geek University course which is included in all memberships.
We posted a YouTube video today, and we have educational playlists, so give our channel a look if you’re curious about recent market commentary and ideas as well as gamma (GEX) concepts explained.
Thanks for being part of our community and know that we invite your feedback!
The information provided by Geeks of Finance LLC is for educational purposes only and is not intended to be, nor should be construed as, an offer, recommendation or solicitation to buy or sell any security or instrument or to participate in any transaction or activity. Please view our Investment Adviser Disclaimer and Risk Disclosure.