
Conflicting Signals For The VIX: December 23 Stock Market Preview
You can still get $300 off of the annual Portfolio Manager subscription for a few more days, enter code HOLIDAYS2025 at checkout!
You can view today’s YouTube video here. We take a look at SPX, QQQ, the VIX, META, GLD, and TSLA, so check it out if you have a few short minutes!
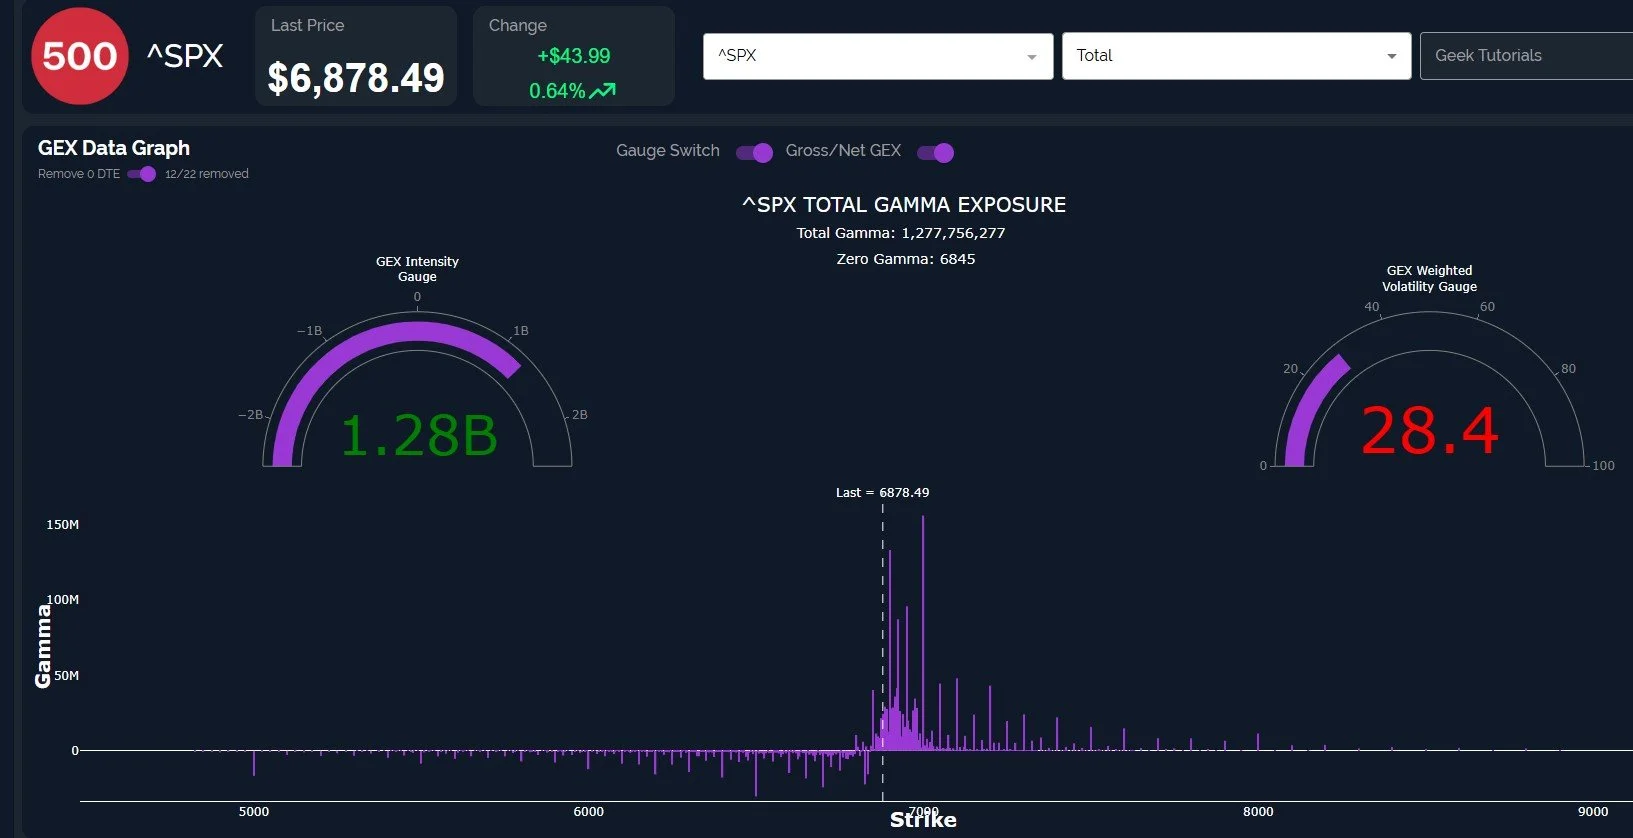
Let’s start with the SPX weekly chart, which shows a largely sideways consolidation since October, though the Keltner channels continue reflecting a higher bias.
SPX is rapidly approaching the first big potential resistance zone at 6900, also the beginning edge of the upper Dealer Cluster zone, which extends to 7000 and marks a zone where we might see dealer selling pressure.
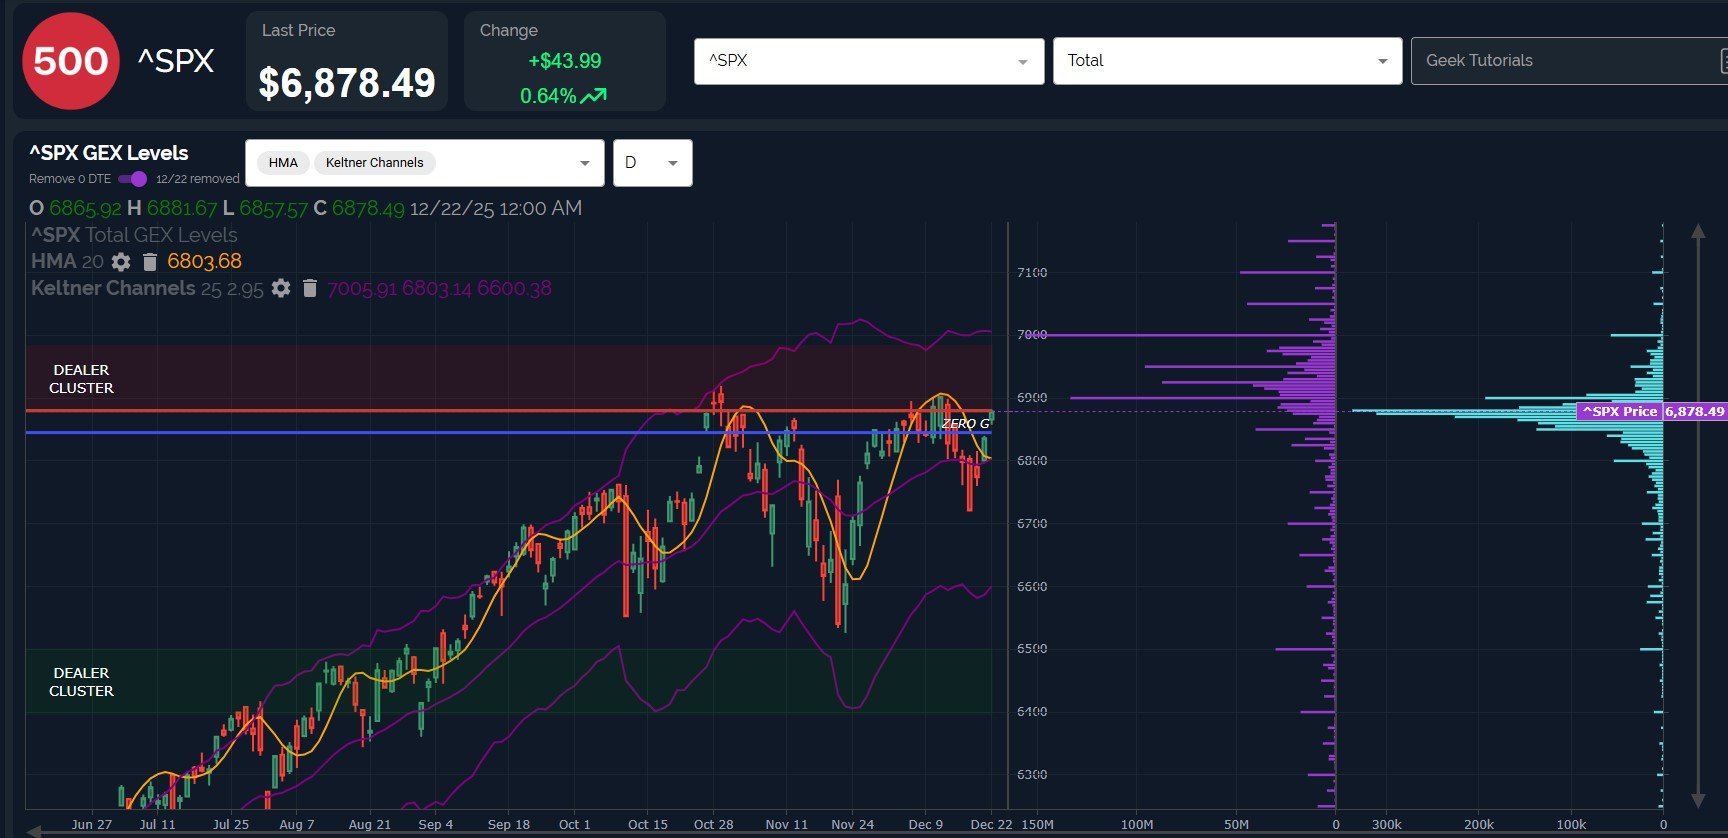
The SPX daily chart gives us a slightly different look at net absolute GEX at each strike, also allowing us to see those GEX clusters alongside the chart itself.
We see very nice confluence of the upper daily Keltner and the GEX at 7000, currently serving as a continued high-probability target into year-end (or possibly just into the new year).
One potential concern is the distance between SPX’s price and the declining Hull Moving Average. The Hull is seemingly in the process of flattening out, a key precursor to a potential turn higher, but the distance implies the possibility of SPX dropping back toward 6800 before a “final” push higher toward 7000. Let’s see what happens starting tomorrow as w knock at the door to 6900.
Geeksoffinance.com
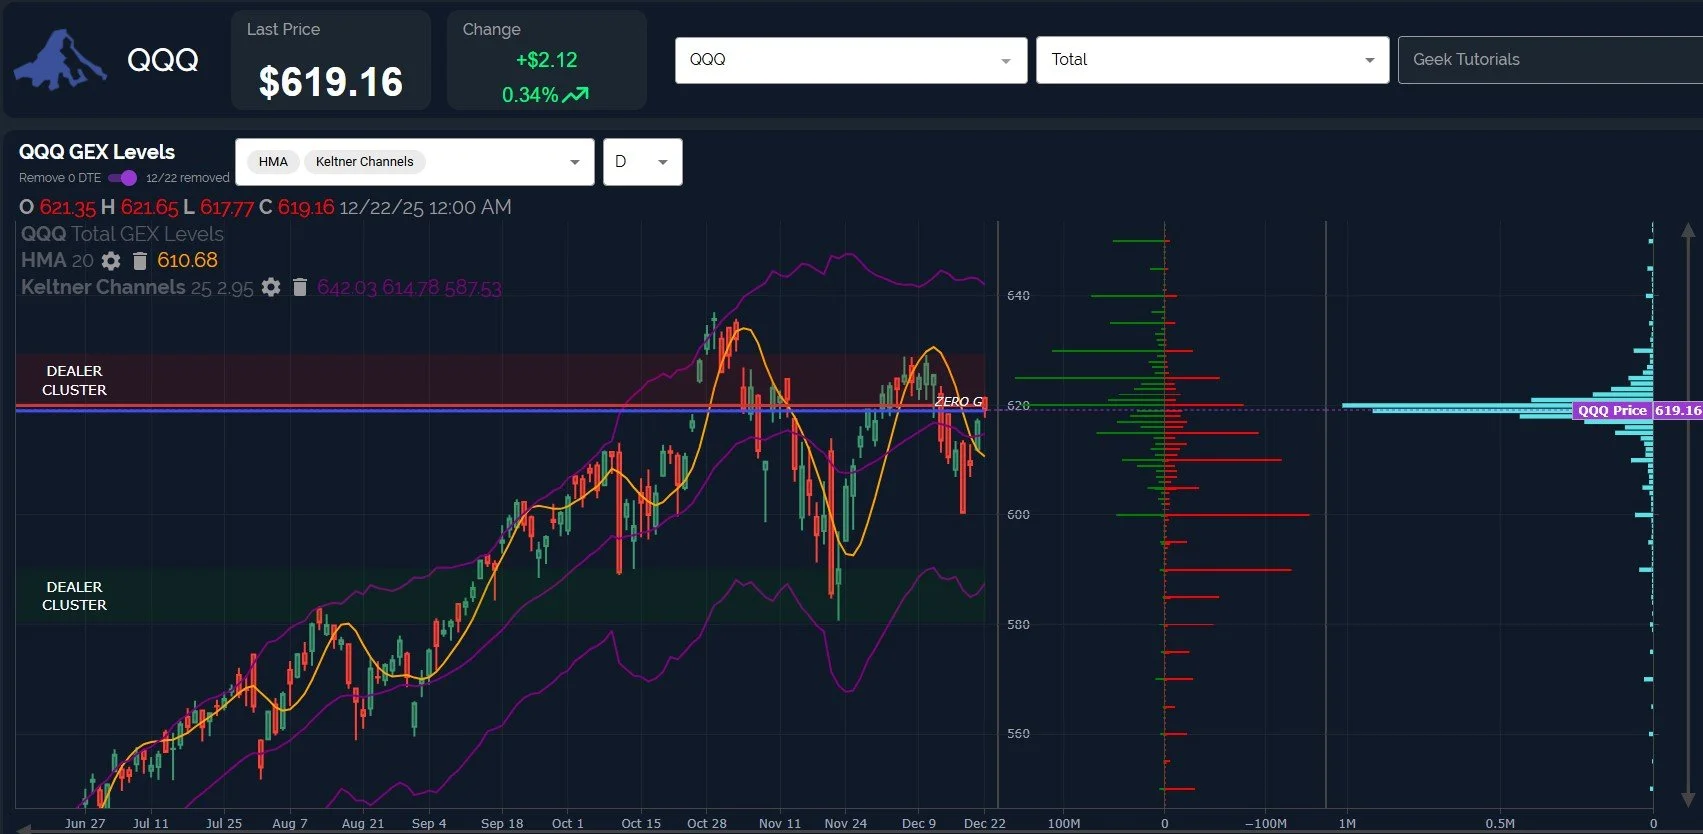
QQQ was the weakest of the major indices today, potentially another red flag for a straight-line move higher from here.
QQQ also shows a similar issue to SPX with the big gap between the current price and the declining Hull, implying a potential drop back to 610 before another attempt higher. The alternative is a potential move higher or sideways from here while the Hull plays “catch-up,” though I think that’s less likely for subjective reasons.
Geeksoffinance.com
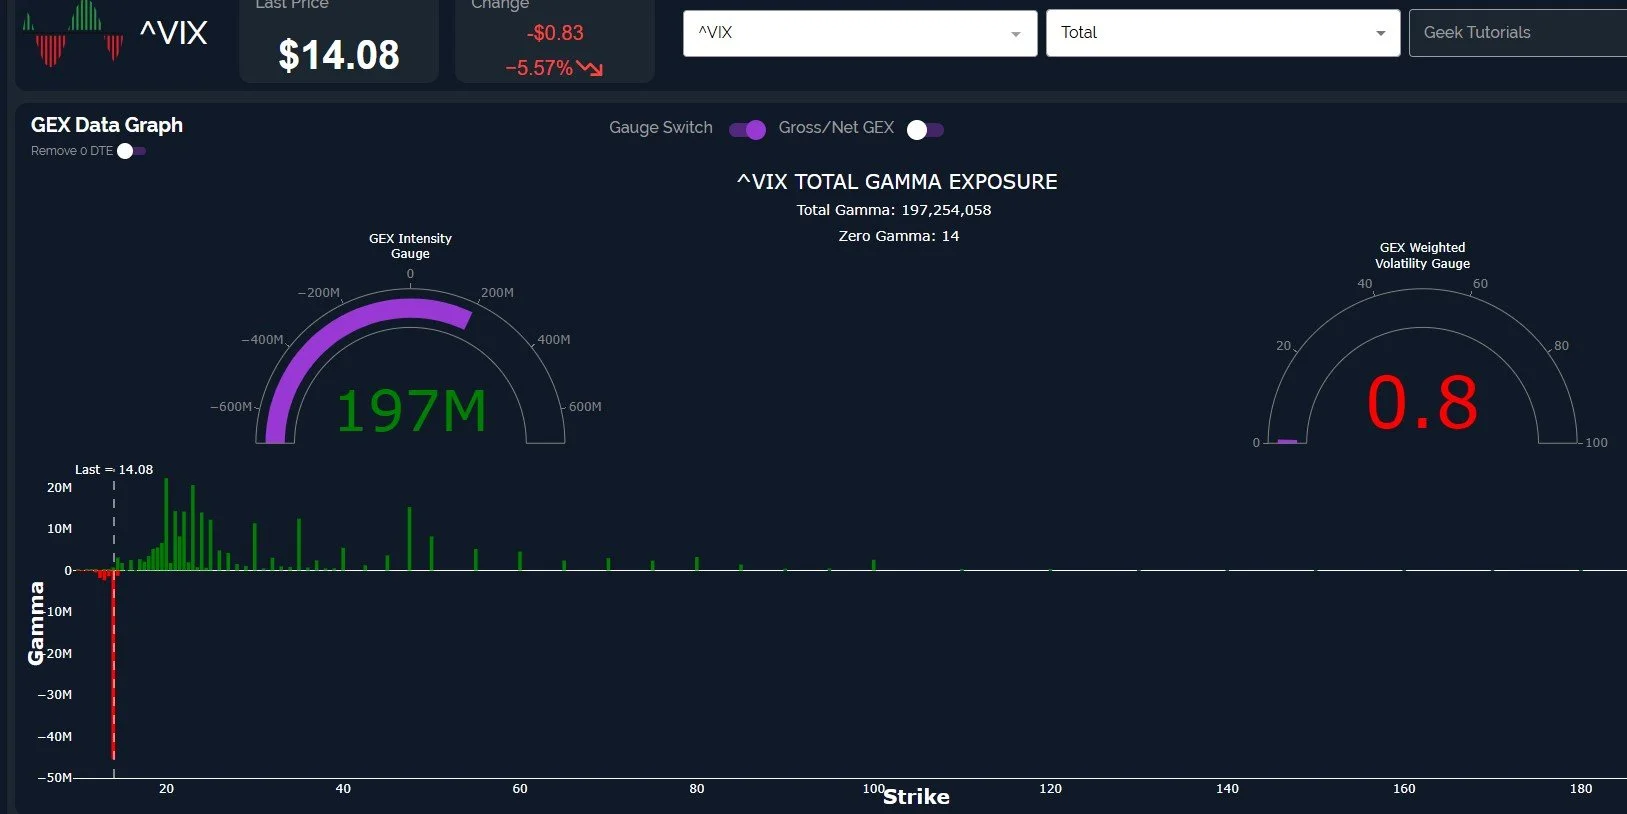
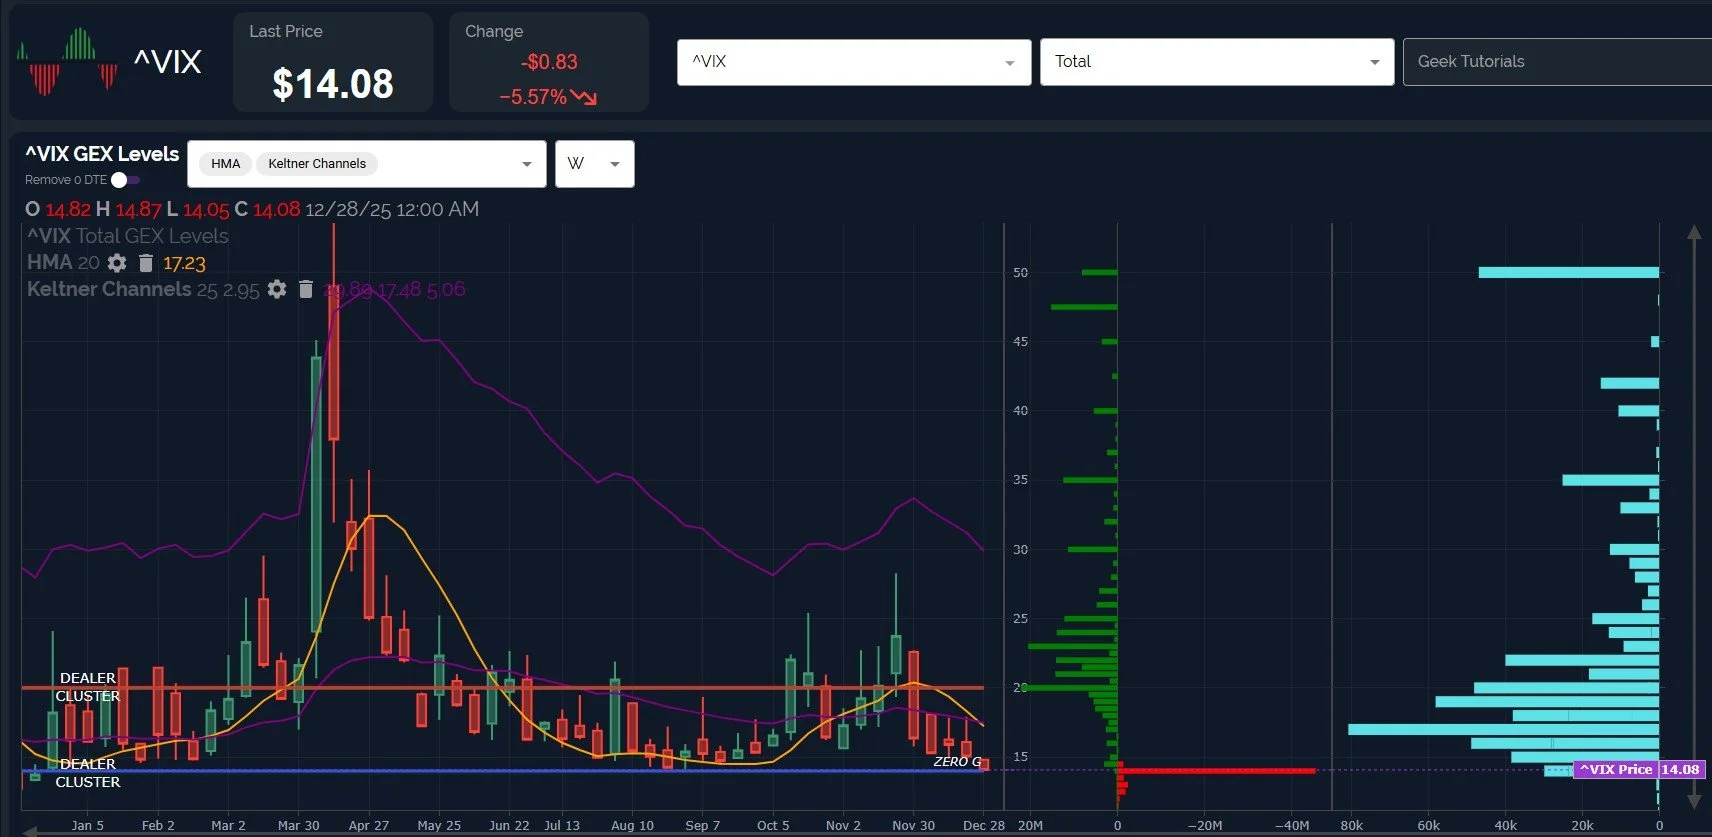
One of the bigger head scratchers today is the positive GEX on the VIX, which has actually increased in recent days despite the strong downward move in the VIX.
The downside push has seen one large, single negative net cluster moving down the chain, currently at 14, while we see relatively meaningful GEX at higher strikes from 20 up to the VIX 50-area.
Why isn’t GEX negative on the VIX as it pushes lower, which would be more typical of what we’ve seen this year?
Geeksoffinance.com
One potential scenario in the next week is a spike in the VIX toward 16-17, then a drop back down again, with SPX turning back up toward 7000.
16-17 aligns with resistance on the 2-hour chart, and 17.23 marks the weekly Hull, so the overlapping timeframes may imply significance to that area as a bull/bear line.
Geeksoffinance.com
Lastly, VVIX (the index measuring expected volatility of the VIX itself) is rapidly approaching an area between 70-80 that has marked lows going back to 2015. Is this time different, or are we about to top out and then enter another volatile period for markets?
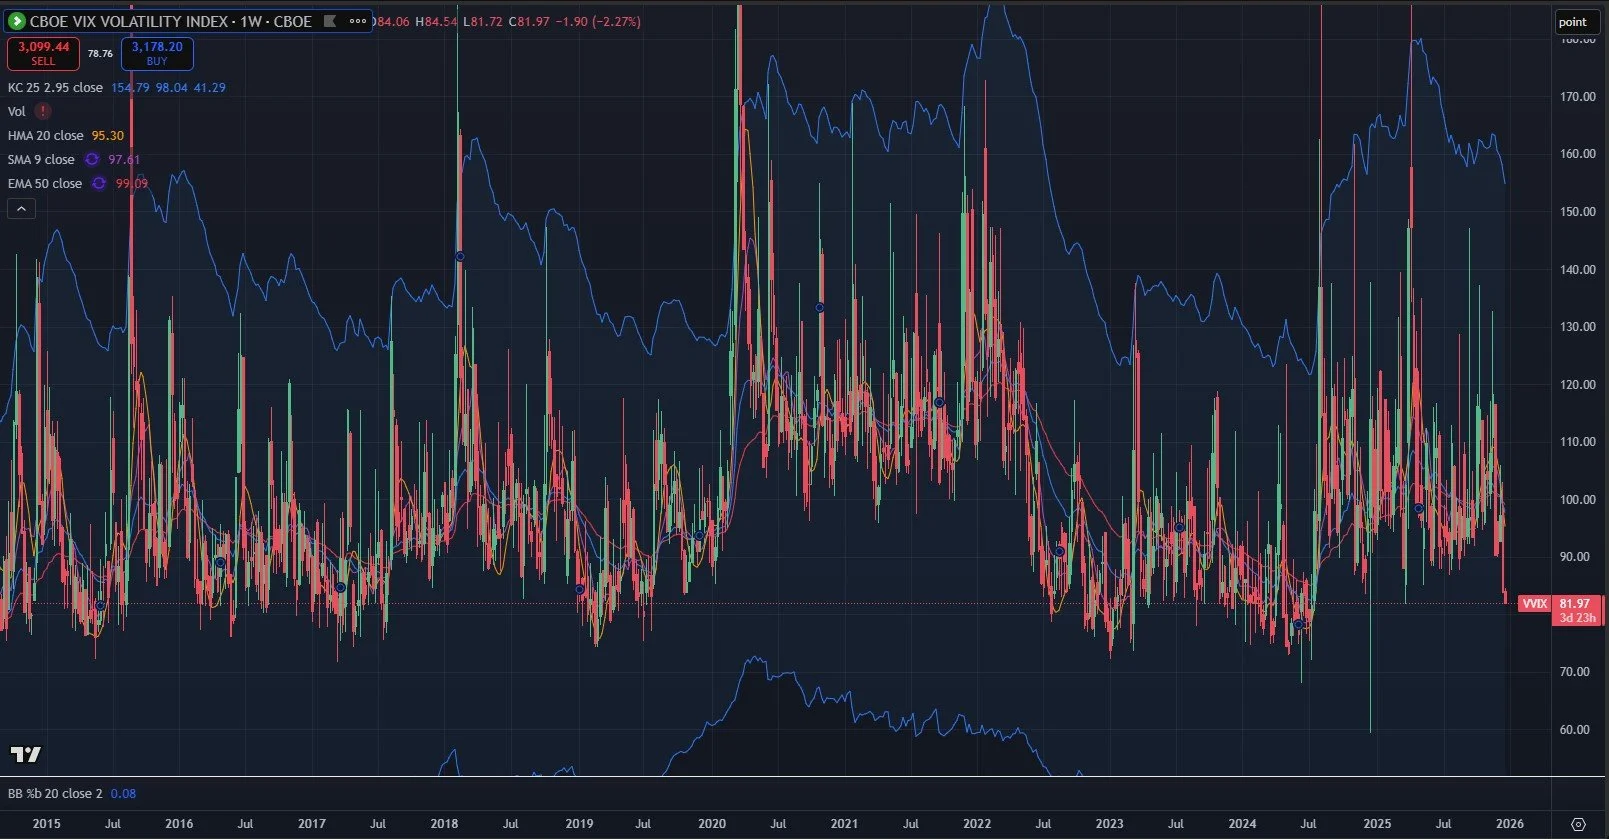
tradingview.com
Here’s the link to our Discord server if you haven’t yet joined us in Discord. First-time guests receive a free 7-day trial of the premium Discord channels.
You can join our discussion every day when we discuss markets in real-time via our Geeks Live livestream, now available to everyone for free via the homepage!
If you’re interested in accessing our tools and analytics, be sure to check out our website! We have a lot of updates in the works, and we have 2 primary membership tiers that you can read more about by clicking here: All About Our Memberships
If you’re interested in learning more about our strategy and approach, we address all of these topics in our Geek University course which is included in all memberships.
We posted a YouTube video today, and we have educational playlists, so give our channel a look if you’re curious about recent market commentary and ideas as well as gamma (GEX) concepts explained.
Thanks for being part of our community and know that we invite your feedback!
The information provided by Geeks of Finance LLC is for educational purposes only and is not intended to be, nor should be construed as, an offer, recommendation or solicitation to buy or sell any security or instrument or to participate in any transaction or activity. Please view our Investment Adviser Disclaimer and Risk Disclosure.