
Year-End Is Here: SPX 7000 Or Bust? December 1 Stock Market Preview
NEWSLETTER ONLY Cyber Monday Special: Try our monthly Analyst subscription for ONLY $10 the first Month (First tuime subscribers only)! Enter code NEWSLETTER10 at checkout! ENDING after Cyber Monday, potentially never to return!
You can view today’s YouTube video here. Our YouTube videos sometimes have a little overlap, but we discuss different aspects of major indices as well as a few individual tickers, so check it out if you have a few minutes, or if you’re audibly inclined!
Well, the only thing that went down faster than that turkey gizzard as it slid down Uncle Fester’s throat was the VIX last week, bottoming at 15.78 after reaching a weekly high of almost 23.
The decline in the VIX broke key moving averages and Keltner support, reaching the biggest negative GEX cluster at 16. We acknowledged the 16-18 range as being a likely target once those averages were broken, but the other statement we made remains true: There just isn’t a visible appetite (based on GEX) for a sustained move below 16.
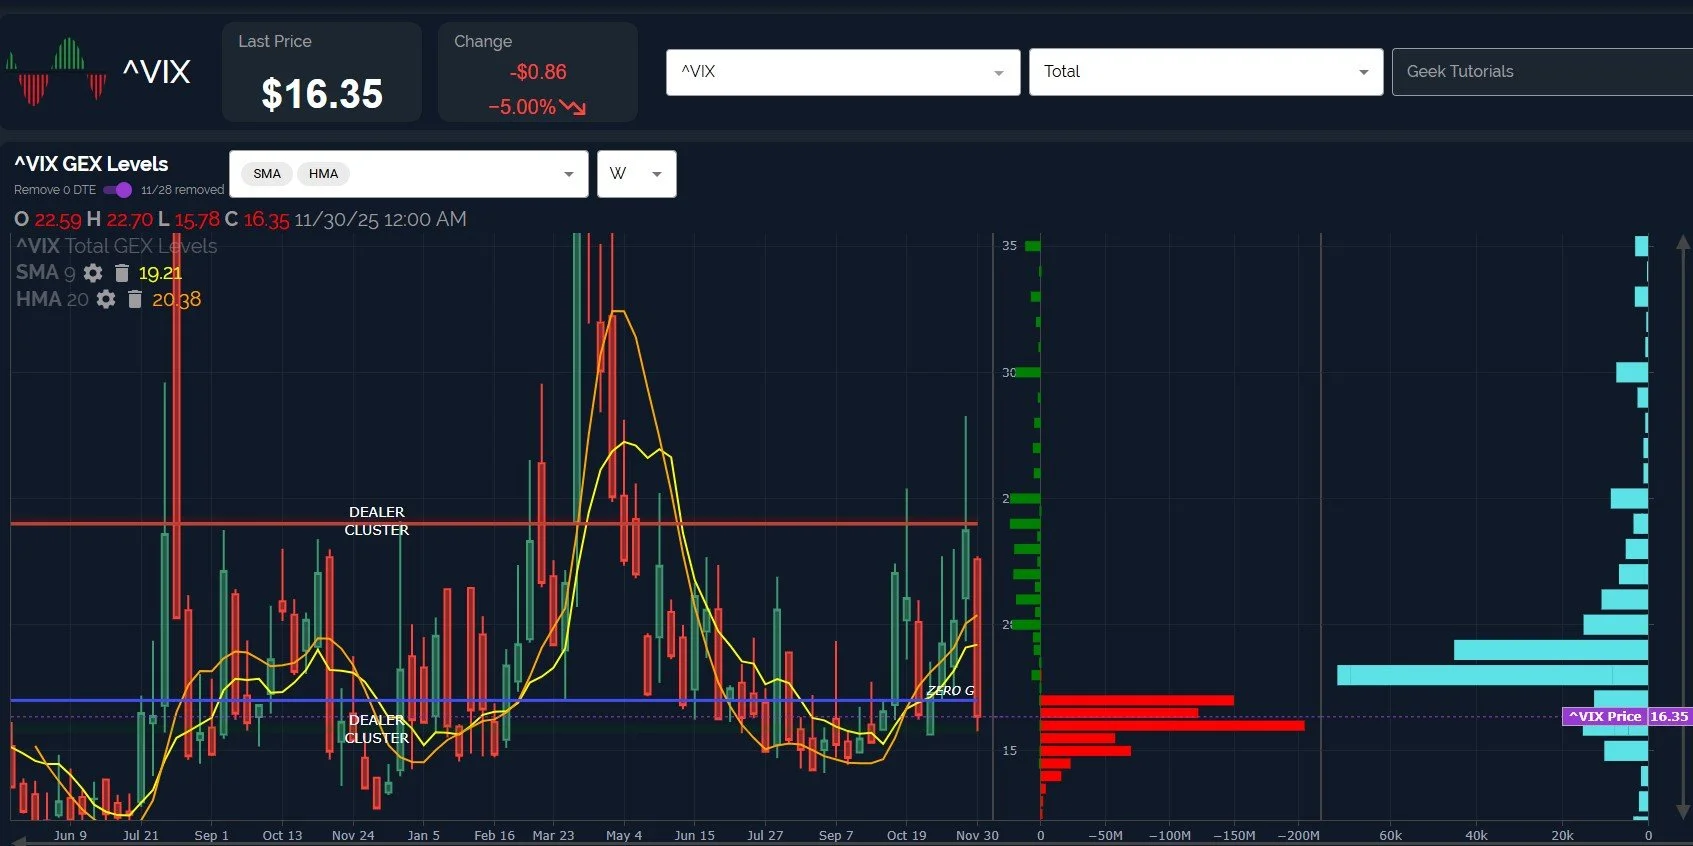
Let’s zoom in to the 4-hour chart: The VIX is clearly in a downtrend, but Friday saw a reactive bounce off of the lower Keltner channel, and a close above the Hull Moving Average, which is actually pointing slightly higher at this time. Futures show a decline in indices, a possibility noted Friday in Discord, so this is already proving to be an important bounce zone for the VIX.
The question remains: Will the VIX make a lower high, perhaps in the 20-23 range, then decline back toward 16 as SPX heads for 7000? Or will we see this entire upside move for indices prove to be a Grinch-inspired headfake, with indices heading down to new post-April lows?

tradingview.com
QQQ stopped at the important 620 GEX cluster, with 635 now showing a large positive net GEX cluster overhead. A continued stretch higher may target 635 this week.
The Hull has curled upward, now sitting just below 600, a level that continues to represent an important downside support area and a spot bulls will want to see hold if we do get a pullback.
The rebound itself has been strong, and the Hull turning up appears potentially bullish for a continued uptrend, but price is way extended above the Hull, and a quick glance at previous extensions above or below the line show mean reversion one way or another: Sideways consolidation or a quick downward move are both entirely possible.
Adding to cautionary points, QQQ positive GEX decreased slightly Friday despite the price increase. We also see volume mostly at lower strikes.

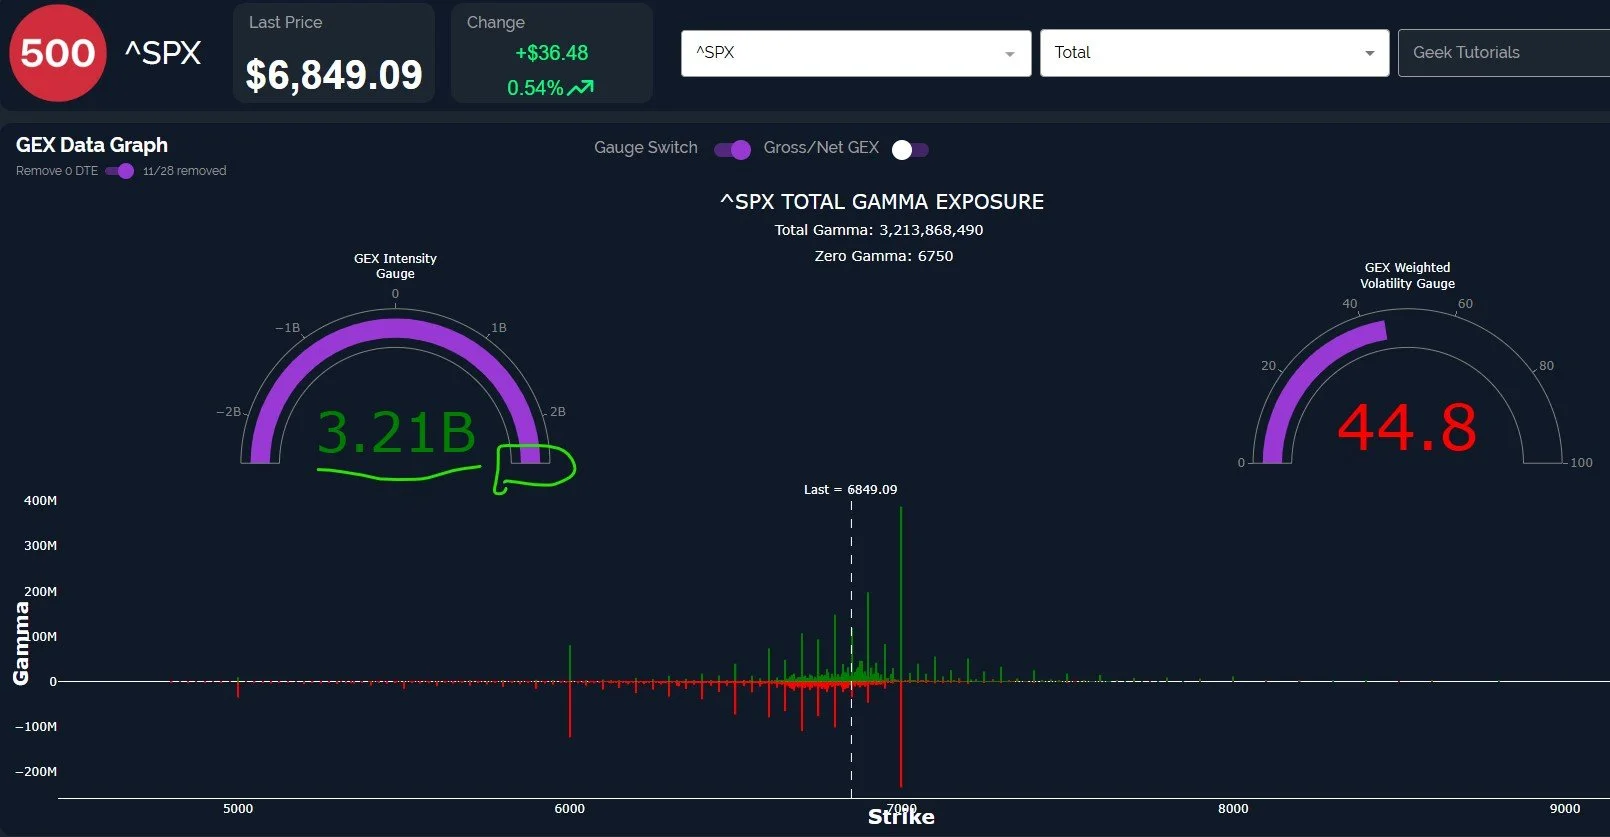
SPX shows extremely similar relationships to its Hull, so without repeating too much, we can note the differences in GEX: SPX shows 7000 remaining as a large net positive GEX cluster, also aligning with the upper daily Keltner channel.
Both indices are also within their upper Dealer Cluster zones, where we expect dealers to potentially sell. This zone does extend higher, so being in the zone isn’t in and of itself a guarantee of an immediate sharp drop by any means.
The light blue line denoting daily total volume at each strike shows that a lot of the volume was at lower strikes, similar to QQQ.
6700 becomes a very important support level in the event of a deeper pullback than what we see overnight so far.

One key contrarian indicator I’ve come to appreciate regarding SPX is the GEX Intensity Gauge, which compares the 3.21B GEX reading to prior readings over the past 52-weeks. Being at either extreme can signal risk of a contrarian move to the other side, bringing to mind the analogy of the boat leaning side to side as the crowd moves together from one side to the other. SPX is at an extreme reading as of Friday.
IWM almost touched 249 (again), just below the big 250 GEX cluster. 250 represents the upper Dealer Cluster zone as well as the zone where IWM failed twice before in October.
We do see positive GEX up to 260 in notable quantity, with 255 currently matching the upper Keltner channel on the daily chart.
IWM is also stretched quite far above the rising Hull, which is still just below the big GEX area at 240.
235 and 237 strikes saw elevated volume Friday.

IWM’s bullish picture remains intact as long as any drop can hold the 240 area.
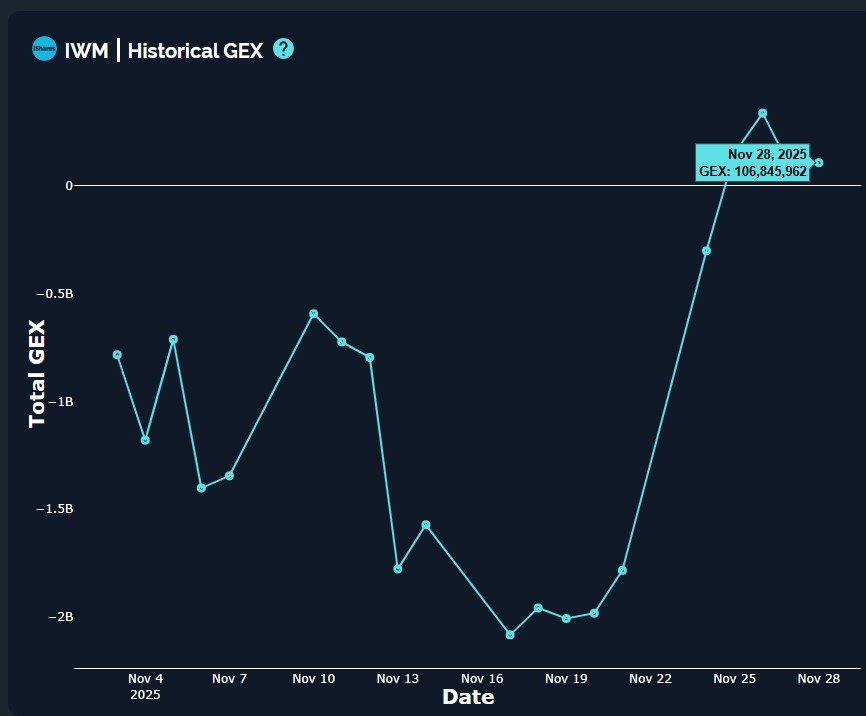
A look at recent changes in GEX shows negative GEX disappearing virtually entirely within 2 days, which is typical for IWM. Note that the GEX high was actually Wednesday, with a slight decline thereafter, barely holding positive GEX territory.
IWM has continued giving us somewhat advanced notice regarding shifts in the broader indices, so we’ll continue watching IWM for intraday signals, as well as important indications by GEX tomorrow morning for QQQ and SPX. We hope you’ll join us in Discord where we’ll share some of what we’re seeing!
Here’s the link to our Discord server if you haven’t joined us yet! We have an active community of thoughtful and experienced traders who share their thoughts, and we share analysis every day as well.
You can join our discussion every day when we discuss markets in real-time via our Geeks Live livestream, now available to everyone for free via the homepage!
If you’re interested in accessing our tools and analytics, be sure to check out our website! We’re running more than one promo now, and they won’t last long! We have a lot of updates in the works, and we have 2 primary membership tiers that you can read more about by clicking here: All About Our Memberships
If you’re interested in learning more about our strategy and approach, we address all of these topics in our Geek University course which is included in all memberships.
We posted a YouTube video today, and we have useful and educational playlists, so give our channel a look if you’re curious about recent market commentary and ideas as well as gamma (GEX) concepts explained.
Thanks for being part of our community and know that we invite your feedback!
The information provided by Geeks of Finance LLC is for educational purposes only and is not intended to be, nor should be construed as, an offer, recommendation or solicitation to buy or sell any security or instrument or to participate in any transaction or activity. Please view our Investment Adviser Disclaimer and Risk Disclosure.