
Extreme Positive GEX, Negative Divergences: October 28 Stock Market Preview
PORTFOLIO MANAGER ANNUAL SUBSCRIPTION PROMO- $300 off of the annual Portfolio Manager subscription Enter code FALL2025 at checkout!
In tonight’s YouTube video, we take a look at some of the same topics covered in the newsletter as well as other tickers like PLTR, so check it out!
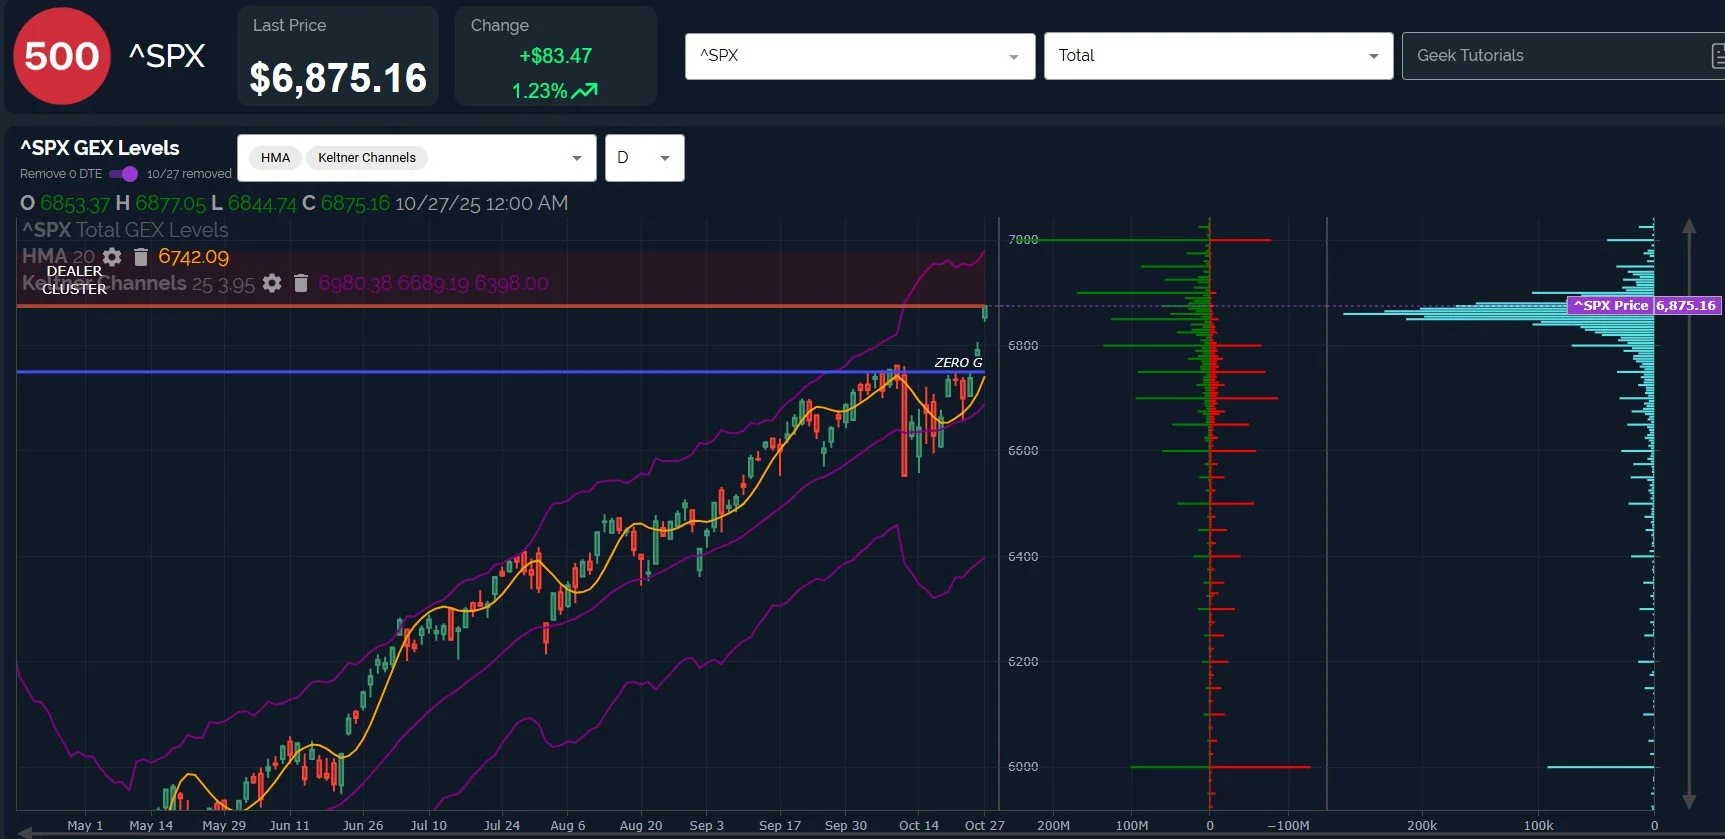
The incredibly bullish rally since April continues, with SPX gapping up in a big way, printing a new all-time high.
Today’s close at 6875 is getting very close to the year-end target we’ve mentioned repeatedly at 7000, now showing GEX clusters at a variety of dates between November 21-December 31. We also see 6900 with good representation on the GEX 3D graph in early November.
The distance between the current price and the daily Hull Moving Average is unusually wide, historically resulting in the two forces converging, whether we see price move sideways as the Hull rises, or price drop to test the Hull again.
With SPX in the upper Dealer Cluster zone, where dealer selling pressure might emerge, it wouldn’t be surprising to see a retest of 6800 or even 6750 in coming days. What happens at that point will be telling.
SPX rarely shows GEX over 3 billion, making today’s reading at the close very extreme.
We view extreme GEX readings (as measured in comparison to GEX readings over the prior 52 weeks) as potential contrarian signals, not on a 1-day basis, but as a sign of a possible pullback over coming days.
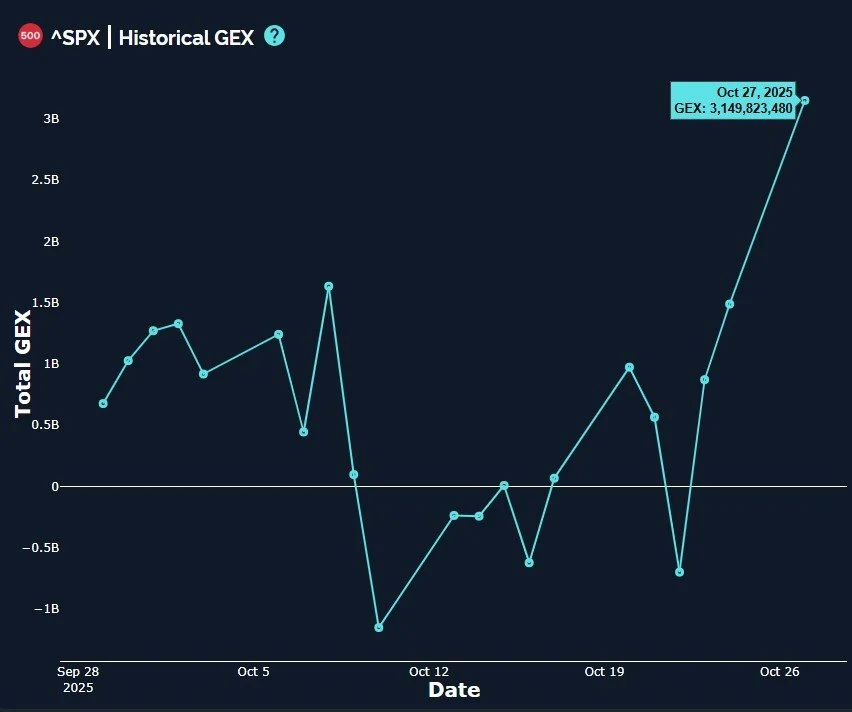
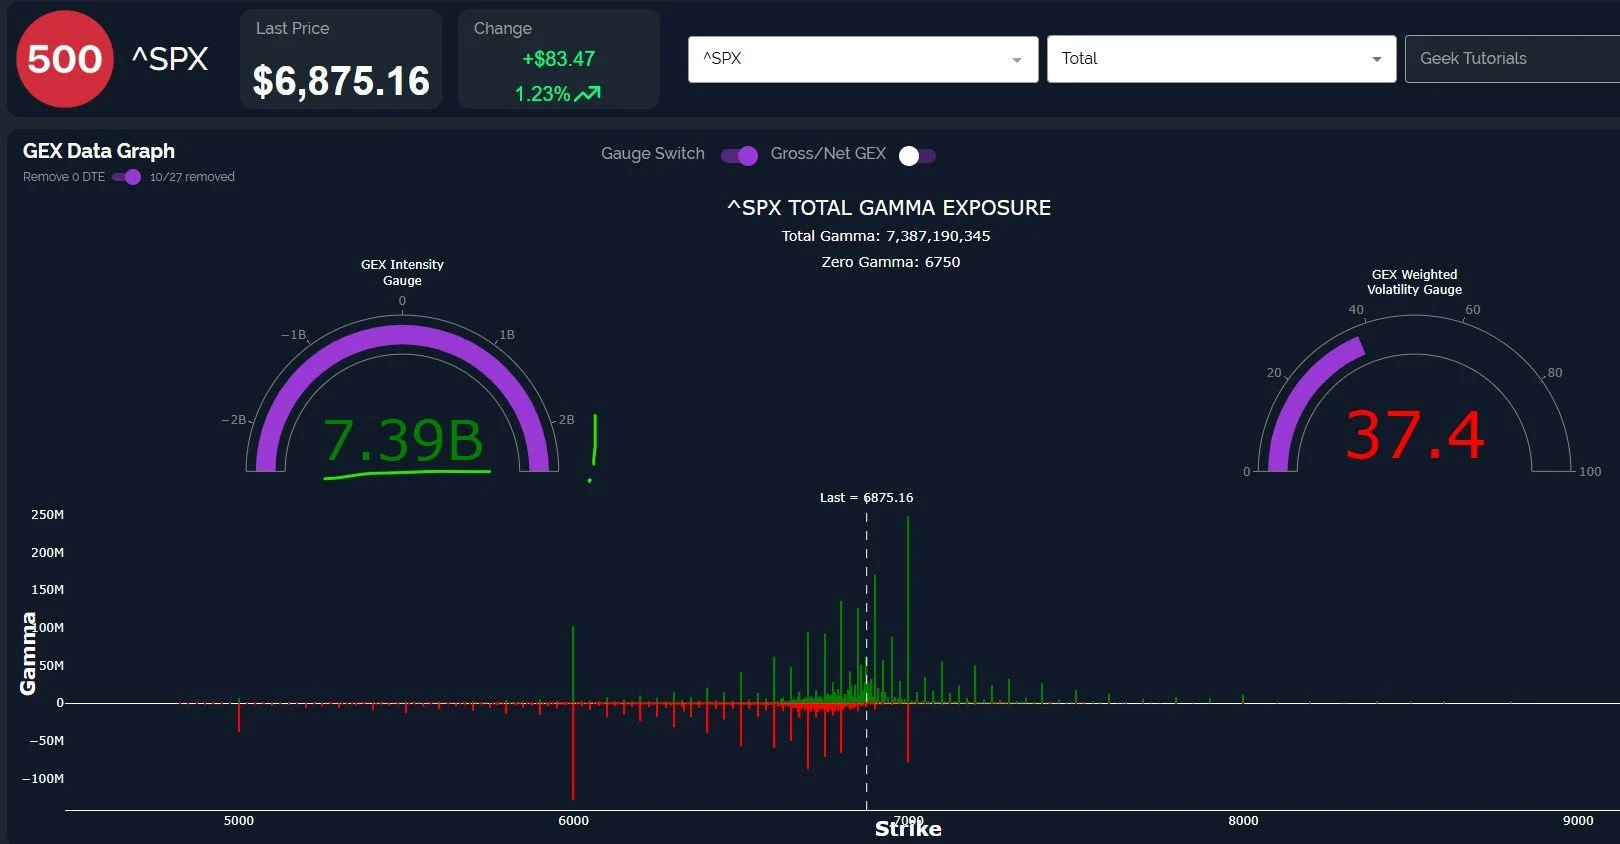
The after-hours party got even more wild, with the latest reading on SPX net GEX showing a whopping 7.39B. I think we can redefine “extreme” now.
Interestingly, also notice the importance of 7000, showing a virtual wall of mostly positive GEX, though that’s the last large concentration. Participants seem to be advertising confidence in continuation higher, though a current lack of interest in prices beyond 7000. Positive and negative GEX are noticeable down to 6500, in contrast, reflecting upside risk of roughly 2%, with downside risk of 5-7% or more. This point is certainly not of interest to most when the trend and momentum is higher (hence, a perception that the odds are higher that we continue higher), but it might be time to dust off the age-old guide about hedges, Preventing Mere Scratches (I’m not sure if this book is real, but I’m contemplating writing it).
QQQ is similarly stretched beyond the Hull in extreme fashion, also right at the upper Daler Cluster zone. A further push into the box would be pretty crazy, but possible, with another 2% move toward 640 being possible.
Losing 620 would be the first red flag for bulls, then a retest of 600, which at this point should hold if we are to continue higher toward 650.

SMH caught my attention today, with SMH at the top of the weekly Keltner channel and right at the upper Dealer Cluster zone. Elevated volume today at the 335 area is also noteworthy, though I’d want to see what happens with SMH on any drop toward 344 first.
With SMH leading QQQ higher for much of this bull market, SMH’s action is important.

SMH saw a divergence to the downside with net GEX decreasing. While still positive, net GEX almost at the zero line.

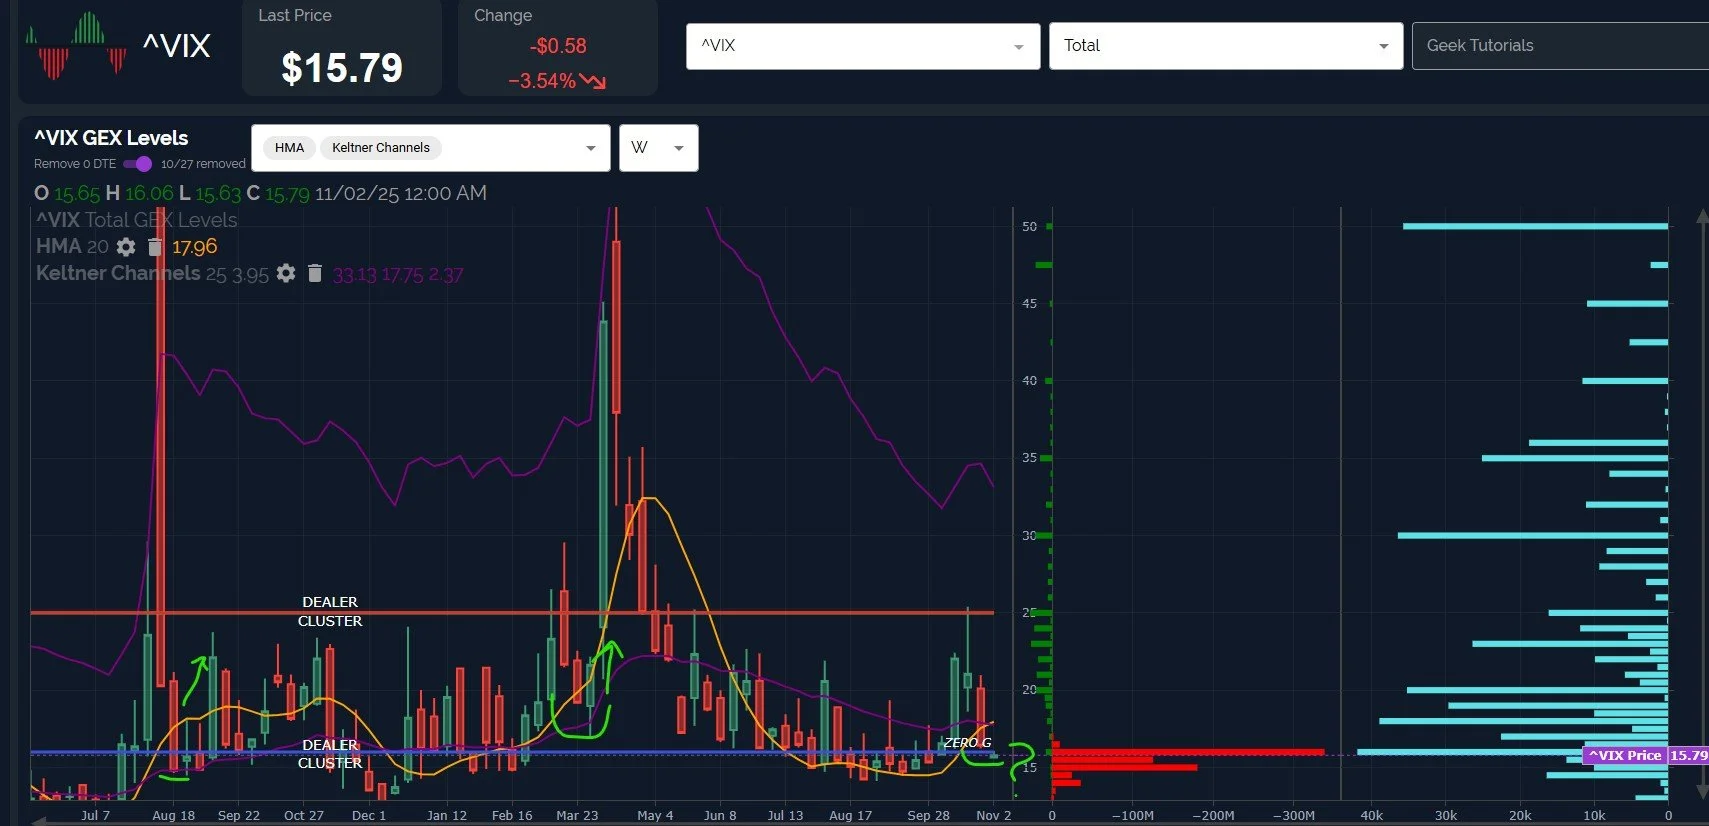
The VIX is also potentially a case of “too far, too fast’ to the downside, leaving a big gap between the current VIX level and the Hull on both daily and weekly timeframes.
The break to the downside Friday was certainly bullish, and the burden is on the bears to overcome the support-turned-resistance at 18.
Given the large amount of negative GEX at 15-16, we may indeed see a reversal from this area,and 18-20 will be key.
IWM has been underperforming SPX and QQQ, getting stuck around the 250 level since Friday.
Despite the price action, IWM has the larger upside potential, though the current status of SPX and QQQ as being very overbought (by certain metrics) introduces the possibility of a pullback toward IWM 240 before continuing back up toward 260.

IWM net GEX dropped back into negative territory, interestingly, further casting a shadow on the idea of uninterrupted upside into perpetuity.
This morning, 0 DTE GEX gave us a pretty accurate picture, and we have confidence that we will have additional 0 DTE clues that will lead us in the right direction in coming days. We hope you’ll join us in Discord where we will keep the discussion going during the day tomorrow. Thanks for reading!

Here’s the link to our Discord server if you haven’t joined us yet! We have an active community of thoughtful and experienced traders who chime in throughout the day, and several channels dedicated to intraday and weekly trading.
You can join our discussion every day when we discuss markets in real-time via our Geeks Live livestream, now available to everyone for free via the homepage!
If you’re interested in accessing our tools and analytics, be sure to check out our website! We have a lot of updates in the works, and we have 2 primary membership tiers that you can read more about by clicking here: All About Our Memberships
If you’re interested in learning more about our strategy and approach, we address all of these topics in our Geek University course which is included in all memberships.
We posted a YouTube video today, as mentioned at the beginning of the newsletter, and we have useful and educational playlists, so give our channel a look if you’re curious about recent market commentary and ideas as well as gamma (GEX) concepts explained.
Thanks for being part of our community and know that we invite your feedback!
The information provided by Geeks of Finance LLC is for educational purposes only and is not intended to be, nor should be construed as, an offer, recommendation or solicitation to buy or sell any security or instrument or to participate in any transaction or activity. Please view our Investment Adviser Disclaimer and Risk Disclosure.