
Initial SPX DOwnside Objective Reached: October 12 Stock Market Preview
Tonight’s YouTube video takes a look at the post-mortem carnage of Friday’s bull grill (all steaks served rare), but we also packed it with some quick GEX insights on CRWD, GLD, GOOG, and PLTR, so check it out if you have a few minutes!
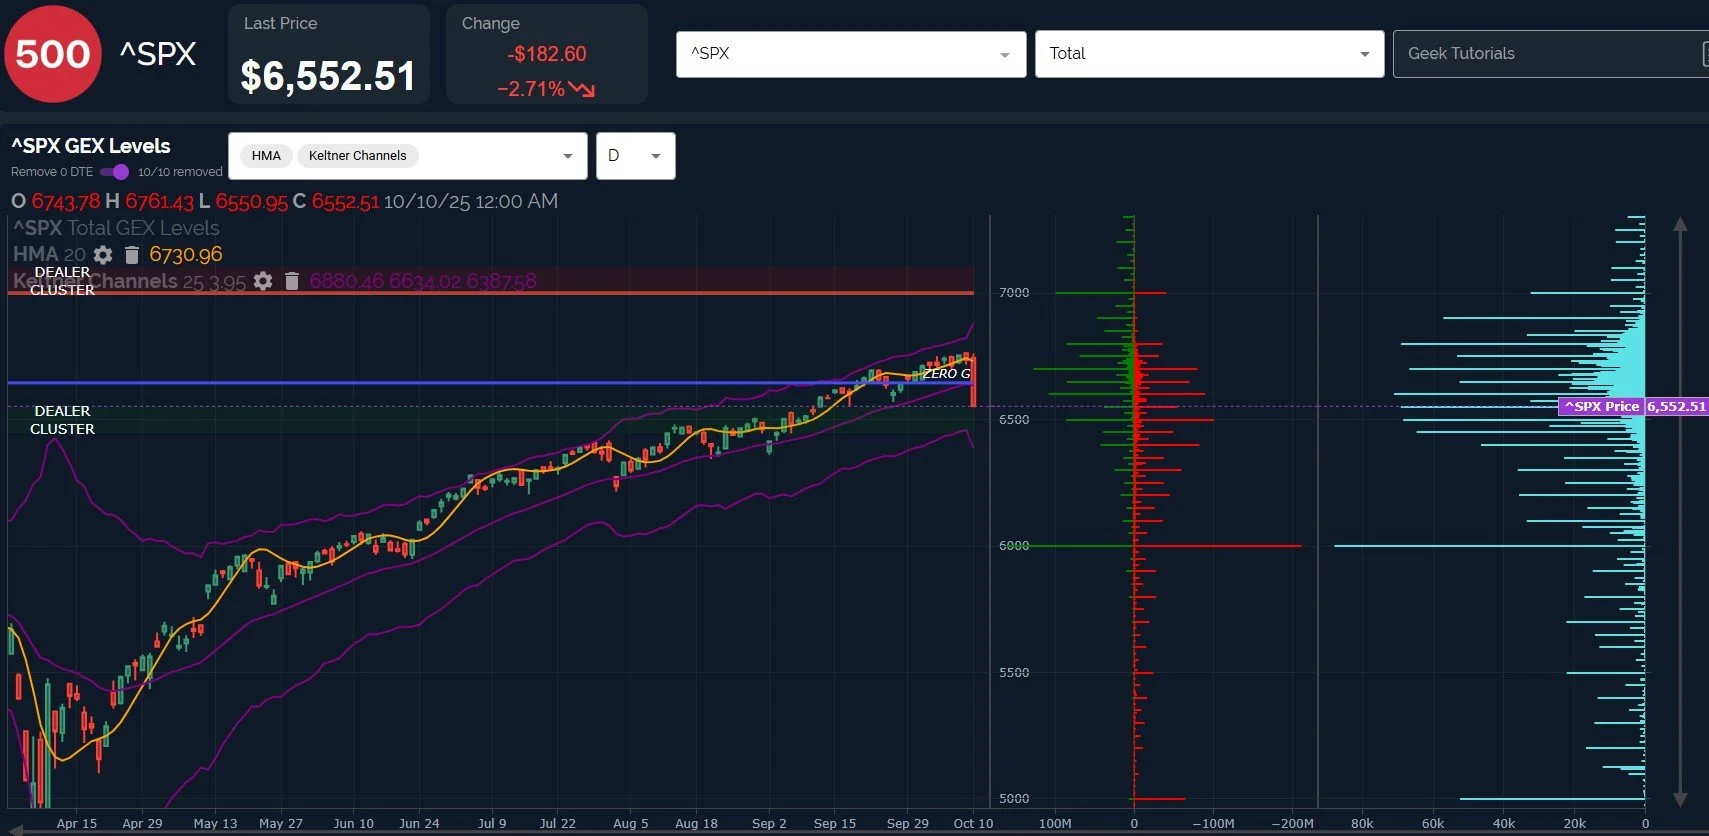
Pullbacks are never easy to navigate, and Friday was no exception. An initially bullish GEX picture gave way quickly to a complete flip to the negative, though the pivot levels still worked great, and GEX gave clear signals as the day progressed as to where countertrend rallies were likely to stop, and where we were ultimately headed.
We were seemingly vindicated on our recent warnings of the VIX pattern, the likely initial target of 18-20 (with 25 being possible), and SPX reaching 6500-6600 (we stopped right in the middle of the range).
The difficult decision now involves what to do with the big move down Friday and the potential to start out Monday with a gap up (well, not for bonds, since the bond market is closed for Columbus Day, continuing a long tradition of bonds involving the laziest of traders).
Forget the news, it’s OpEx week, it’s time to consider positioning and charts. Friday’s selloff covering so much territory in such a short timeframe likely means an immediate bounce is imminent. I’m cheating a little, because we see futures are positive in a big way, but I would have said the same thing if I was typing this Friday evening after simply looking at the same data points we’ll highlight. 6700 becomes an important support-turned-resistance area.
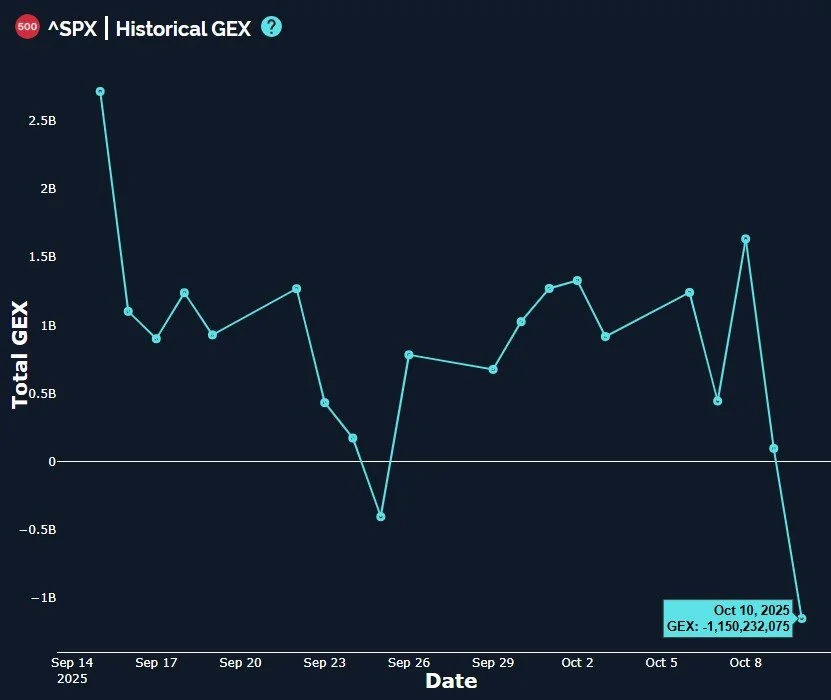
Let’s look at our Historical GEX graph for SPX, which gave us a great forewarning that I brought up Thursday evening when we highlighted the big -1.5B drop in SPX GEX by Thursday’s close.
SPX saw another huge drop, now to a “solid” bearish reading of -1.15B.
The important implications of negative GEX readings this deep typically revolves around expectations of greater overall volatility and (eventually, especially at extremes) market bottoms, which shouldn’t be a surprise historically given markets biases of trending higher over time. Given the historical nature of the rally since April, how deep will this selloff go?
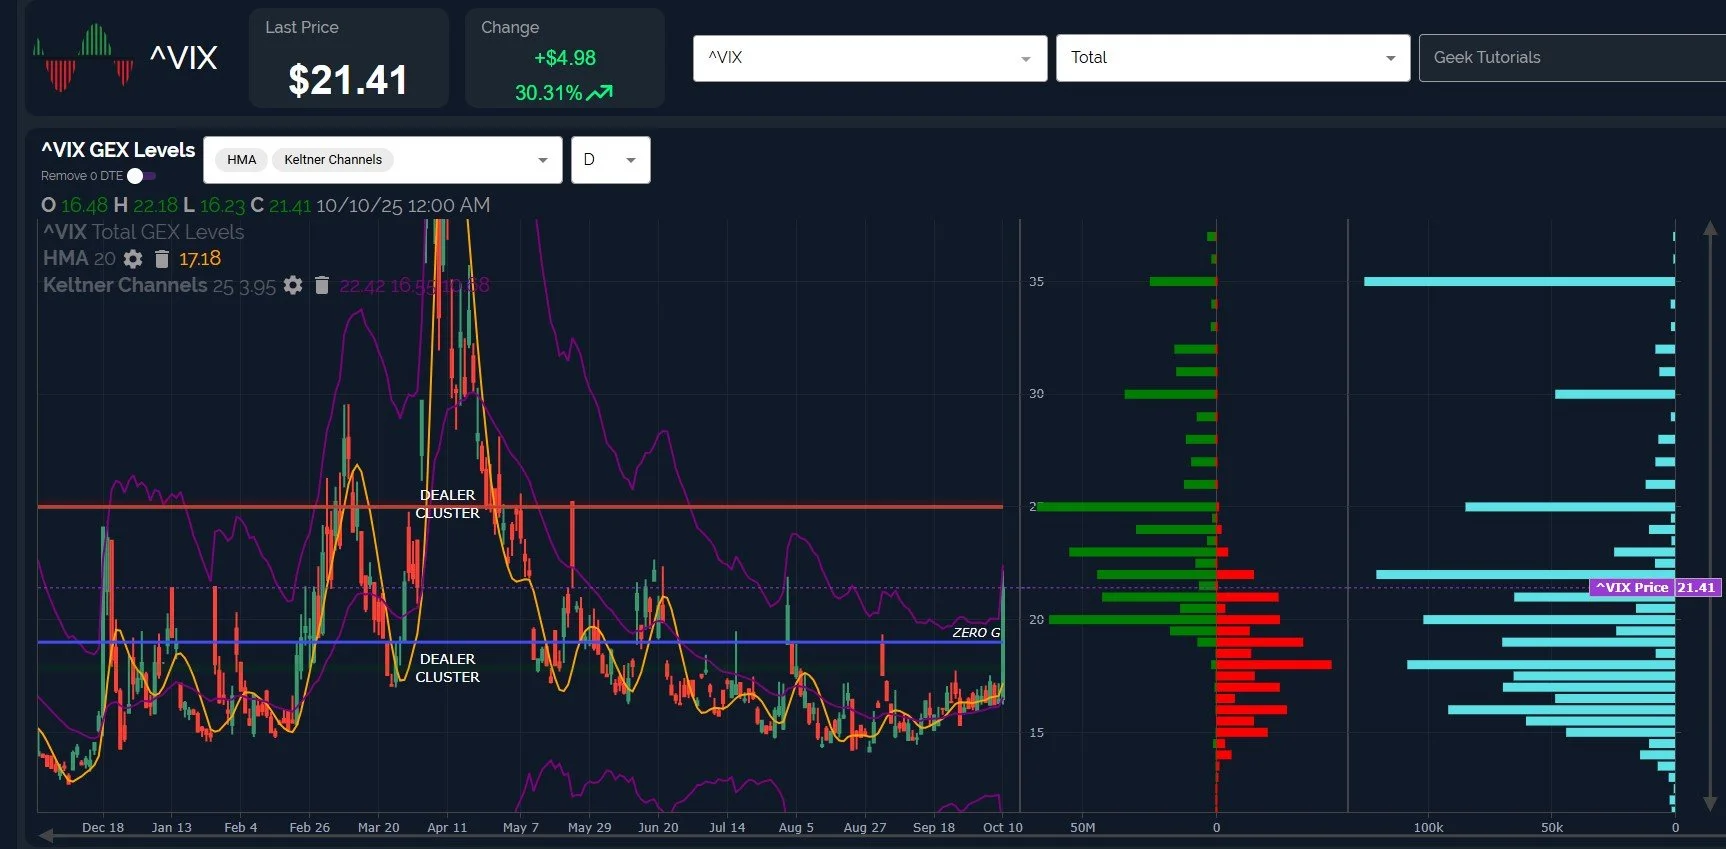
The VIX reached the upper Keltner channel, topping over 22, and 25 certainly seems probable before this drop is finally over.
Tactically, in the very short run, we want to see what happens at the large GEX cluster you see at the 20 strike on the chart below, with a drop below 20 targeting 18 as a potential resistance-turned-support and the current lower Dealer Cluster zone. Holding the 18-20 area sets up another spike toward 25 and possibly higher.
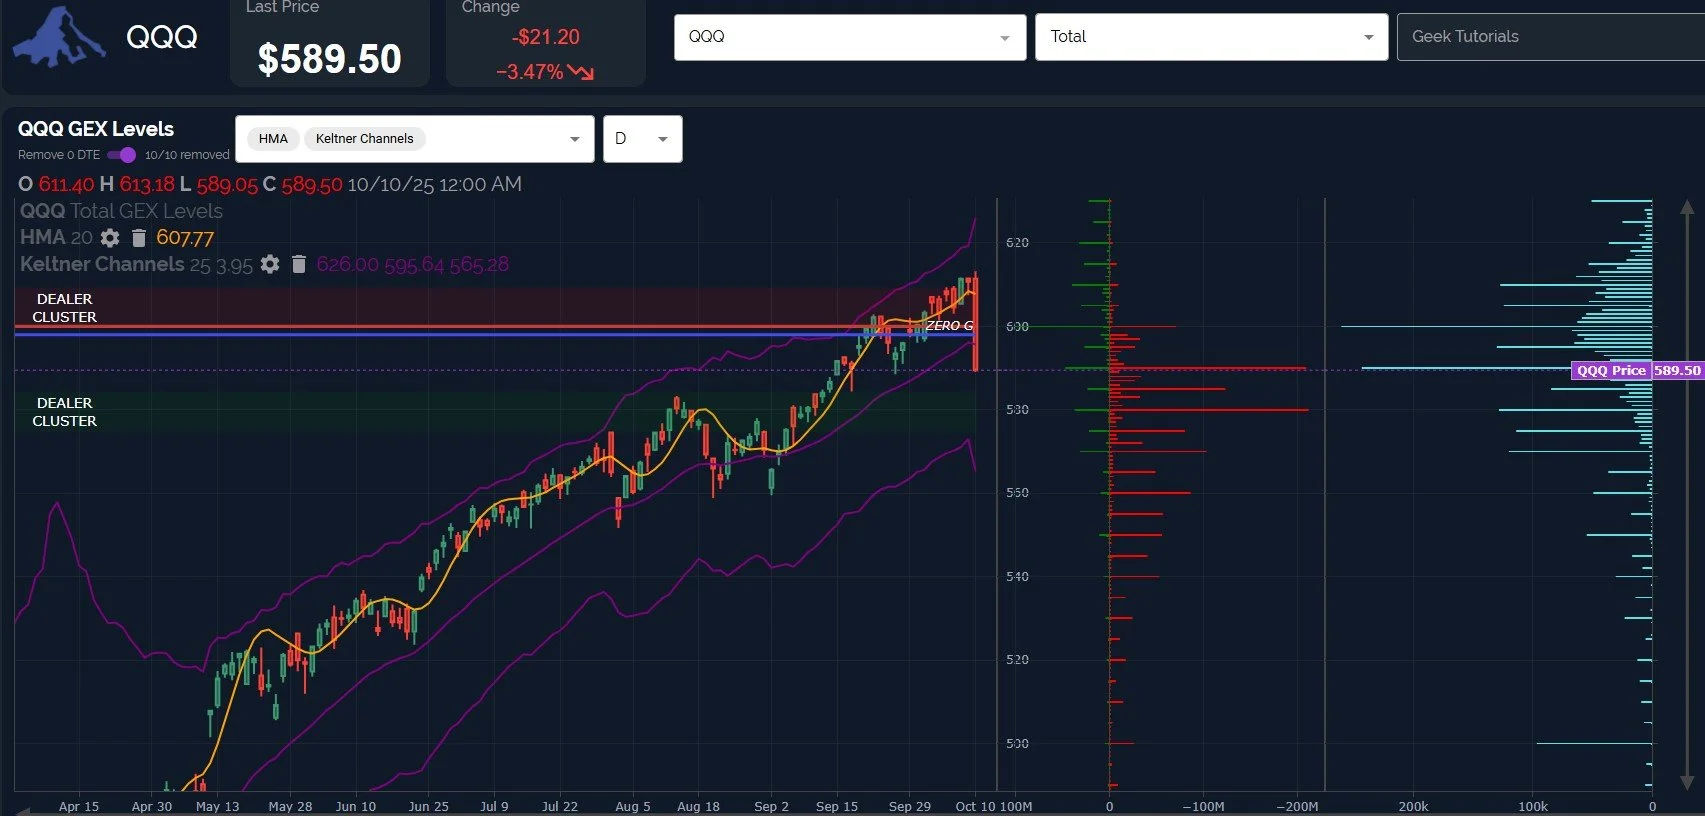
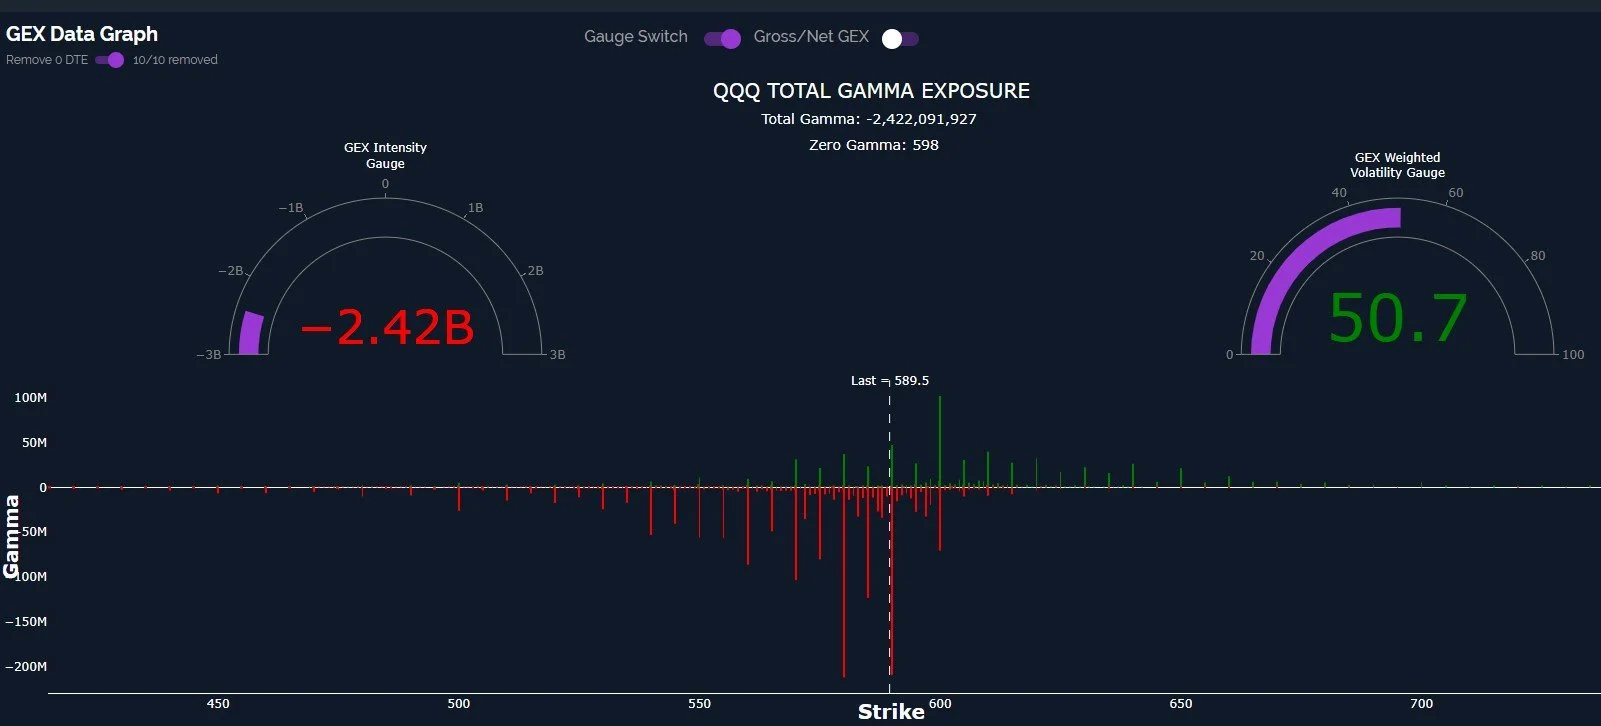
We have mentioned QQQ 580-590 as a possible pullback target given the GEX picture that was staring at us for days, and we reached 589.50, technically within the zone.
600 is now an important resistance area given the large negative GEX visible, and 610 above that, all which are possible during the notorious P.I.G. (Puts Incinerated Gratuitously) Week of OpEx.
Similar to SPX, the true test of whether or not the trend has actually shifted will be upon a retest of higher levels: Previous shallow pullbacks recovered quickly, allowing the uptrend to continue without indicators having a chance to paint a picture toward lower targets.
With attention toward the lefthand side of the graph below, you see our GEX Intensity Gauge almost at an extreme. This gauge compares current GEX against historical GEX readings over the last 52 weeks.
Extreme readings have proven to be good bottoming signals in the short run.
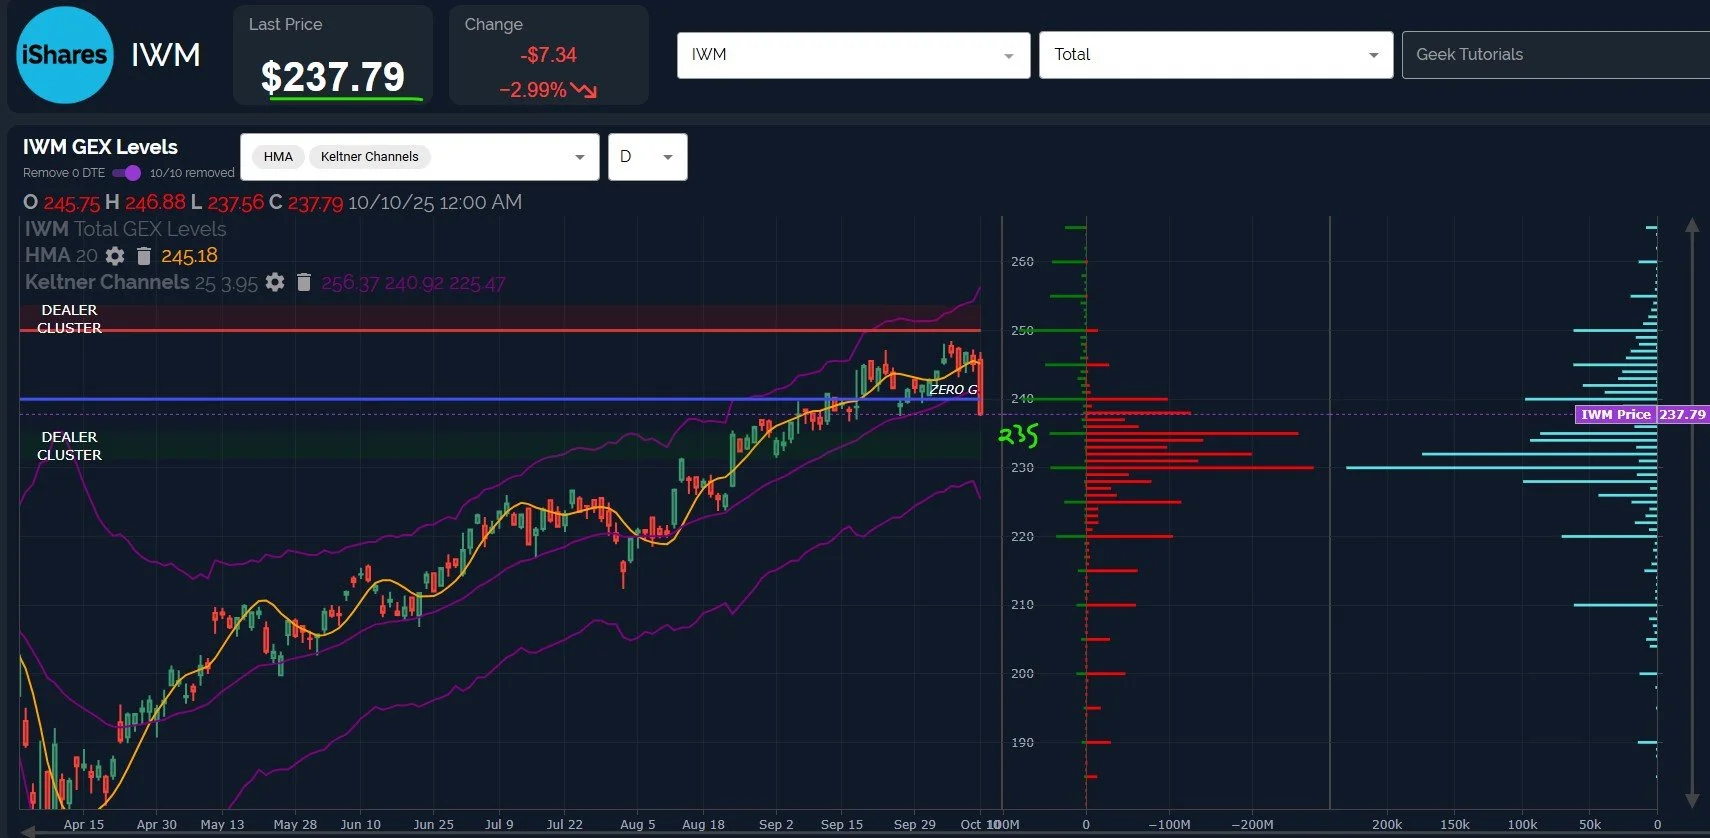
While not an exact hit, IWM closed not far from the 230-235 zone we identified as a likely zone where we would add new long positions.
Volume (light blue) was still heavy at 230 on Friday, though a retest of 240-245 may happen before another attempt to push lower.
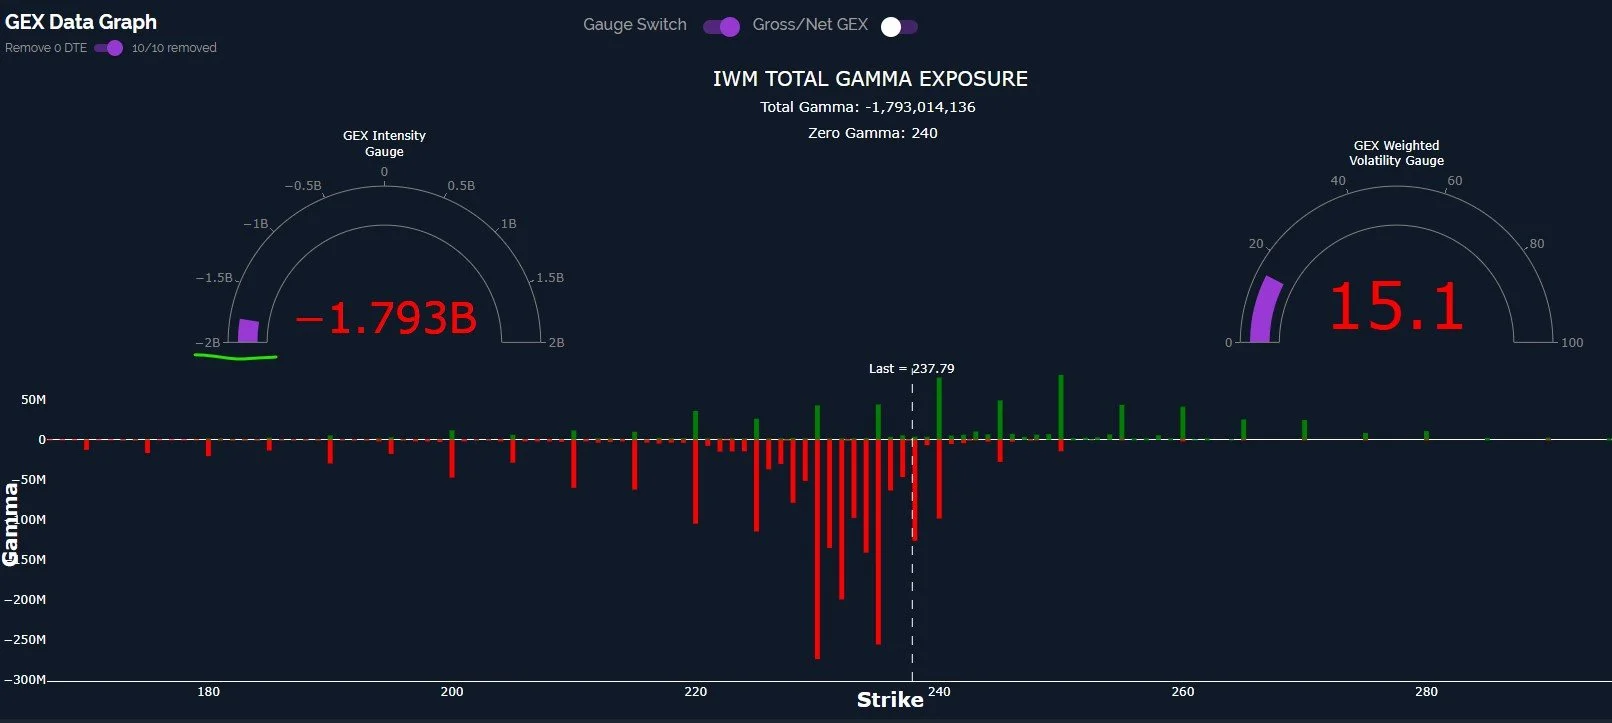
IWM was also near a GEX Intensity extreme, signaling a potential imminent bounce back up toward 240+.
We hope you’ll join us in Discord this week, where we’ll share a bit more than usual in our free General Chat. Hopefully we will see some helpful GEX positioning indications that can translate to meaningful moves inside the portfolio. Thanks in advance for joining us and for reading!
Here’s the link to our Discord server if you haven’t joined us yet! We have an active community of thoughtful and experienced traders who chime in throughout the day, and several channels dedicated to intraday and weekly trading.
You can join our discussion every day when we discuss markets in real-time via our Geeks Live livestream, now available to everyone for free via the homepage!
If you’re interested in accessing our tools and analytics, be sure to check out our website! We have a lot of updates in the works, and we have 2 primary membership tiers that you can read more about by clicking here: All About Our Memberships
If you’re interested in learning more about our strategy and approach, we address all of these topics in our Geek University course which is included in all memberships.
We posted a YouTube video today, as mentioned at the beginning of the newsletter, and we have useful and educational playlists, so give our channel a look if you’re curious about recent market commentary and ideas as well as gamma (GEX) concepts explained.
Thanks for being part of our community and know that we invite your feedback!
The information provided by Geeks of Finance LLC is for educational purposes only and is not intended to be, nor should be construed as, an offer, recommendation or solicitation to buy or sell any security or instrument or to participate in any transaction or activity. Please view our Investment Adviser Disclaimer and Risk Disclosure.