
Decision Point For SPX? January 23 Stock Market Preview
You can find today’s YouTube video by clicking Community at the top of our homepage. We take a look at SPX, IWM, GLD, META, and NFLX, so check it out if you have a few minutes!
Today saw indices gap up, yet really not making substantial progress during the cash session, with SPX, QQQ, and IWM selling off during the cash session.
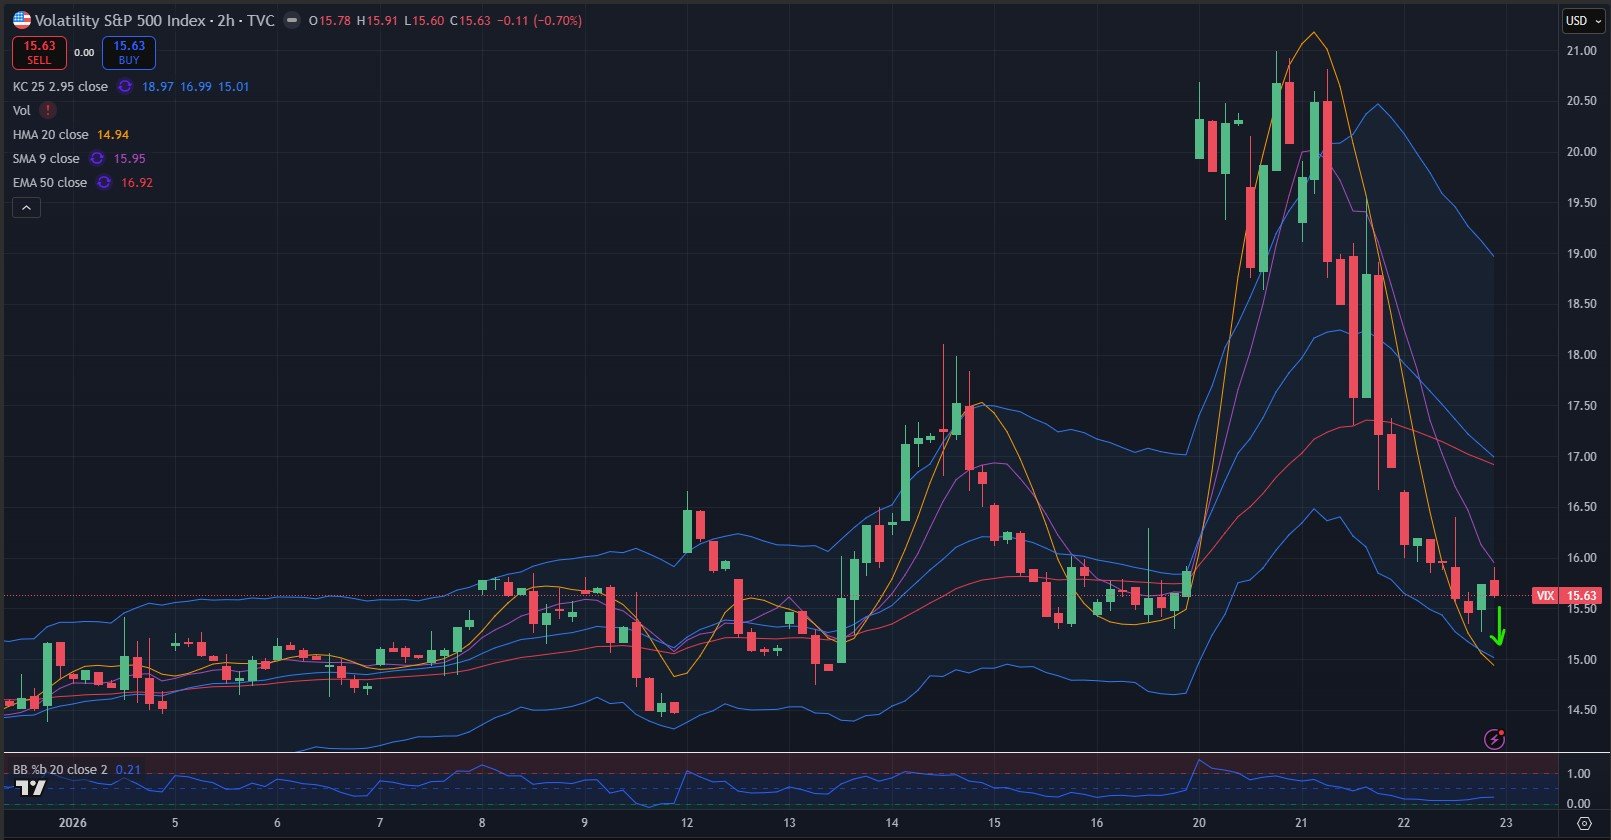
The VIX dropped yet again, with volatility rebound attempts failing. The lower Keltner channel at 15.01 is near the Hull Moving Average at 14.94, so the 2-hour chart suggests the following: It’s likely that the VIX inches closer to the high 14s-low 15s, but also, we’re likely to see a reversal in that area. We’ll pay attention to where indices are at that time.
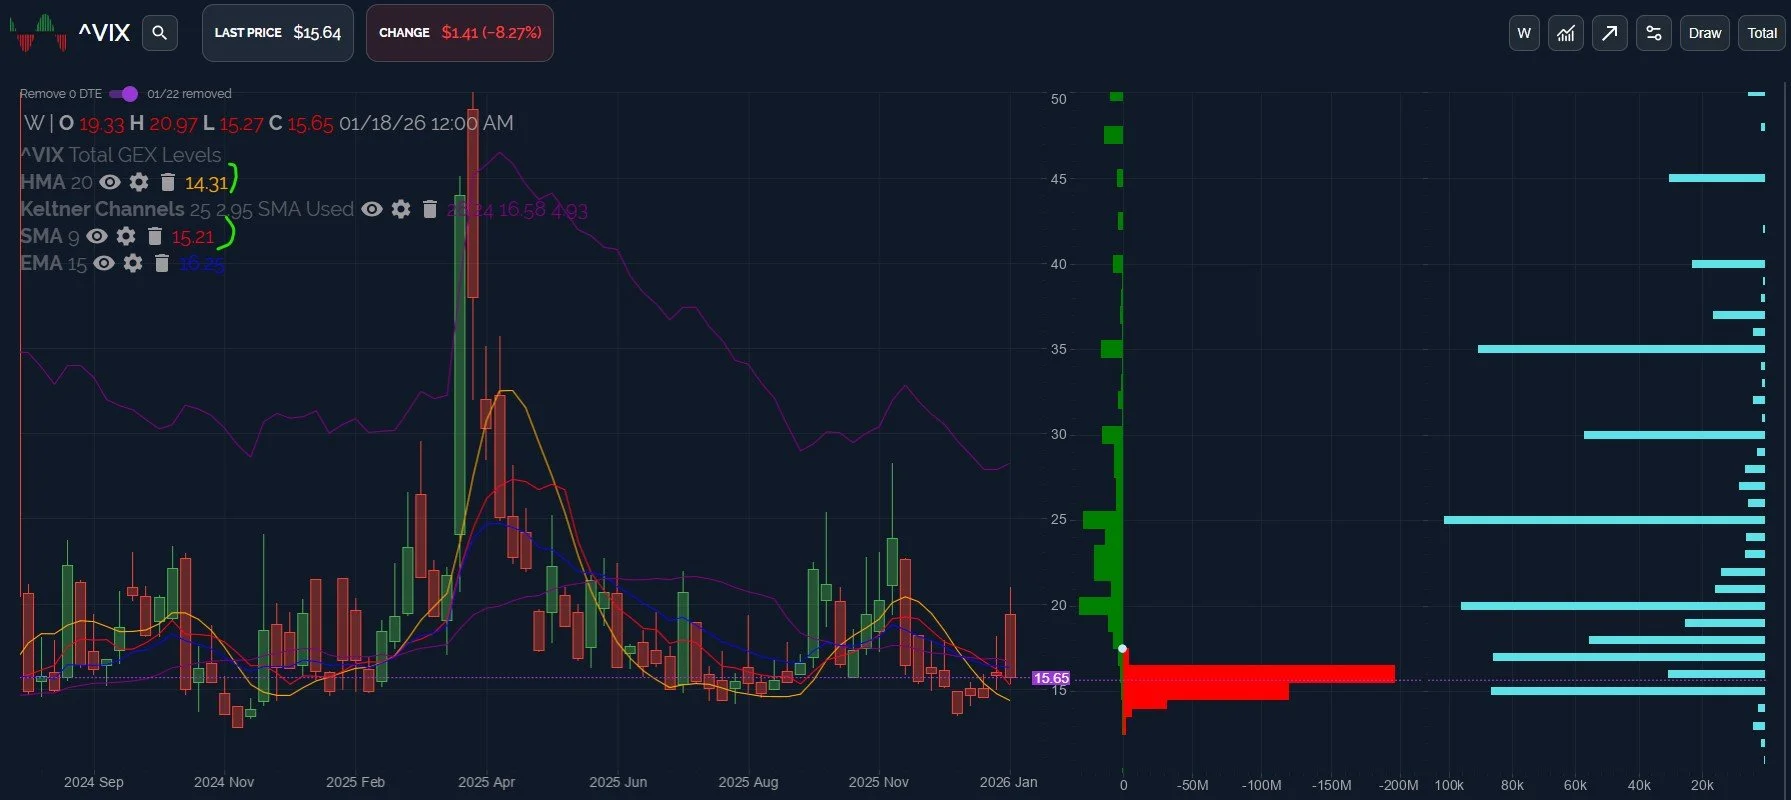
Zooming out, the weekly VIX gives us two additional areas to consider: The weekly Hull at 14.31, and the 9 SMA at 15.21. Neither of these are dramatically different than what we see on the 2-hour chart, and the VIX tends to move fast, so we can conclude our VIX commentary by suggesting a likely reversal area between 14.3 and 15.2, capturing the levels discussed on both charts.
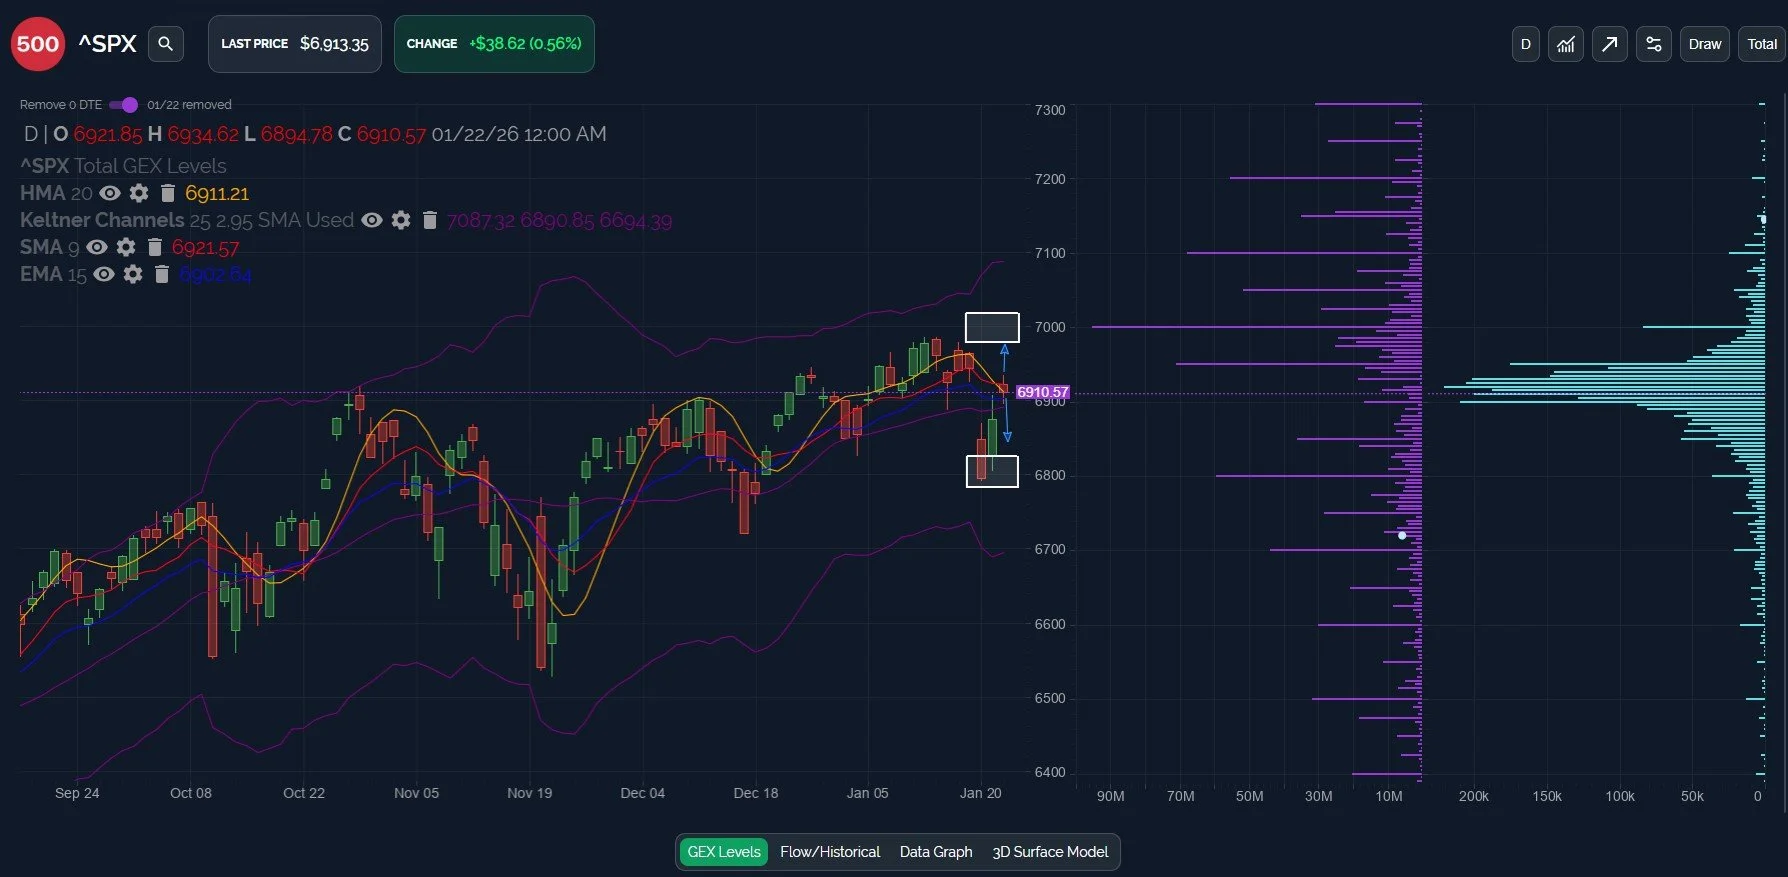
The daily chart for SPX shows a technical close above the Hull by 2 points, so SPX is right on the line where the next decision is likely to be made.
The initial attempt to break out above the Hull failed, yet today’s close leaves either possibility open: Failure back to retest lows, or a move to 7000.
Net GEX is back in positive territory, and we see substantial relative GEX at 7100+, so a test of 7000 at a minimum does appear likely as long as we hold 6900.
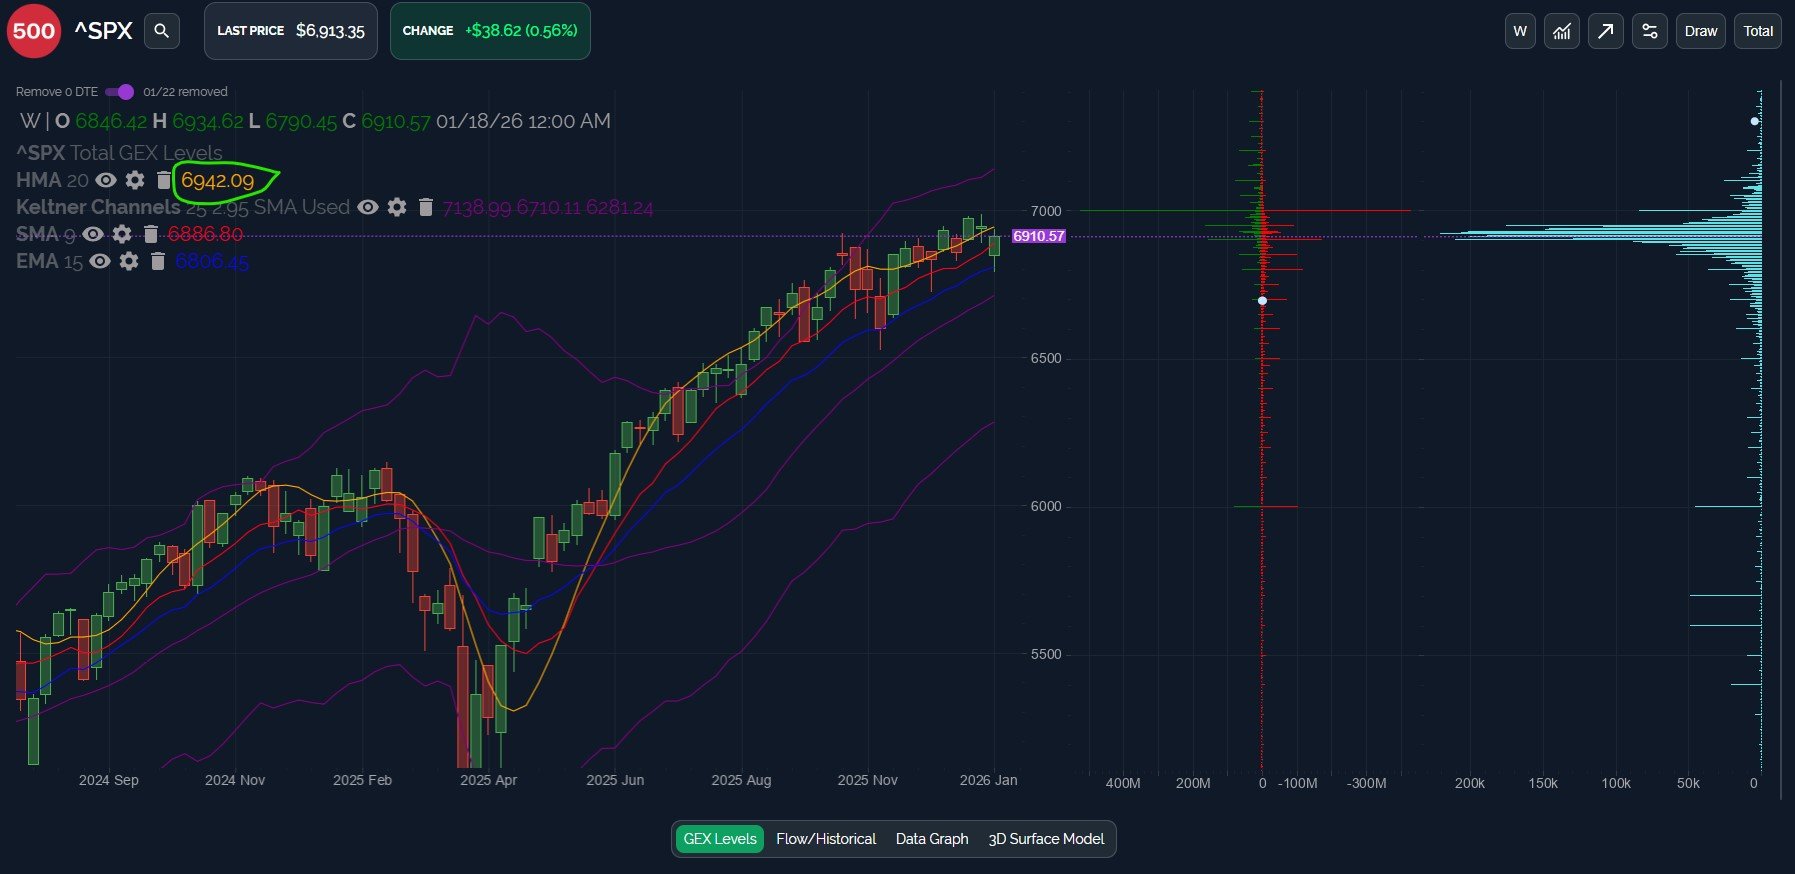
The weekly chart shows the importance of today’s resistance, with the weekly Hull at 6942, though the continued uptrend of the weekly chart and the Keltners places the burden on bears to prove a change in trend beyond a short-term dip.
Considering the GEX picture, with net GEX shown on the first chart but gross GEX shown on the chart below, it’s likely that SPX exceeding 6942 at this moment will lead to temporary stiff resistance around (or just above) 7000.
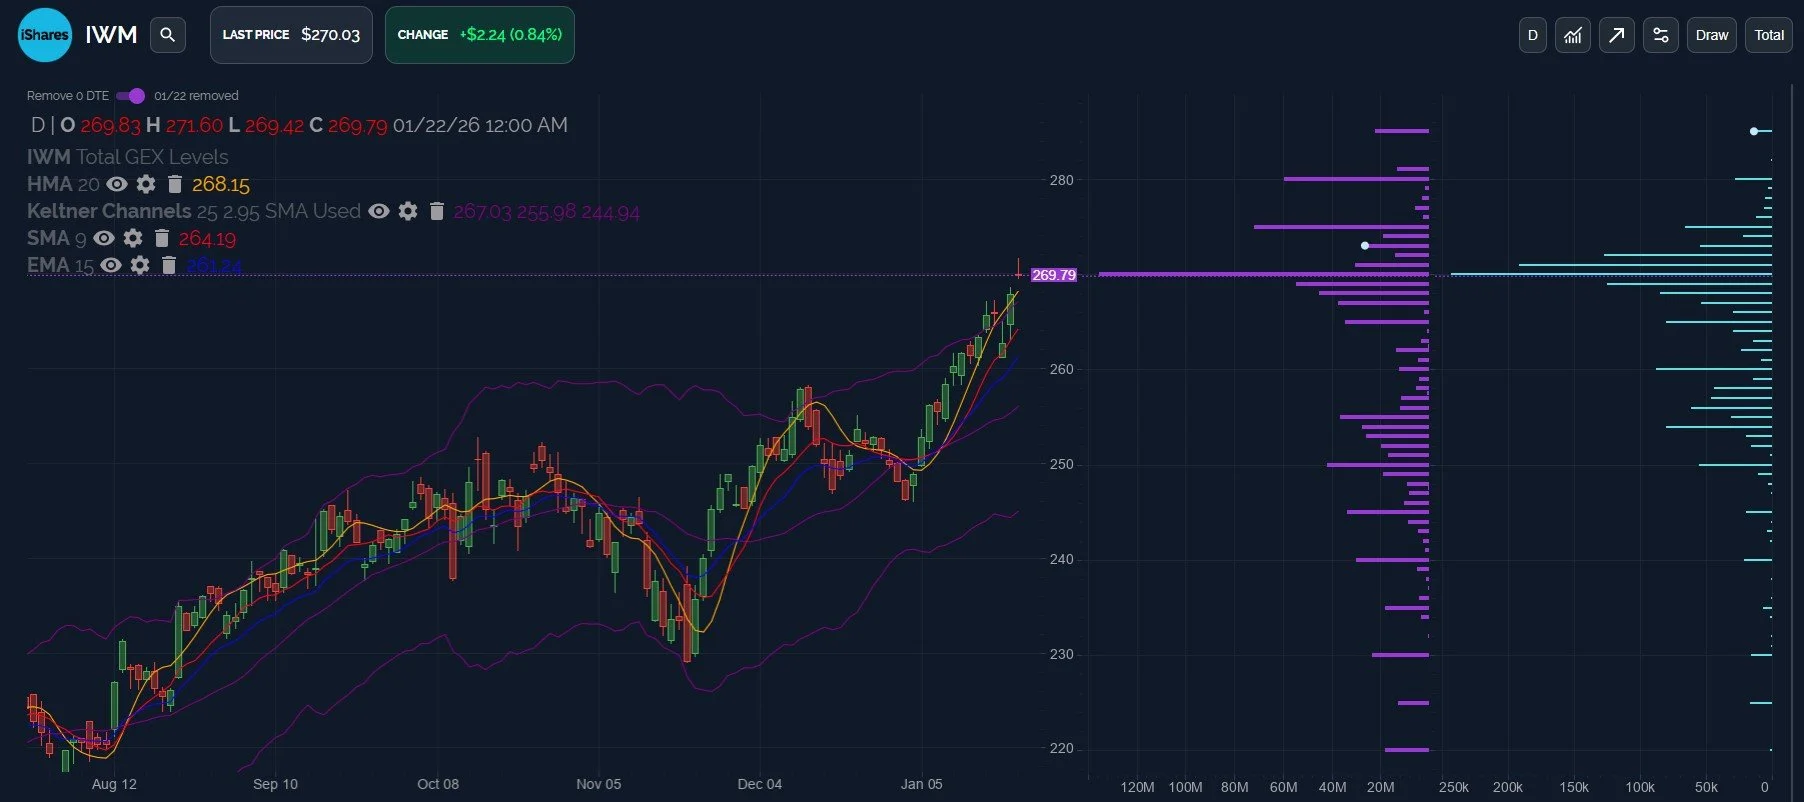
IWM still presents the most bullish case for the indices, and an argument that indices will likely reach new highs this year, at least if IWM continues to be the leading indicator that it was for much of last year.
Today’s “astronaut candle (a term I just created due to sleep deprivation, child-induced sickness and an unhealthy diet of cheetos and carob bites)” is in outerspace, at least on the daily chart.
GEX still points toward 275-280 eventually, but the cash session saw selling, bringing IWM back below 270 at the close.
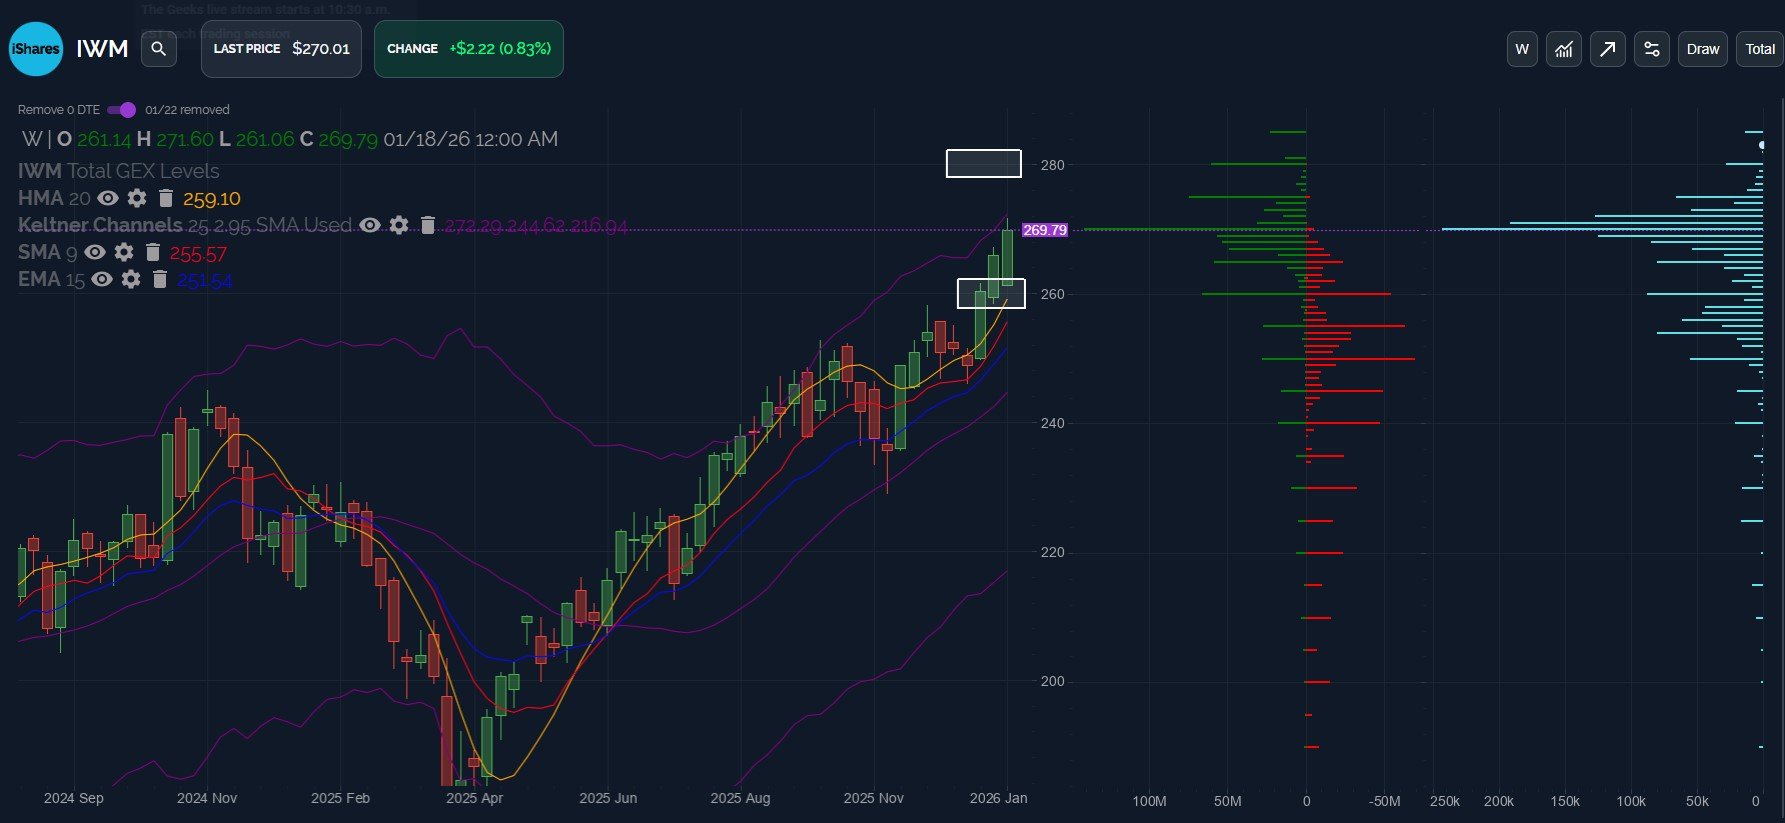
The weekly chart for IWM reveals a logical ceiling in place of a mistaken view that we were out of the earth’s atmosphere, with price rejecting mere pennies below the upper weekly Keltner channel. The gross GEX picture reveals 260 as a potential line-in-the-sand, with 255 as the most likely target below.
A pullback for IWM seems likely, but the uptrend is also likely to continue as long as 255-260 is held.
We’ll post 0 DTE (intraday) data tomorrow as we navigate the last trading day before the weekend, and we hope you’ll join us!
If you haven’t joined us yet in Discord, go to our homepage and click on Community to enter our Discord server! First-time guests receive a free 7-day trial of the premium Discord channels and this is where we discuss what’s happening in real-time.
Thanks for being part of our community and know that we invite and appreciate your feedback!
The information provided by Geeks of Finance LLC is for educational purposes only and is not intended to be, nor should be construed as, an offer, recommendation or solicitation to buy or sell any security or instrument or to participate in any transaction or activity. Please view our Investment Adviser Disclaimer and Risk Disclosure.