
IWM & VVIX SIgnaling Trouble Ahead? January 26 Stock Market Preview
You can find today’s YouTube video by clicking Community at the top of our homepage. today’s video takes a good look at the larger (bullish, in our opinion) view of the indices as well as looking at the VIX, AAPL, and TSLA, so check it out if you have a few minutes!
This week will see a ramp up in the number of larger companies reporting, with Boeing Tuesday, MSFT and META Wednesday after the bell, AAPL Thursday after the bell, and a number of semiconductor-related names reporting throughout the week.
I mentioned that we have a bullish larger view of the market, but that doesn’t mean we won’t get pullbacks along the way, and Friday saw a number of signals we want to review that might signal an immediate pullback could precede any bullish resumptions in trend that may follow.
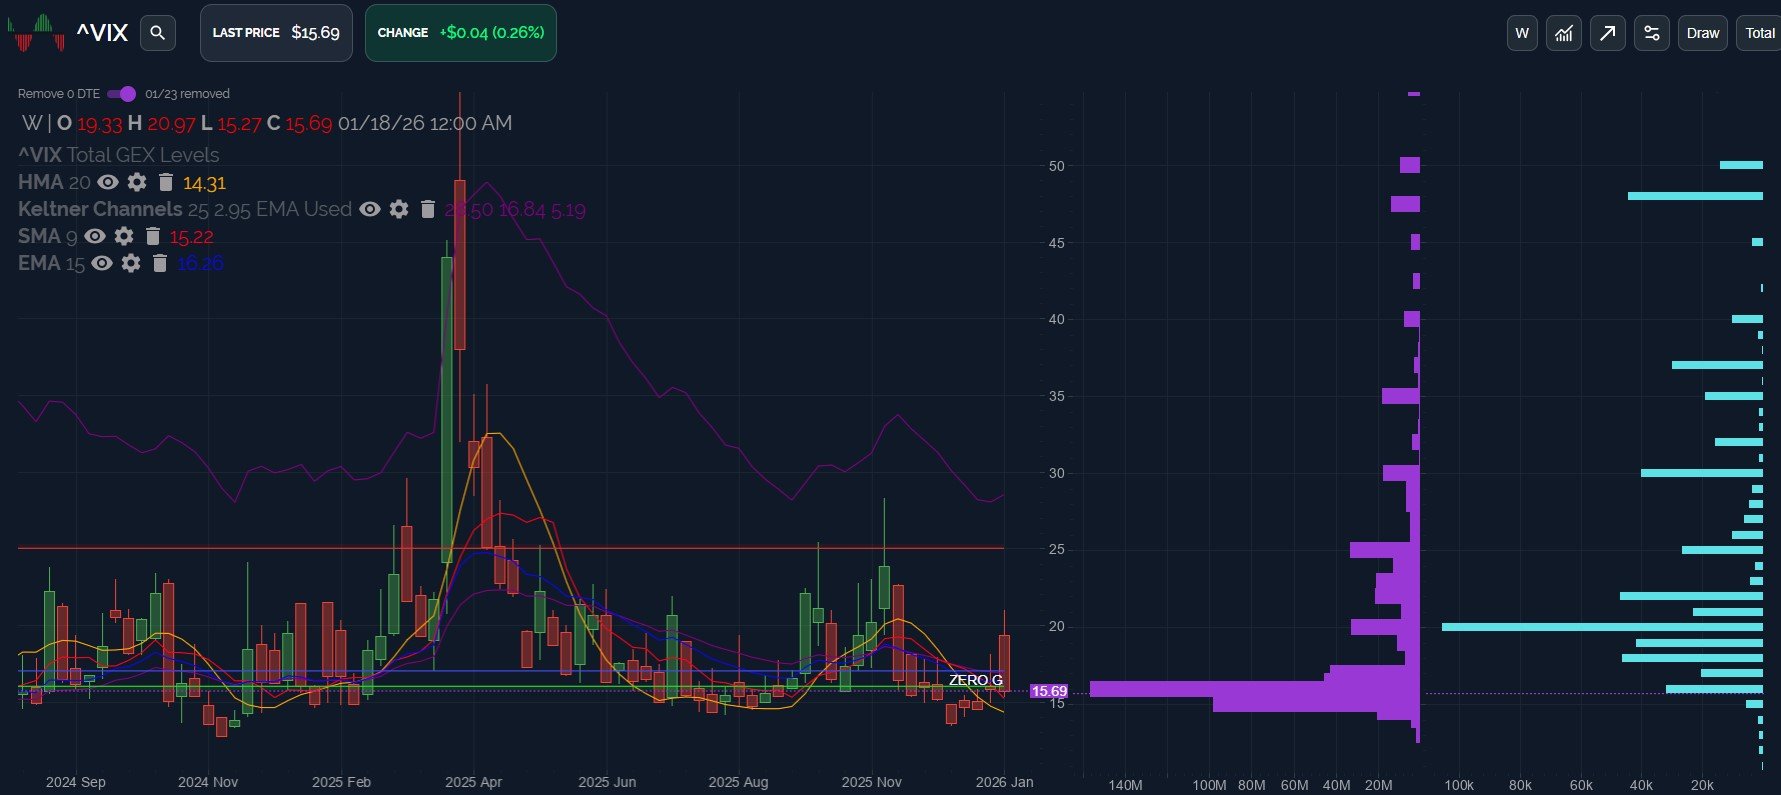
VIX weekly chart: GEX is negative, important moving averages are declining, yet the VIX is holding above these key lines (15.22 being the 9 SMA). Ultimately, a drop to 14.31 (a retest of the Hull) may be in the cards.
We also see VVIX having bounced a lot from the lows, now almost to 102, with the chart signaling that a break up resistance at 105 could take VVIX back to 120, and therefore a likely accompanying VIX spike as well.
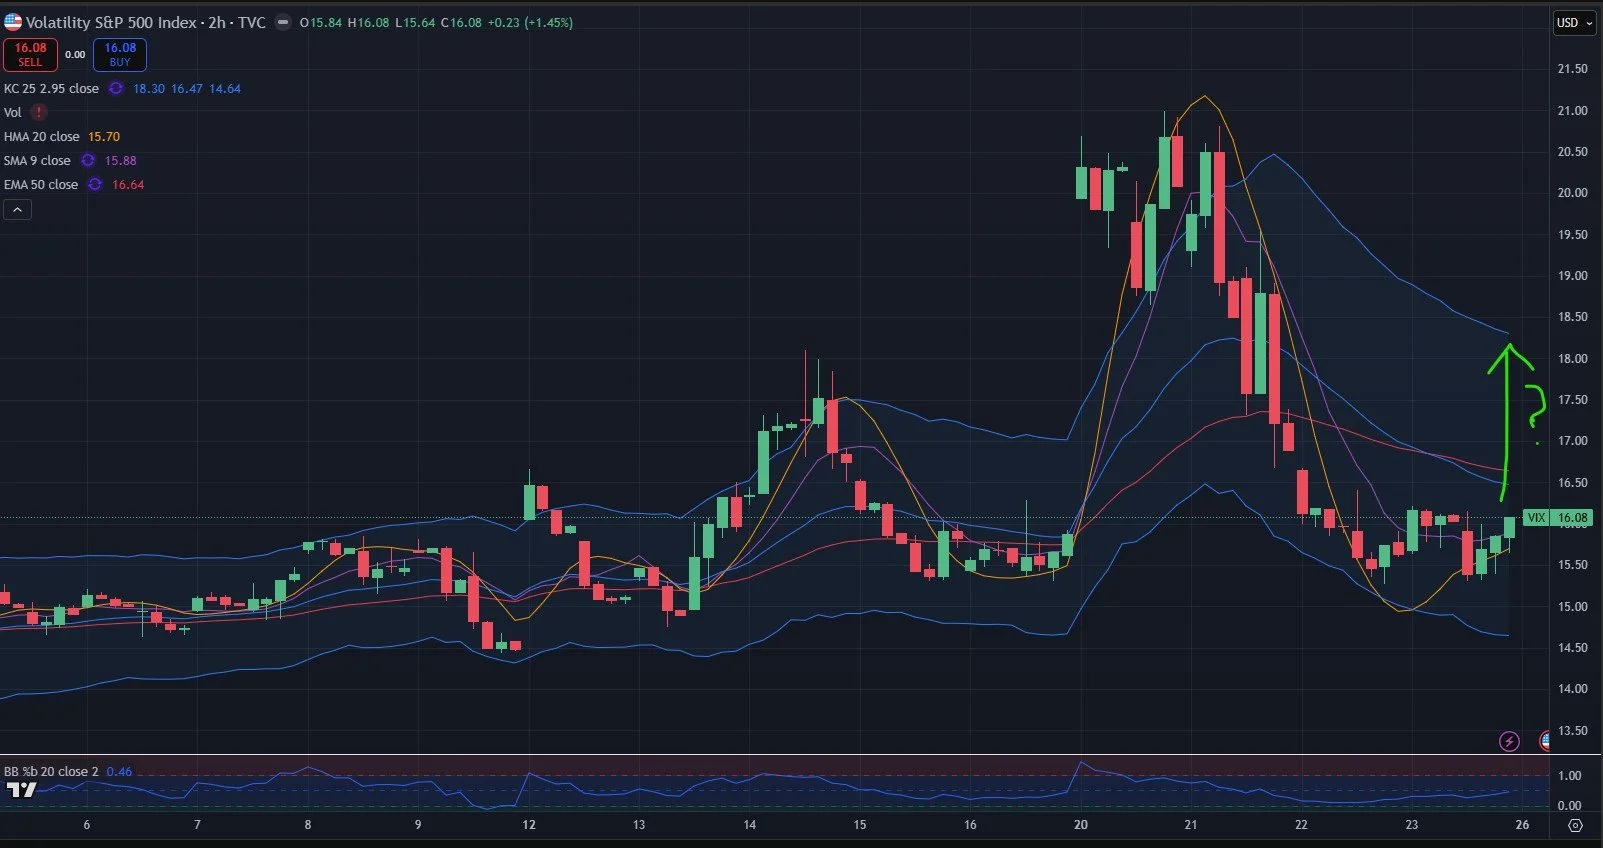
Smaller timeframe charts such as the 2-hour chart below support a view of a near-term VIX spike, with Friday showing unusual strength for the VIX as the Hull turned upward, with the VIX following.
The Keltner channels are still in decline, so a spike toward 18 could end up seeing retracement back toward the lower line again, sub-15 level.
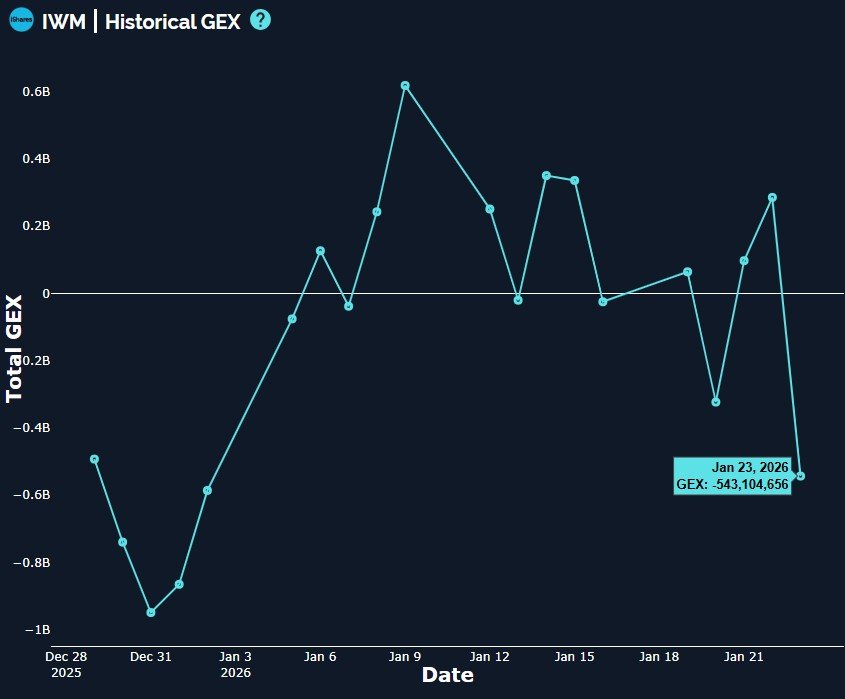
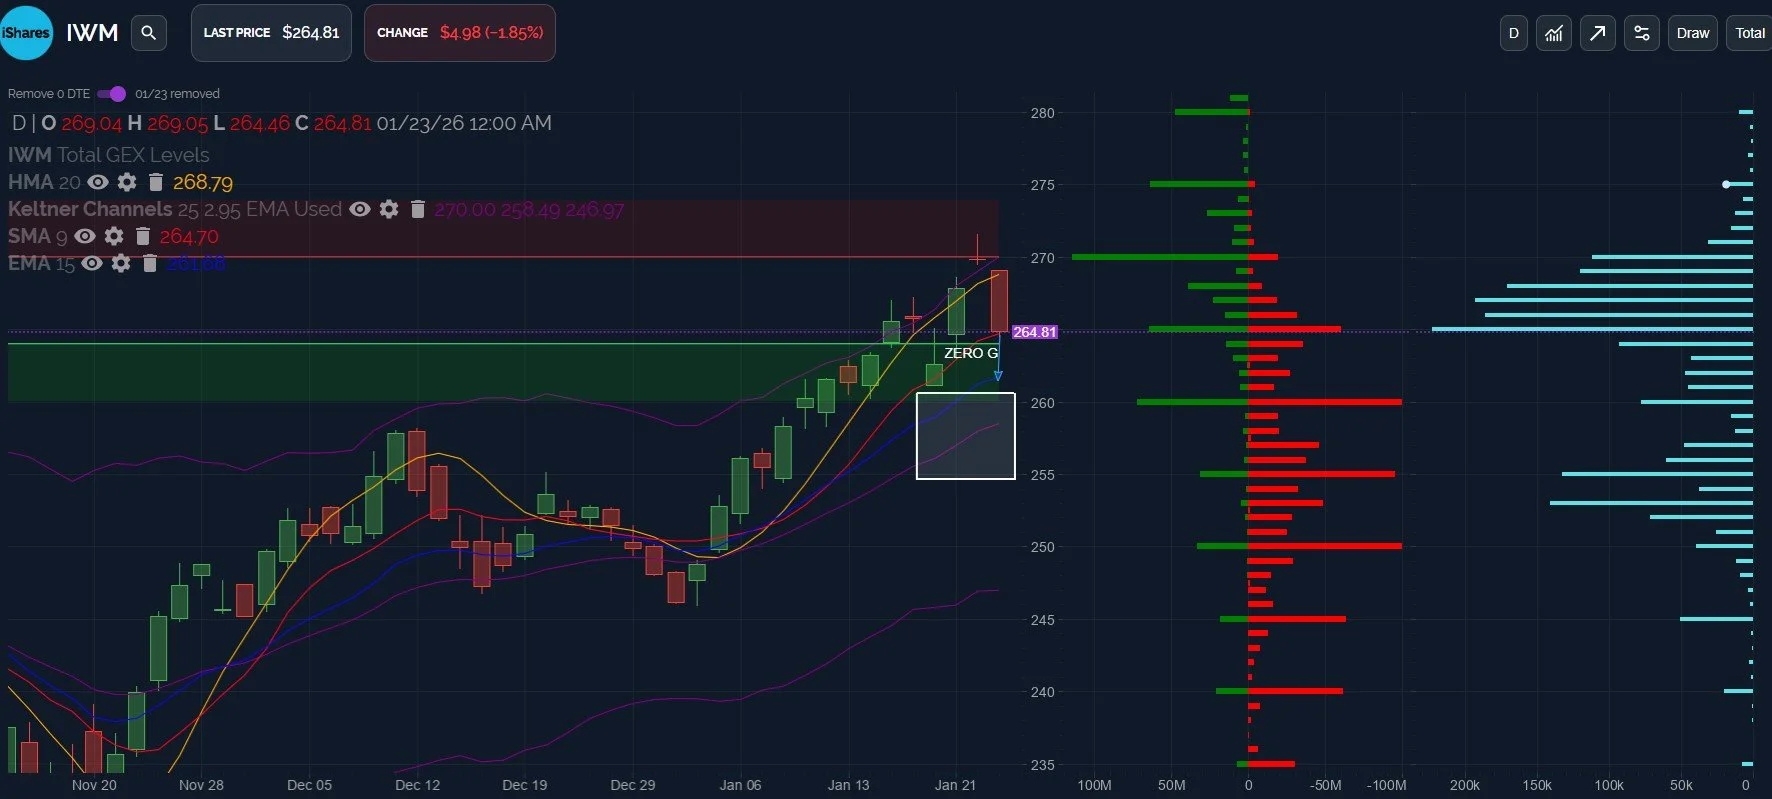
IWM saw a sharp drop in net GEX just as we saw the largest down day since the 12/12/25 top, with GEX back to readings not seen since 1/2. GEX and price action near the upper resistance that we pointed out prior to this drop may signal further weakness ahead in the short run.
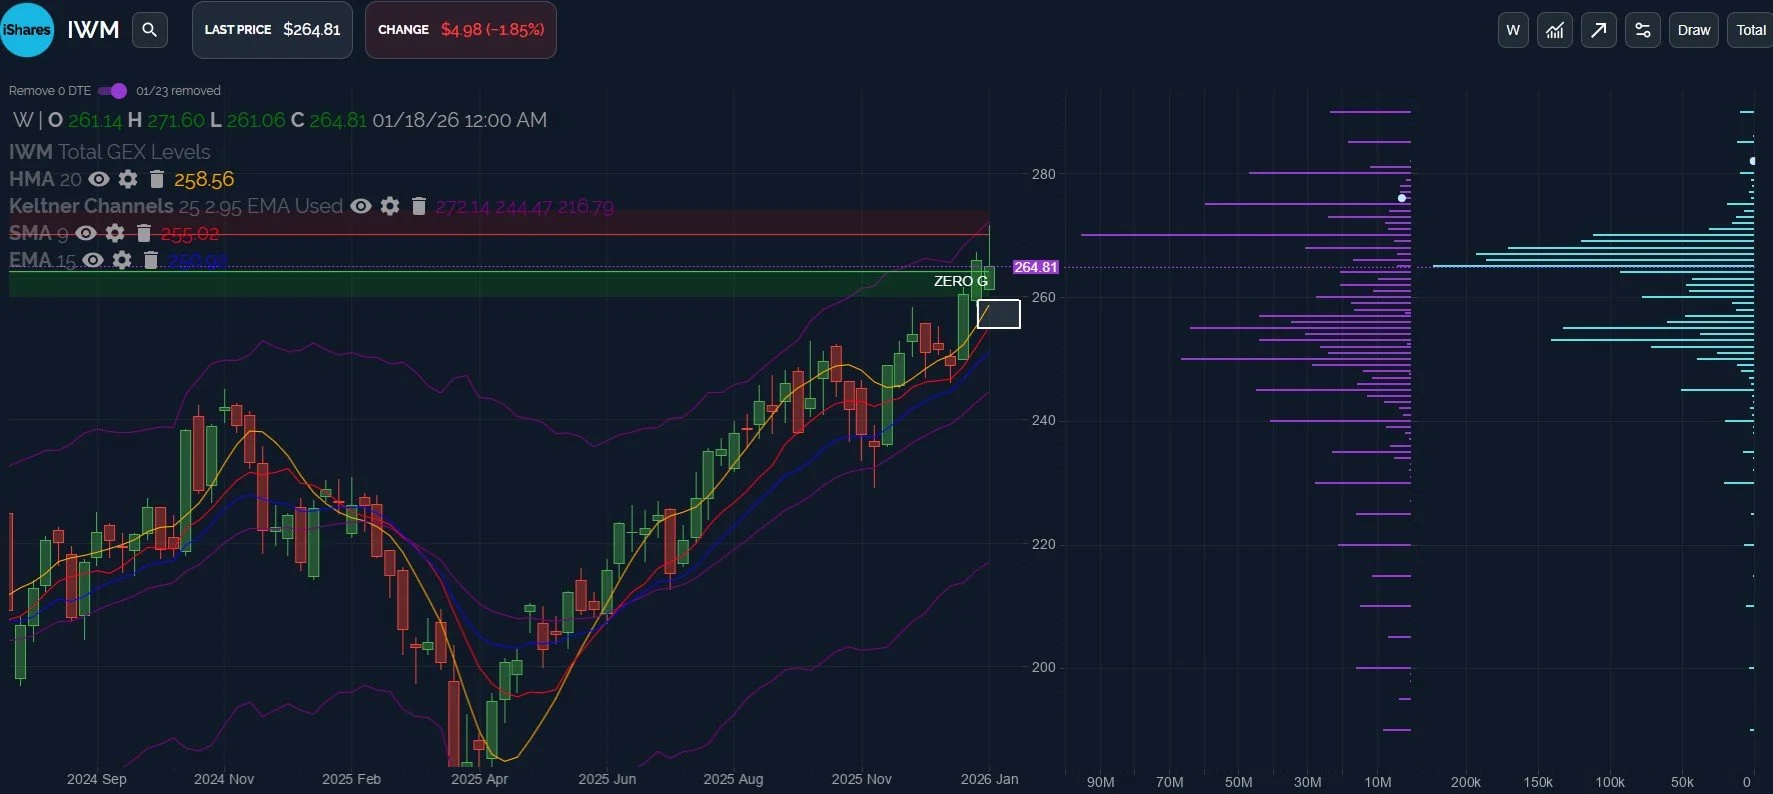
The weekly chart suggests 255-258 may be an initial zone to watch for signs of reversal, and net GEX supports that view, with large negative GEX at 255. We also see a large GEX cluster at 250 that may come into play.
The larger context with IWM is that the chart looks bullish though, with a solid uptrend and accompanying indicators that would likely require significant time and/or price destruction to shift the picture in a big way.
IWM’s daily chart (now showing gross GEX clusters instead of net GEX) is supportive of the same 255-258 zone discussed on the weekly picture, though the gross picture also reveals 260 as an important GEX area that we can throw in with 258 as being “close enough” to consider the entire area important as the upper limit of where we think a reversal back up may occur.
I personally like to see bulls a little scared and sweating when I buy, so I prefer the 250-255 area (not that the market cares what I like).
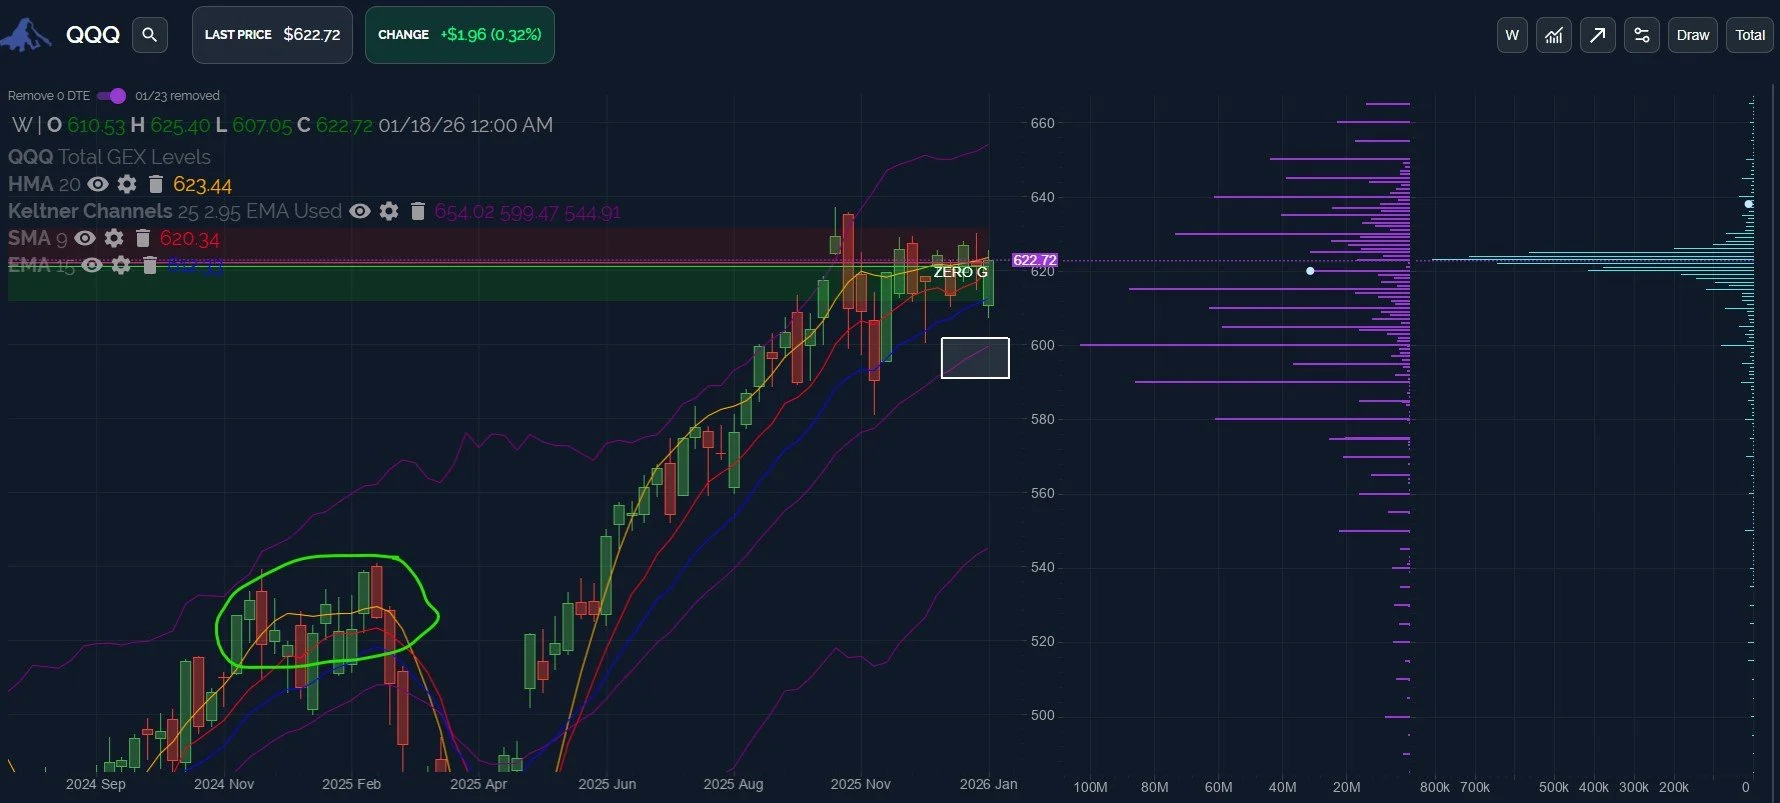
QQQ’s sideways consolidation since October remains a puzzle piece that deserves attention, particularly when combined with IWM’s bullish tendencies. Are we witnessing a 1999-2000 style rotation? I won’t bet money on that question without evidence, but following strength at the moment does not lead you to a lot of tech names, that’s for sure.
QQQ’s weekly chart shows a struggle at the neutral Hull, with price closing below the line for the 2nd week in a row. The largest GEX cluster is at 600, with 590 showing significant GEX as well.
I note the similarity of the time since October with the circled area from November to February of last year. Will this consolidation prove to be a topping pattern as well?
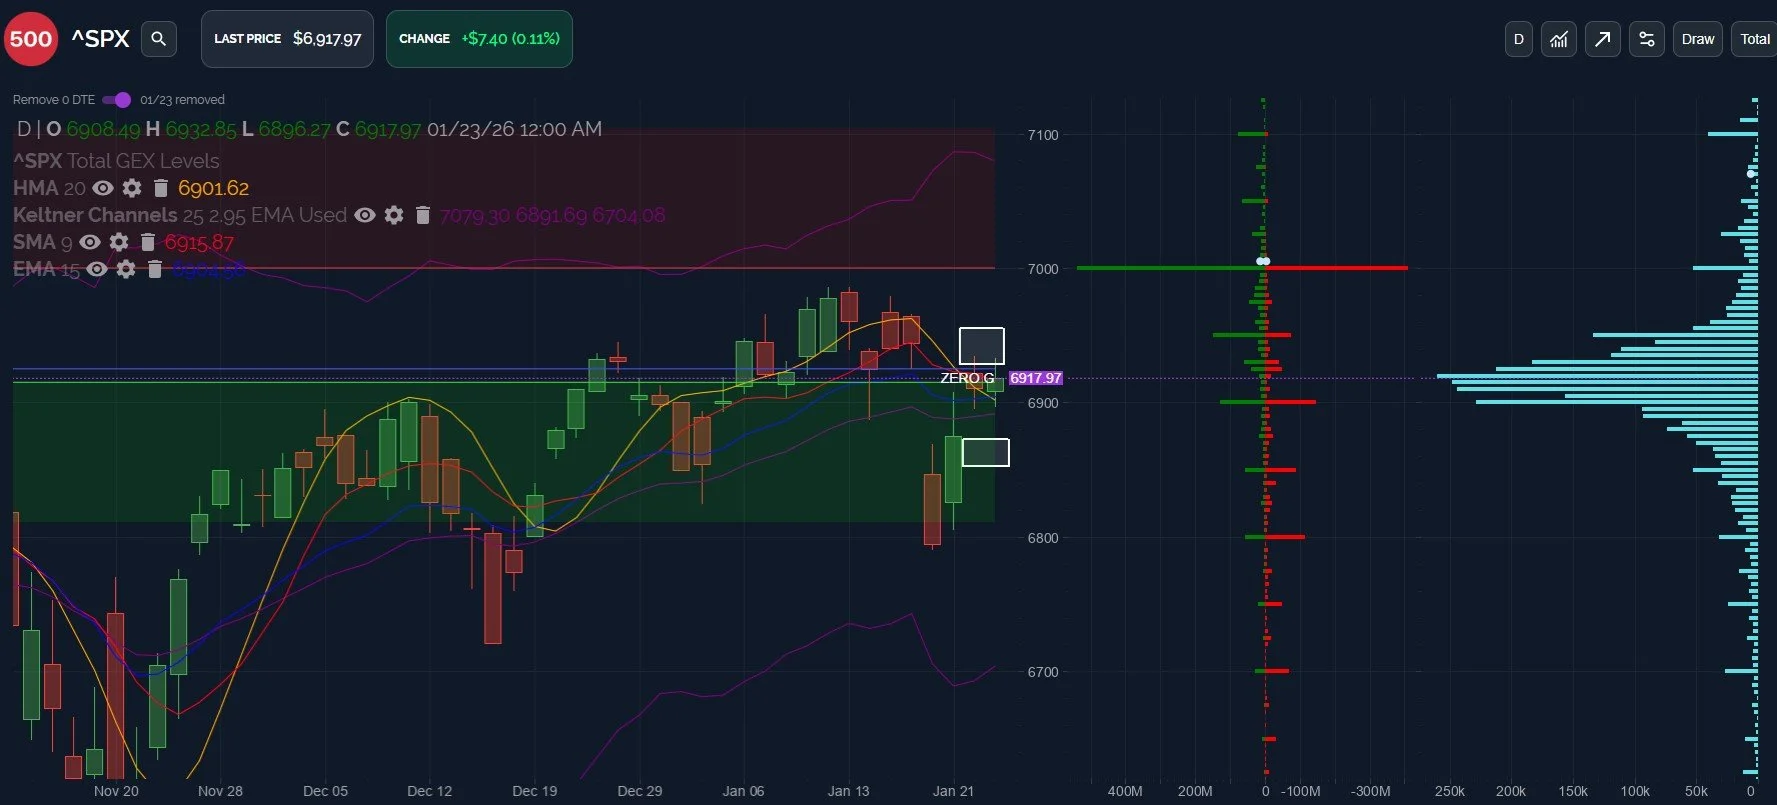
SPX appears to be in the middle, looking more bullish than QQQ, but less bullish compared to IWM. Friday’s action saw SPX close above the key Hull, yet the Hull is declining. A review of smaller timeframes reveals a likely pullback from here, though I remain constructive as long as the 6850-6870 zone holds.
On the upside, 6950 appears to be the last area of important technical/GEX resistance until 7000, so any rebound toward that area needs to be watched.
Big tech reporting mid-week as well as FOMC has potential to mark a significant shift one way or another, so be prepared for change this week, and possible mean reversion if any move early in the week gets “too” extreme. We’ll watch intraday shifts in GEX closely and we’ll keep this discussion going in Discord, so we hope you’ll join us!
If you haven’t joined us yet in Discord, go to our homepage and click on Community to enter our Discord server! First-time guests receive a free 7-day trial of the premium Discord channels and this is where we discuss what’s happening in real-time.
We also have a live stream accessible from our homepage every day around 10:30am ET, so feel free to join us there.
Thanks for being part of our community and know that we invite and appreciate your feedback!
The information provided by Geeks of Finance LLC is for educational purposes only and is not intended to be, nor should be construed as, an offer, recommendation or solicitation to buy or sell any security or instrument or to participate in any transaction or activity. Please view our Investment Adviser Disclaimer and Risk Disclosure.