
Q3 Earnings & A Warning From The VIX: January 13 Stock Market Preview
We’re offering a New Year special that will end in a few days: $300 off of the annual Portfolio Manager subscription, enter code NEWYEARS26 at checkout!
You can find today’s YouTube video by clicking Community at the top of our homepage. We take a look at SPX, the VIX, IWM, GLD, PLTR, and META, so check it out if you have a few minutes!
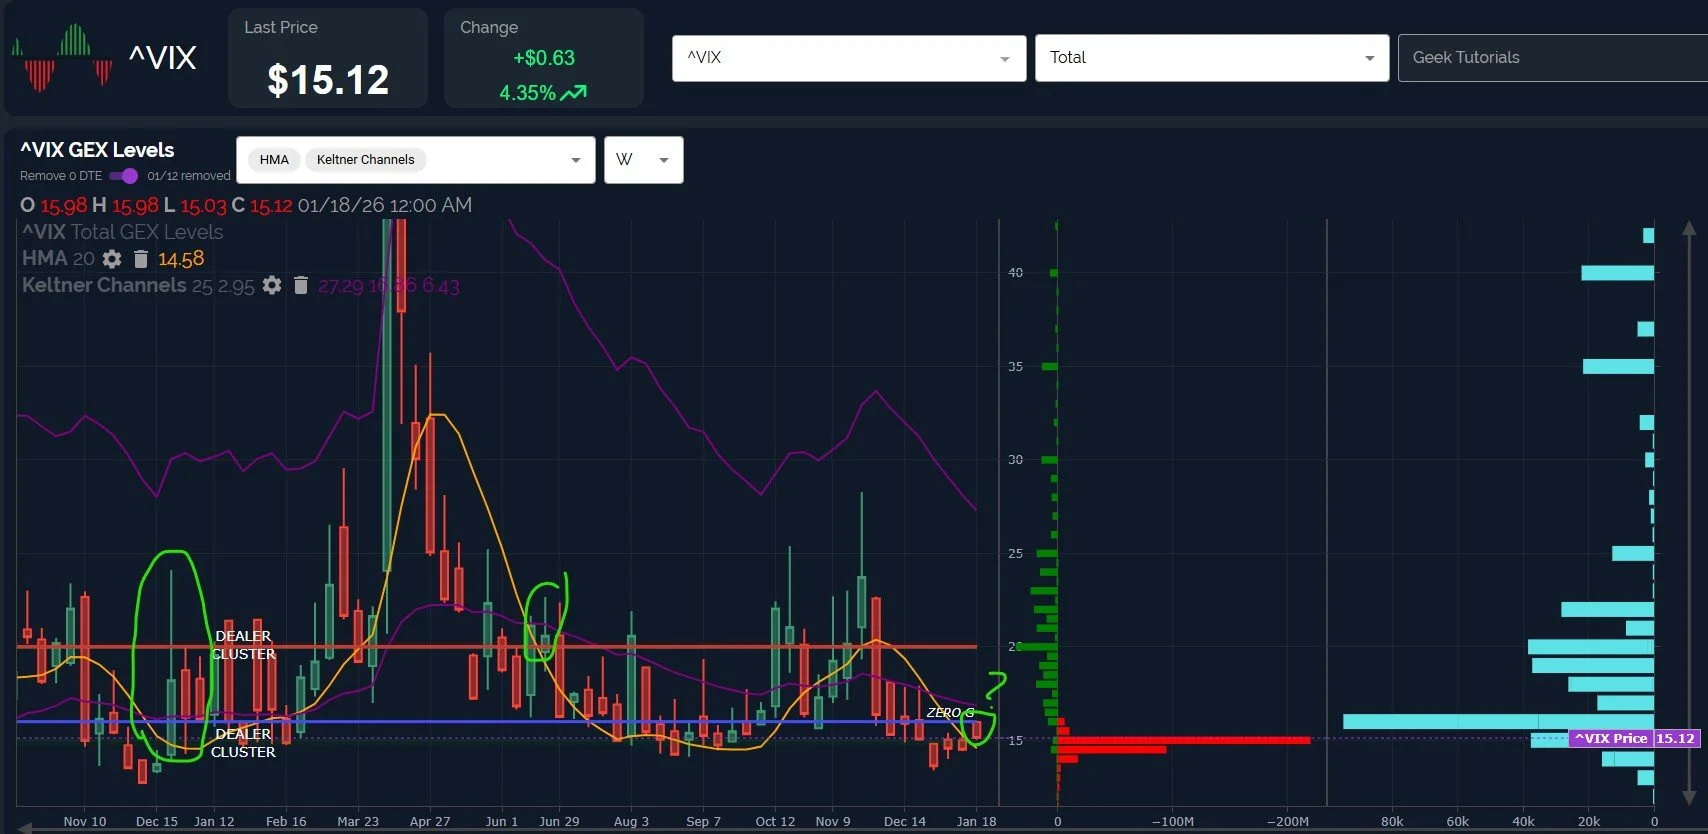
Today saw continued upside for the indices, though the VIX also regained its upward trend that was briefly interrupted by Friday’s VIX crush. How will this divergence play out, and what does the timing look like? We’ll look more closely a few sentences from now.
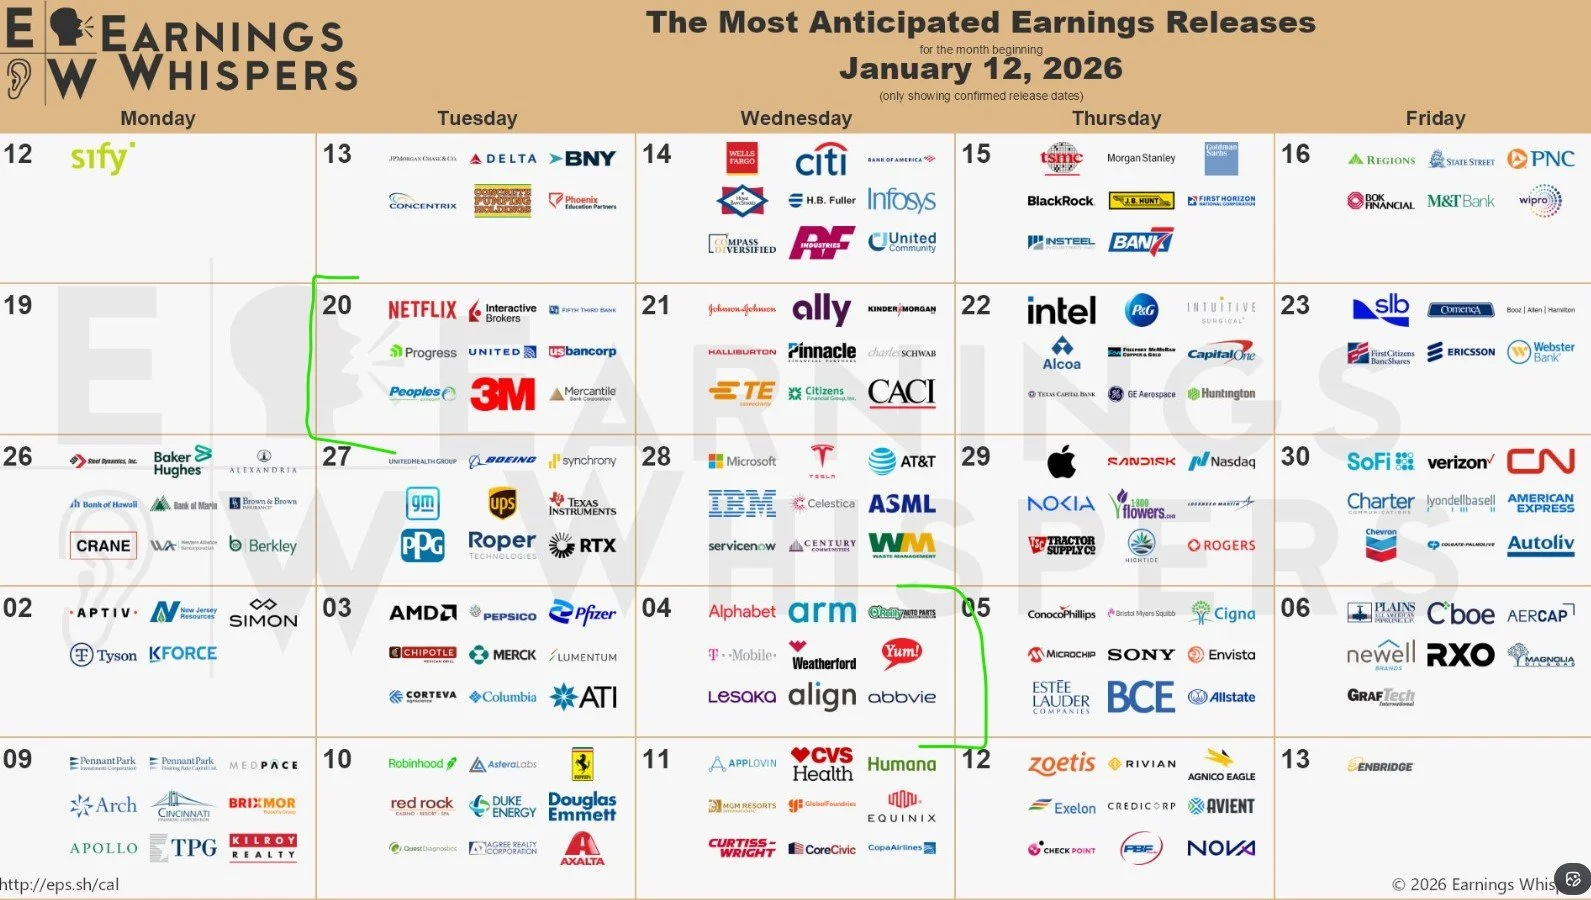
While we see many of the big banks report this week, next week sees the first of the big tech names report, with NFLX kicking off the week. Most of the Magnificent Seven will be done reporting by February 4.
The VIX regained the daily Hull Moving Average today with the gap up, also closing above the weekly Hull (so far).
A close above the weekly Hull this Friday would be the first time in 8 weeks, and the mostly steady move higher above the daily trendline since December 26 certainly lends credibility toward a possible spike in the near-term.
A quick look at the last two times we saw the VIX poke above the weekly Hull after multiple weeks below the line shows at least a temporary spike, even if the downtrend continued thereafter.
If we do see a VIX spike during OpEx, or perhaps heading into VIX expiration a week from tomorrow, 20 appears to be a potential target, based on the GEX picture.
A retest of the weekly Hull is also possible, though reaching that level at 14.58 isn’t a huge move from the current reading just above 15. Downside still appears to be limited for the VIX, with GEX signaling a floor in the 14s for now.
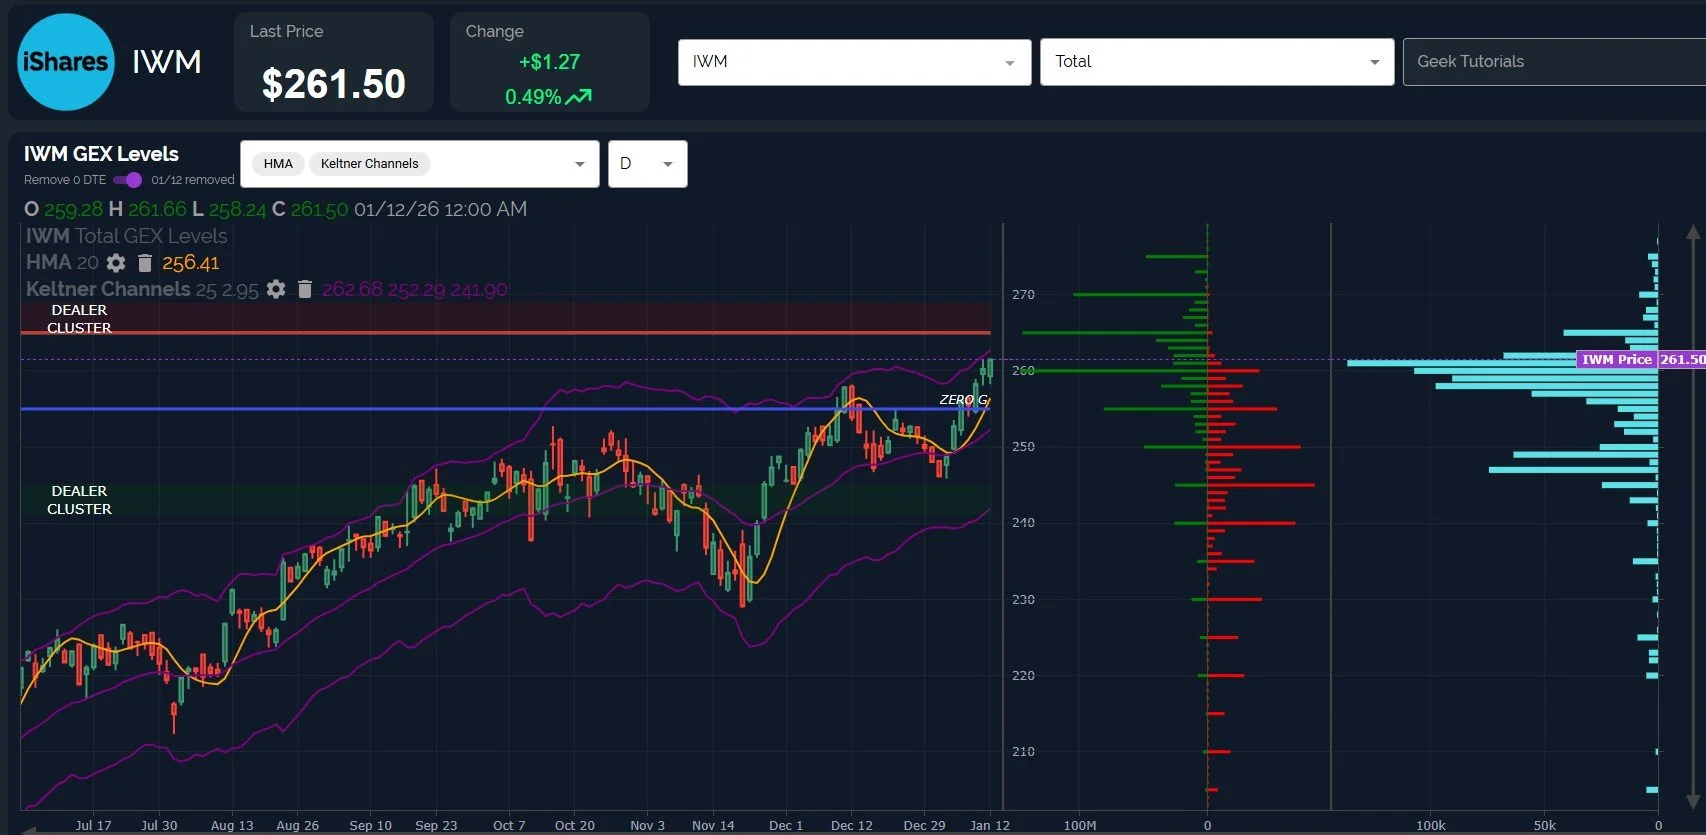
IWM still looks bullish, which is likely a good sign in terms of any upcoming pullback being a buying opportunity.
The current trajectory could easily place IWM at 265-270 before a potential 3-5% pullback, though 265 currently appears to be the odds favorite for consolidation.
A loss of 260 will likely flip the bias toward lower targets, with 250-255 being the initial area where we’ll consider a dip buy.
The rapidly rising Hull may soon meet the upper Keltner channel near 262, which is another potential indicator to watch for a likely reversal lower.
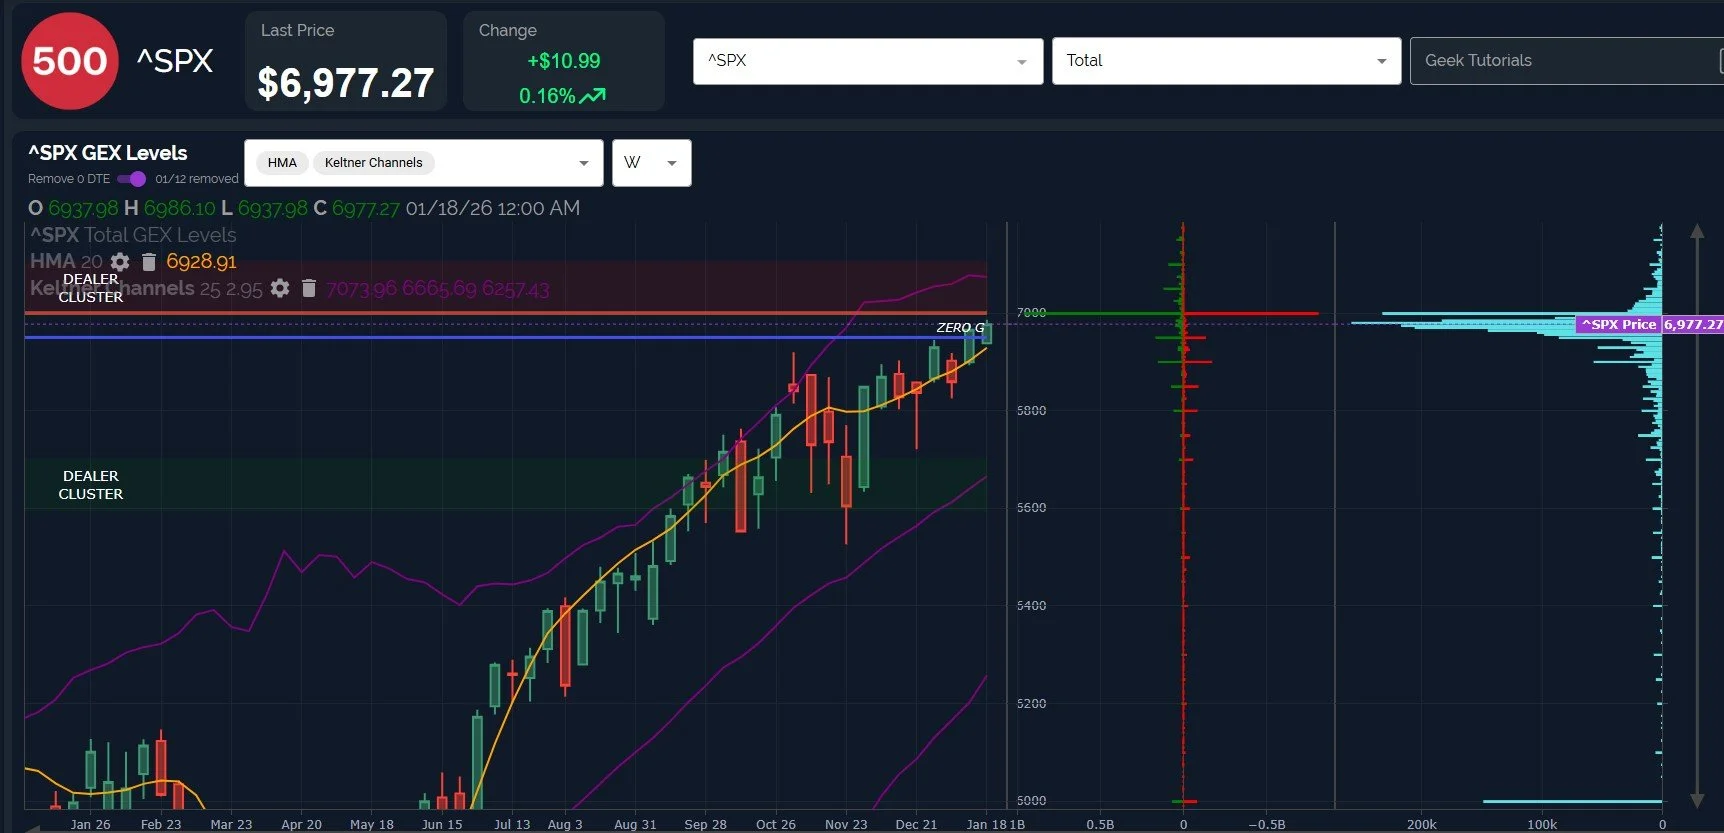
SPX continues inching its way to 7000, competing with watching paint dry on the wall as the least exciting activity on the planet. The daily upper Keltner channel at 7030 potentially represents an “overshoot” target initially, with the 7000 magnet possibly pulling price back down after rallying over 7000, in theory.
The daily chart shown below features net GEX (the purple bars to the right), which reflects relative growth at higher strikes, a change compare to prior weeks. Such growth suggests that SPX may find its way higher as we progress through the Spring.
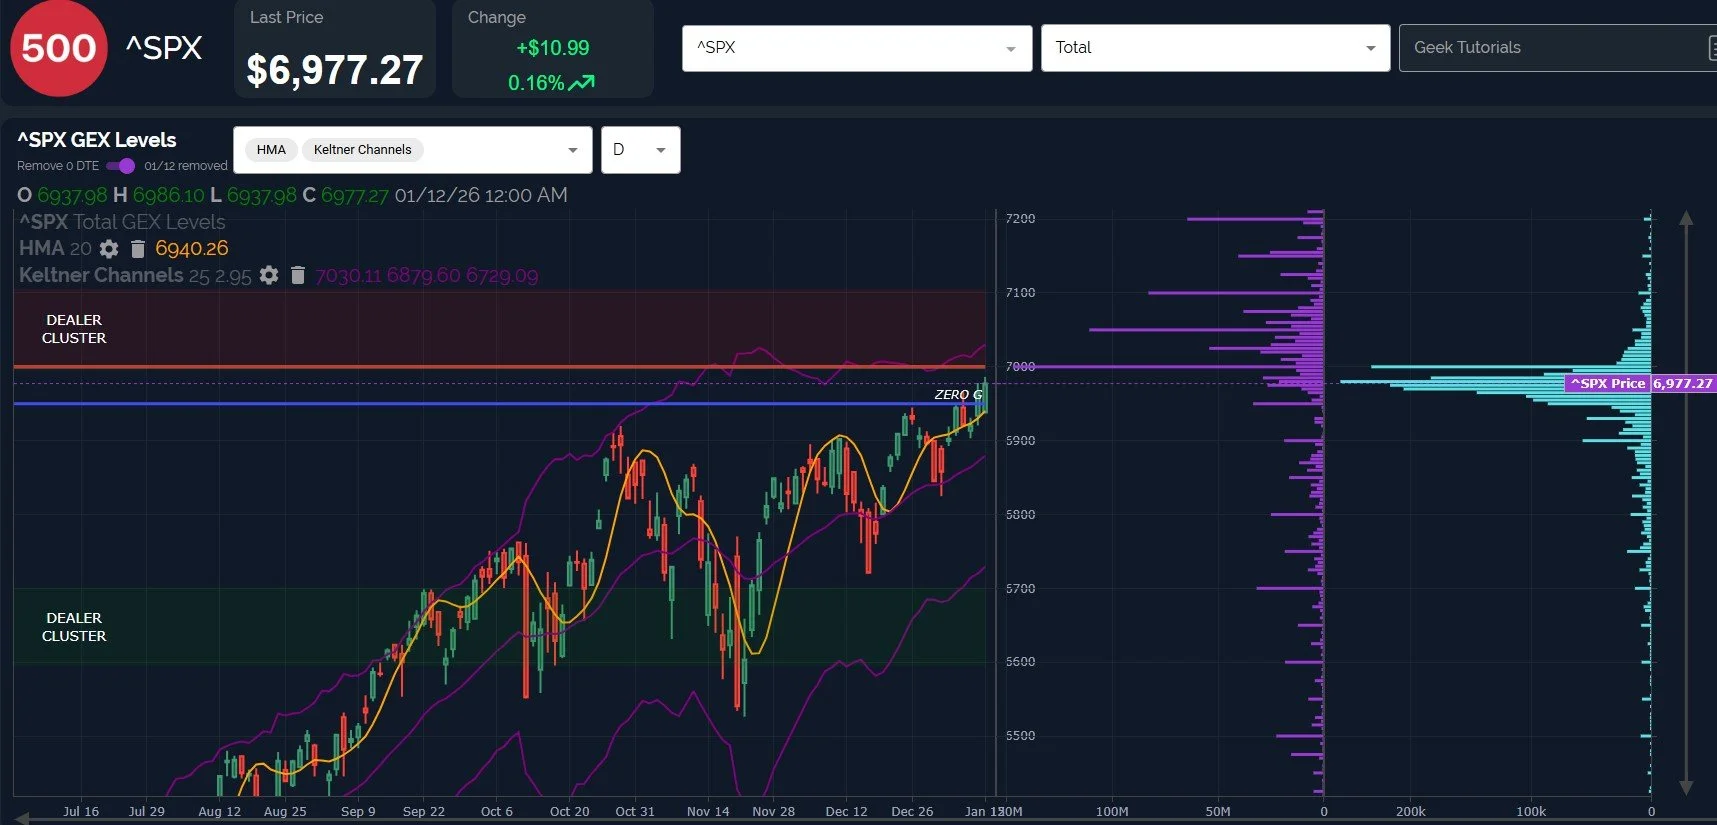
The next chart reflects the gross GEX clusters on both the positive and negative side, better reflecting the significance of 7000, with a relatively massive concentration of both positive and negative GEX. This likely means 7000 will prove to be an area of consolidation before a sustainable move higher, potentially resulting in a pullback from this approximate area.
The weekly upper Keltner channel at 7074 is another potential target if we (briefly) surpass 7000 on the first attempt. We’re talking about basically .50%-1.5% from this point, so the big picture theme at the moment appears to be limited upside as the VIX flirts with a potential spike ahead. Remember- SPX is up 0.68% since 12/26, while the VIX is up 11.1%!
We hope to see you all in Discord later this morning, where we can analyze the initial reaction to JPM’s earnings release.
If you haven’t joined us yet in Discord, go to our homepage and click on Community to enter our server! First-time guests receive a free 7-day trial of the premium Discord channels.
Thanks for being part of our community and know that we invite and appreciate your feedback!
The information provided by Geeks of Finance LLC is for educational purposes only and is not intended to be, nor should be construed as, an offer, recommendation or solicitation to buy or sell any security or instrument or to participate in any transaction or activity. Please view our Investment Adviser Disclaimer and Risk Disclosure.