
Flipping Short-Term Bullish: September 9 Stock Market Preview
PORTFOLIO MANAGER ANNUAL SUBSCRIPTION PROMO- $300 off of the annual Portfolio Manager subscription Enter code SUMMER2025 at checkout! ENDS SOON!
Tonight’s YouTube video can be viewed by clicking here. We discuss QQQ, META, and a couple of other tickers not covered in the newsletter, so give it a look!
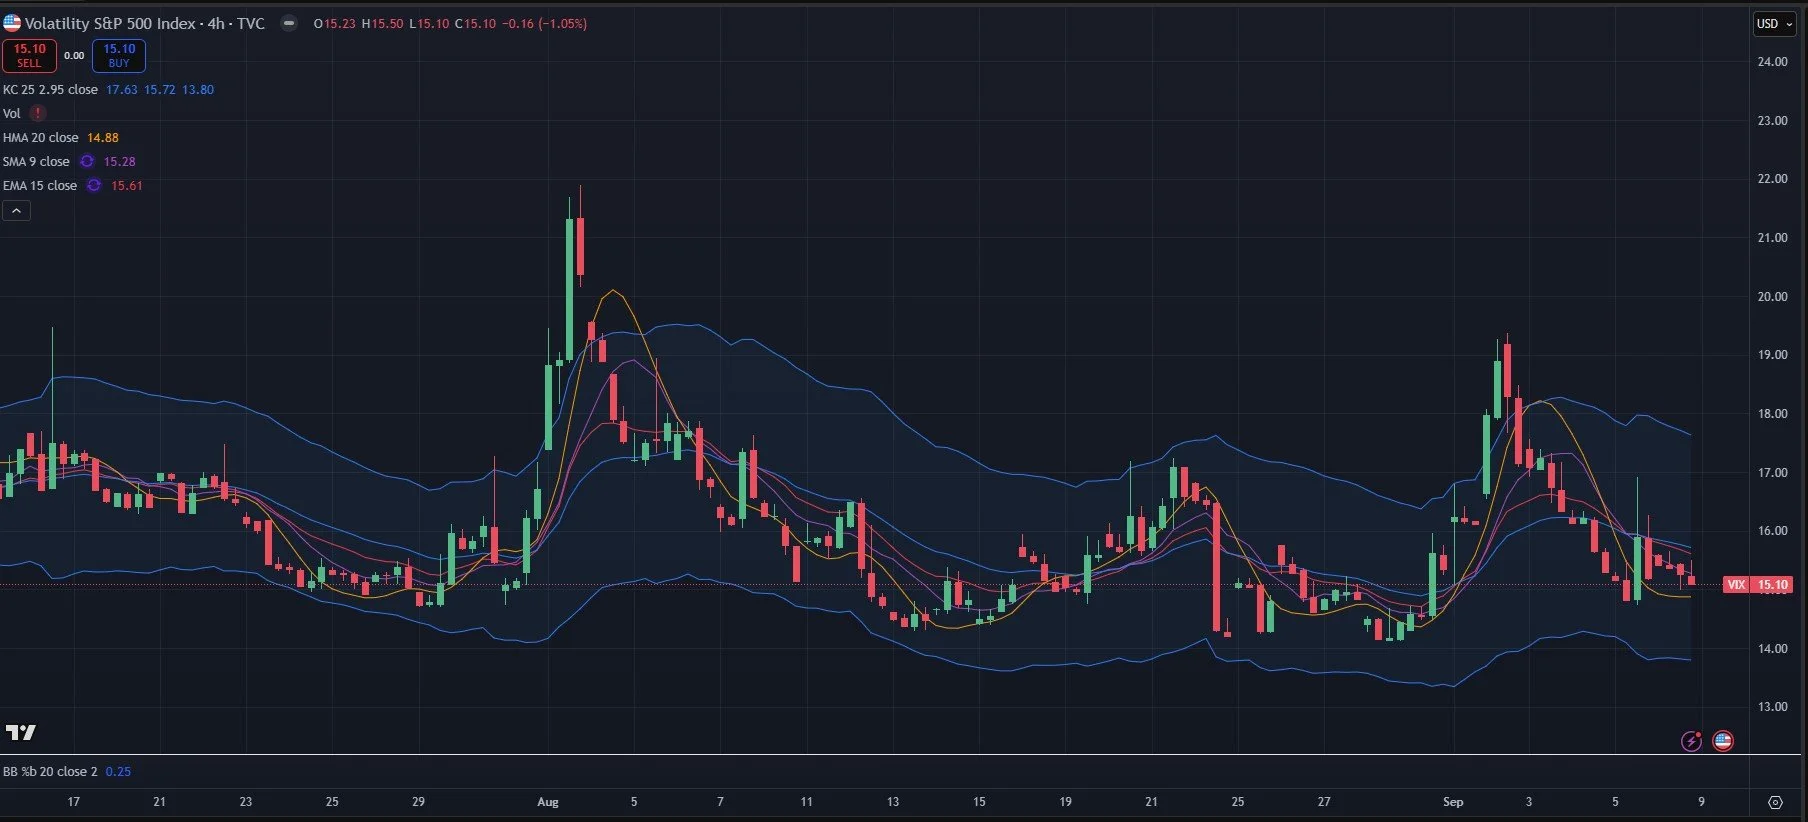
Friday’s mini-spike to 17 on the VIX continued fading today after printing a lower high.
The 4-hour chart is still holding bullish possibilities for the VIX, with the Hull flattening out and the VIX holding above the line (so far).
A breach of 14.88 to the downside for the VIX may see further market upside and a trip down to 14.5 before the next decision is made by VIX participants.
tradingview.com
Why 14.5? The weekly Hull Moving Average is at 14.58. The VIX continues showing very little GEX below 15, and option volume has been almost nonexistent below 15 as well, so base expectations continue to be that the VIX has a very good shot at holding any drop toward 14 and likely rebounding from there.
To open the door to more upside for the VIX, 15.84 needs to be recaptured. Volume today at the 30, 40, and 60 strikes was elevated.

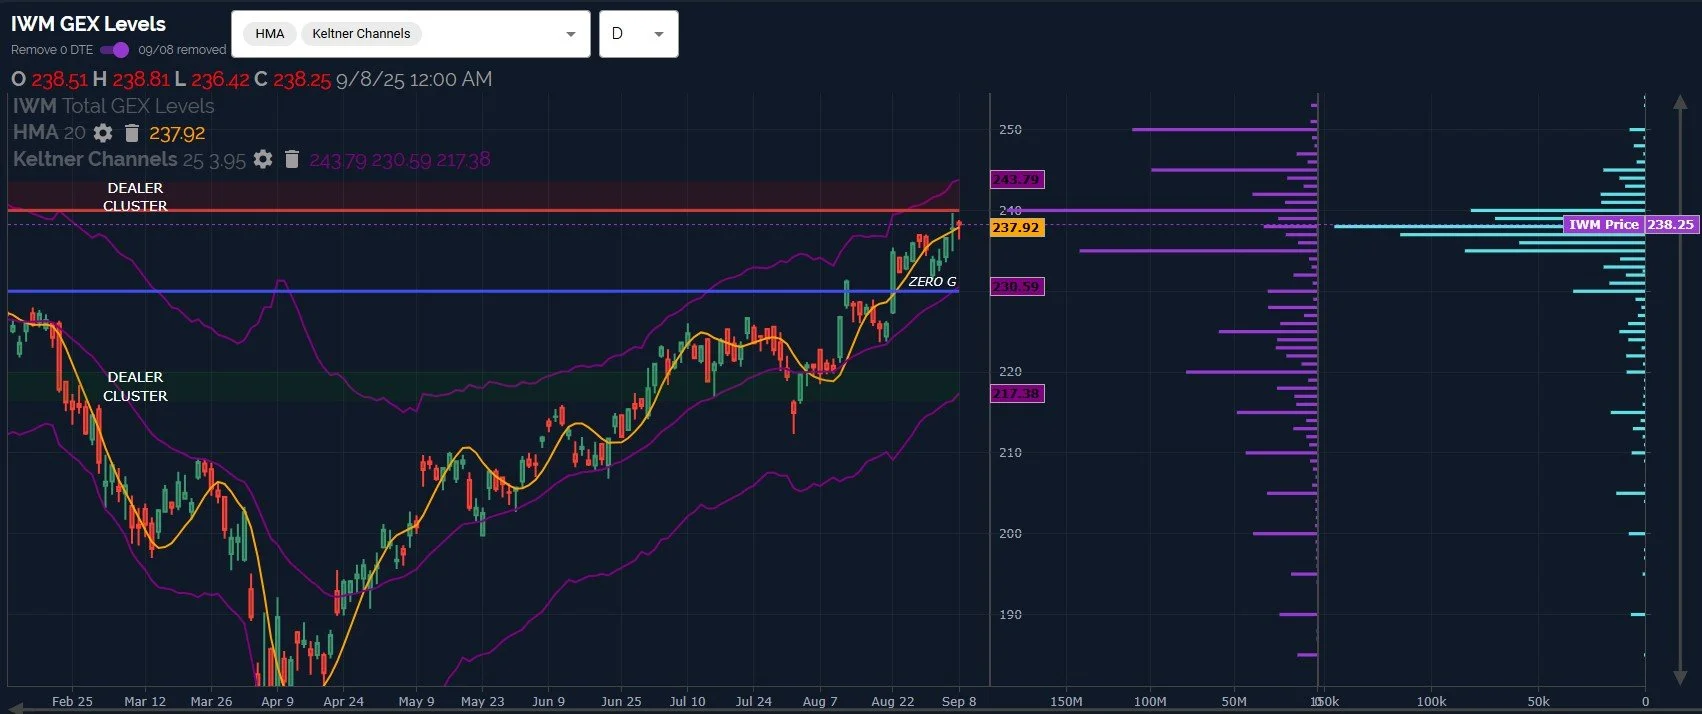
IWM has the most bullish looking chart right now, with the Keltners pointing even more sharply higher than recent weeks, and GEX pointing toward higher strikes, 245 and 250 initially in focus.
IWM narrowly held the rising Hull after dropping below it intraday.
In summary, IWM is still reflecting a “buy-the-dip” setup, though a trip toward GEX clusters at 245-250 and the accompanying upper Keltner channel may end up being another small pullback opportunity.
SPX still holds below the weekly Hull, which is rising, currently sitting at 6549. Given that the Hull is rising, a move of roughly 1% for SPX is required just to reach the line, and we do see GEX shifting higher.
Until proven otherwise (a breach of the Hull and a weekly close above), odds favor SPX continuing to hold below the weekly Hull.

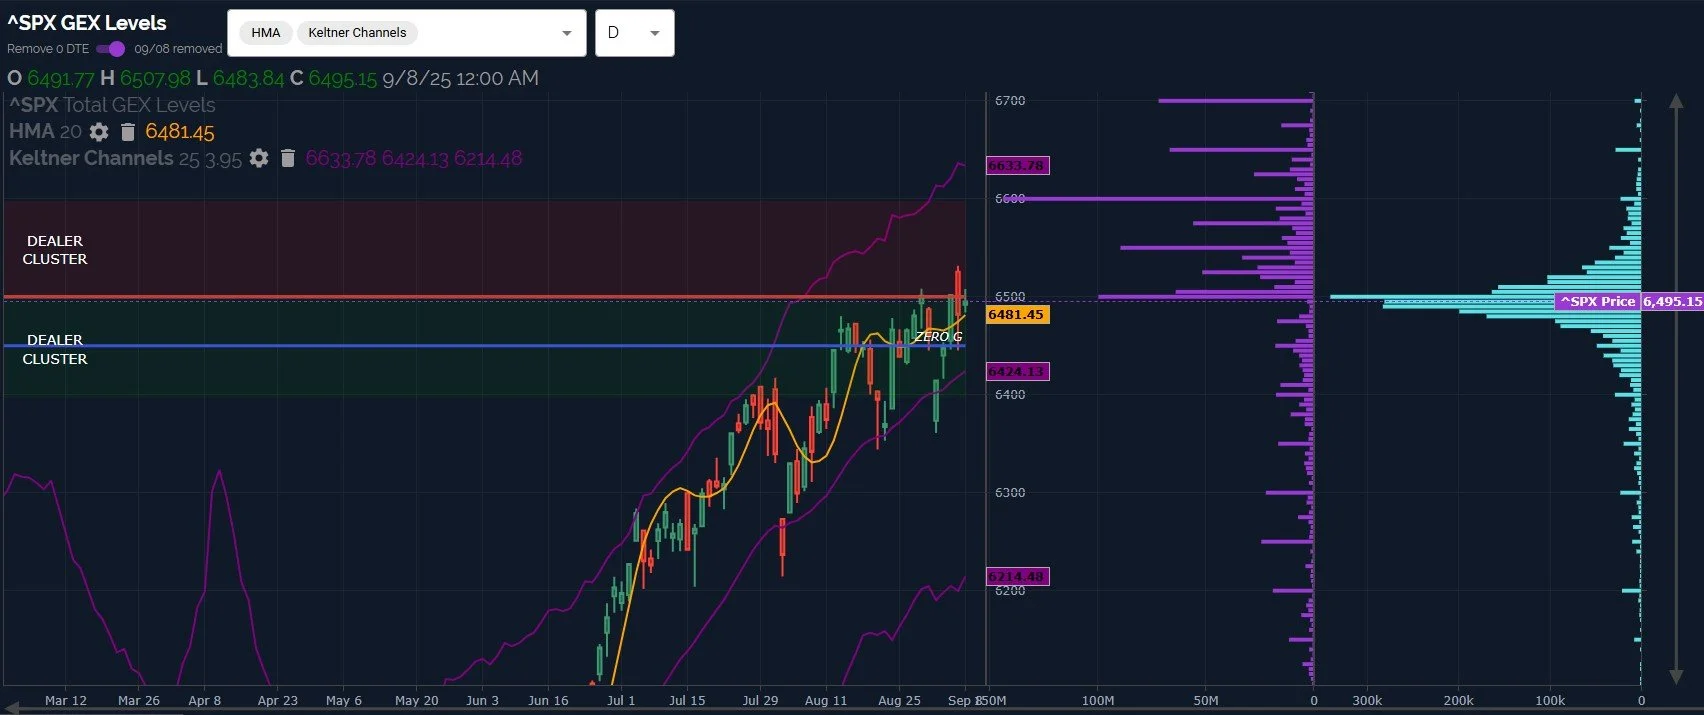
SPX daily presents a conflicting picture with what we see on the weekly chart, with SPX holding above the daily Hull and the upper Keltner diverging slightly higher relative to the lower Keltner.
I also show the daily chart with net GEX reflected instead of gross GEX on the positive and negative sides, highlighting how large the GEX cluster at 6600 has become relative to all others.
I view this as a clear bullish sign that SPX intends to move higher, even if only briefly.
How do we reconcile the weekly Hull acting as resistance at 6549 while the daily chart looks bullish to 6600?
One of many possibilities would be that SPX overshoots the weekly Hull, tests the big GEX cluster at 6600, then fades back below 6550 by the end of the week. We can watch 6481 below as possible support and/or a pivot in the event that we breach the line.
Thanks for reading, we hope you’ll join us for a 7-day trial in Discord where we share real-time updates based on shifts in the GEX picture, as well as additional insights and trade ideas from our great community of experienced traders!
Here’s the link to our Discord server if you haven’t joined us yet! We have an active community of thoughtful and experienced traders who chime in throughout the day, and several channels dedicated to intraday and weekly trading.
You can join our discussion every day when we discuss markets in real-time via our Geeks Live livestream, currently available to all subscribing members!
If you’re interested in accessing our tools and analytics, be sure to check out our website! We have a lot of updates in the works, and we have 2 primary membership tiers that you can read more about by clicking here: All About Our Memberships
If you’re interested in learning more about our strategy and approach, we address all of these topics in our Geek University course which is included in all memberships.
We posted a YouTube video today, as mentioned at the beginning of the newsletter, and we have useful and educational playlists, so give our channel a look if you’re curious about recent market commentary and ideas as well as gamma (GEX) concepts explained.
Thanks for being part of our community and know that we invite your feedback!
The information provided by Geeks of Finance LLC is for educational purposes only and is not intended to be, nor should be construed as, an offer, recommendation or solicitation to buy or sell any security or instrument or to participate in any transaction or activity. Please view our Investment Adviser Disclaimer and Risk Disclosure.